Market Outlook
October 06, 2015
Market Cues
Domestic Indices
Chg (%)
(Pts)
(Close)
Indian markets are expected to open in positive tracking the SGX Nifty and the Asian
BSE Sensex
2.2
565
26,786
cues.
Nifty
2.1
168
8,119
U.S. stocks rallied Monday on renewed hopes that the Federal Reserve will delay
Mid Cap
1.8
194
11,013
raising interest rates. The recent readings on the U.S. economy could force the Fed
Small Cap
1.6
179
11,222
to wait until next year. The Institute for Supply Management released a report on
Bankex
2.8
548
20,156
non manufacturing index showing that growth in the service sector slowed by more
than expected.
Global Indices
Chg (%)
(Pts)
(Close)
The European markets ended the first session of the week with strong gains. The
Dow Jones
1.8
304
16,776
markets pared their early gains on Friday, following the release of the weaker than
Nasdaq
1.6
73
4,781
expected U.S. employment report for September.
FTSE
2.8
169
6,299
Nikkei
1.6
280
18,005
The Indian markets rallied on Monday with key benchmark indexes surging over 2
percent, on the back of strong global cues. Weak U.S. jobs data for September,
Hang Seng
1.6
348
21,855
downward revisions to the prior two months and disappointing factory orders figures
Shanghai Com
0.5
15
3,053
helped push back expectations of an interest-rate rise into next year.
Advances / Declines
Bse
Nse
News Analysis
Advances
2,012
1,019
Alembic Pharma gets USFDA for Zolmitriptan
Credai moves CCI against cement companies
Declines
804
482
Detailed analysis on Pg2
Unchanged
89
68
Investor’s Ready Reckoner
Volumes (` Cr)
Key Domestic & Global Indicators
BSE
3,038
Stock Watch: Latest investment recommendations on 150+ stocks
NSE
18,698
Refer Pg4 onwards
Top Picks
Net Inflows (` Cr)
Net
Mtd
Ytd
CMP
Target
Upside
Company
Sector
Rating
(`)
(`)
(%)
FII
96
96
118,161
Axis Bank
Financials
Buy
512
701
36.9
MFs
1,032
7,708
78,356
ICICI Bank
Financials
Buy
280
370
31.9
Power Grid
Power
Buy
132
170
28.5
Top Gainers
Price (`)
Chg (%)
TCS
IT
Buy
2,713
3,168
16.8
Hcc
23
19.3
Aurobindo Pharma Pharmaceuticals Accumulate
766
872
13.9
Canbk
69
15.2
More Top Picks on Pg3
Pfc
251
11.1
Key Upcoming Events
Eclerx
1,724
9.4
Previous
Consensus
Date
Region
Event Description
Shreecem
12,850
7.4
Reading
Expectations
Oct 07
UK
Industrial Production YoY
0.8
---
Oct 08
UK
BOE Announces rates
0.50
0.50
Top Losers
Price (`)
Chg (%)
Oct 09
India
Imports YoY%
(9.95)
--
Gdl
342
(3.6)
India
Exports YoY%
(20.66)
--
Maruti
4,415
(3.6)
Oct 12
India
Industrial Production YoY
(4.20)
--
Ttkprestig
3,610
(3.6)
Oct 13
UK
CPI (YoY)
--
--
Polaris
186
(2.8)
Sunasian
85
(2.0)
As on October 05, 2015
Market Outlook
October 06, 2015
Alembic Pharma gets USFDA for Zolmitriptan
Alembic has received approval from the USFDA for Zolmitriptan (2.5 mg and
5 mg tablets) on September 30. Zolmitriptan is used in the acute treatment of
migraine attacks. AstraZeneca had US patent for Zolmitriptan, which was selling
by the company under brand names Zomig, Zomigon, AscoTop and Zomigoro in
different countries. Its US patent on Zomig tablets expired in November 2012.
Macleods Pharma is another company which received USFDA approval for the
same drug on same date. Teva Pharma USA, Sun Pharma Global, Mylan Pharma,
Jubilant Generics, Invagen Pharma, Glenmark Generics and Apotex Inc also had
approvals for this drug. The sales of the product are very small and very
competitive, and hence won’t contribute significantly to the overall sales of the
company. We remain neutral on the stock.
Credai moves CCI against cement companies
The Confederation of Real Estate Developers Association of India (Credai) has
moved to the Competition Commission of India (CCI) against the
cement manufacturers that it claims have been unduly increasing the cost of
cement. Credai has also highlighted the violation of CCI’s “cease and desist”
order of 2012 by cement manufacturers. Credai in its complaint has said that the
cost of raw material used in manufacturing cement has come down from January
2015 to September 2015, but cement companies have not passed on the benefit
to customers. Hinting at a cartel-like operation, it also alleged that cement firms
seem to be working together to control supply and prices. Housing and other real
estate sectors account for nearly 60-65 per cent of cement demand in India.
Despite low demand, cement prices have jumped 20-40 per cent in top cities
across the country in the past couple of months. “It is unfair that the cement
manufacturers indulge in practices that control the prices of cement. Credai’s NCR
board had taken a decision to stop procurement of cement from companies like
Ultratech, Lafarge and others that unilaterally increased cement prices in the past
one month. CCI has warned cement manufacturers in the past as well. We expect
cement stocks to remain under pressure in short term. However on long to
medium term perspective we are positive on cement sector and we prefer Ultratech
in large cap and JK Lakshmi cement and Orient Cement in mid cap cement space.
Economic and Political News
Germany offers 2 bn euros for clean energy corridor, solar projects
GDP to exceed 7.5%, taxes to fall short of target: FinMin
Nabard sanctions ` 2,112 cr to Gujarat govt for irrigation projects
Corporate News
Alstom bags Lucknow Metro contract worth ` 1,100 crore
Apollo Tyres opens first outlet in Lebanon
SpiceJet to operate flights to Dubai from Amritsar, Kozhikode
Market Outlook
October 06, 2015
Top Picks ★★★★★
Large Cap
Market Cap
CMP
Target
Upside
Company
Rationale
(` Cr)
(`)
(`)
(%)
Robust US sales along with the acquisations, will aid the growth
Aurobindo
44,708
766
872
13.9
and stable margins.
Healthy pace of branch expansion, backed by distribution
Axis Bank
1,21,758
512
701
36.9
network.
Robust franchise and capital adequacy position will help the
ICICI Bank
1,62,876
280
370
31.9
bank to outperform the industry average.
Back on the growth trend; expect a long term growth of 14% to
Infosys
2,71,154
1,181
1,306
10.6
be a US$20bn in FY2020.
Government thrust on Renewable sector and strong order book
Inox Wind
8,020
361
505
39.7
would drive future growth.
LICHF continues to grow its retail loan book at a healthy pace
LIC HFL
24,395
483
570
17.9
with improvement in asset quality.
Direct beneficiary of the huge investments lined up in the power
Power Grid
69,188
132
170
28.5
transmission sector.
Growth to pick up from 2HFY2017, attractive given the risk-
TCS
5,31,491
2,713
3,168
16.8
reward.
Tech Mahindra
54,807
570
646
13.4
Acquisitions, to drive growth, normalised valuations attractive.
An improving liability franchise, capital adequacy well above
Yes Bank
31,433
751
953
27.0
Basel III requirements and lowest NPA ratio in the industry.
FY2017, to be a good year for the company in terms of growth
Sun Pharma
2,16,146
898
950
5.8
and margins.
Source: Company, Angel Research
Mid Cap
Market Cap
CMP
Target
Upside
Company
Rationale
(` Cr)
(`)
(`)
(%)
Bajaj Electricals
2,510
249
341
37.1
Visible turnaround in E&P business to drive the earnings.
Garware Wall Ropes
790
361
390
8.1
Higher exports & easing material prices to drive profitability.
Comfortable balance sheet to support strong growth; this
MBL Infrastructures
1,011
244
360
47.6
coupled with attractive valuation to lead to rerating.
New product introductions and increased sourcing by clients to
Minda Industries
804
507
652
28.6
enable outpace industry growth.
Strong brand & quality teaching with innovative technologies &
MT Educare
523
131
169
28.8
higher government educational spending to boost growth.
Earnings boost on back of stable material prices and favorable
Radico Khaitan
1,150
86
112
29.6
pricing environment. Valuation discount to peers provides
additional comfort.
Structural shift in the Lighting industry towards LED lighting will
Surya Roshni
578
132
183
38.8
drive growth.
Tree House
1,308
309
449
45.3
Robust expansion plan for pre-schools to drive growth.
Source: Company, Angel Research
Market Outlook
October 06, 2015
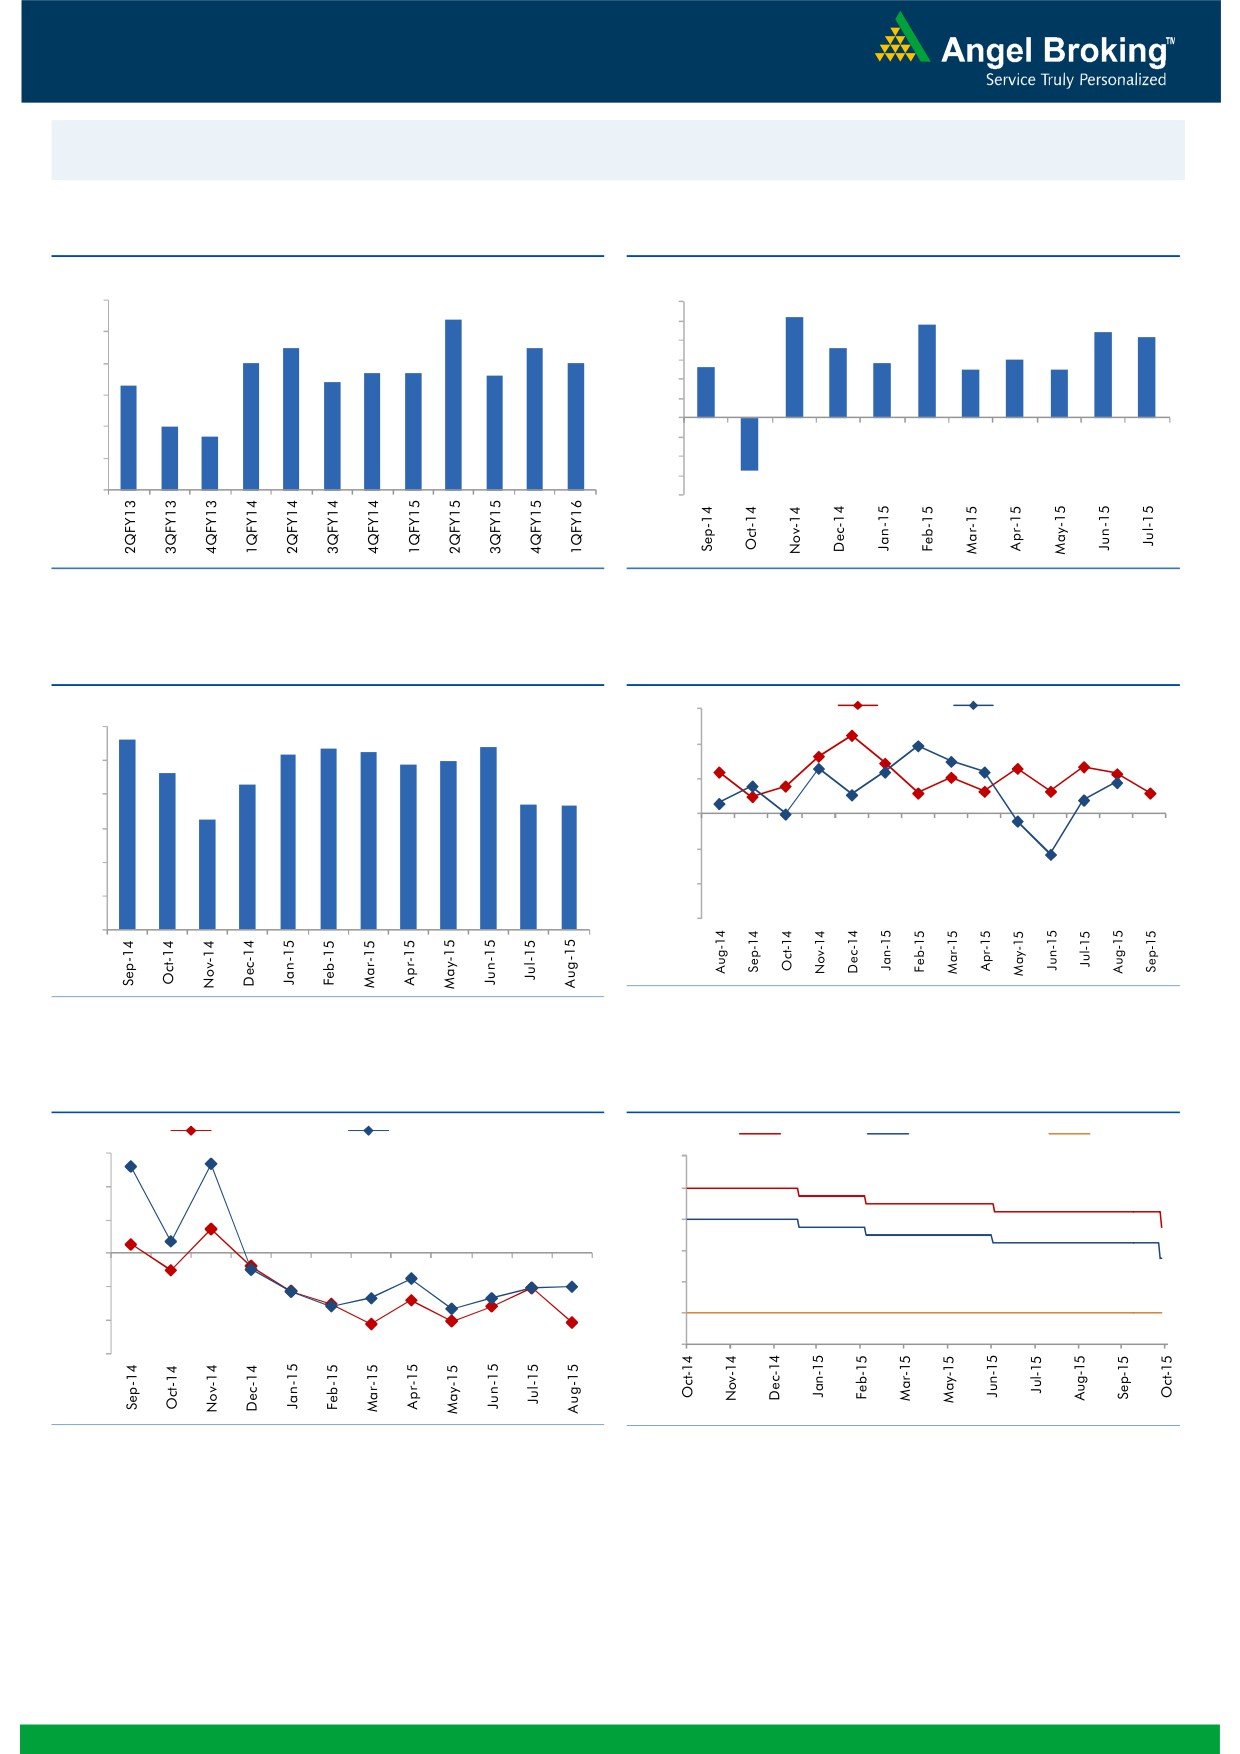
Macro watch
Exhibit 1: Quarterly GDP trends
Exhibit 2: IIP trends
(%)
(%)
9.0
8.4
6.0
5.2
4.8
5.0
4.4
4.2
8.0
7.5
7.5
3.6
4.0
3.0
7.0
7.0
2.6
2.8
6.7
6.7
2.5
2.5
7.0
6.4
6.6
3.0
6.3
2.0
6.0
1.0
5.0
4.7
-
5.0
(1.0)
4.0
(2.0)
(3.0)
3.0
(2.7)
(4.0)
Source: CSO, Angel Research
Source: MOSPI, Angel Research
Exhibit 3: Monthly CPI inflation trends
Exhibit 4: Manufacturing and services PMI
(%)
56.0
Mfg. PMI
Services PMI
6.0
5.6
5.4
5.2
5.4
5.3
4.9
5.0
54.0
5.0
4.6
4.3
52.0
3.7
3.7
4.0
3.3
50.0
3.0
48.0
2.0
46.0
1.0
44.0
-
Source: Market, Angel Research; Note: Level above 50 indicates expansion
Source: MOSPI, Angel Research
Exhibit 5: Exports and imports growth trends
Exhibit 6: Key policy rates
(%)
Exports yoy growth
Imports yoy growth
(%)
Repo rate
Reverse Repo rate
CRR
30.0
9.00
20.0
8.00
10.0
7.00
0.0
6.00
5.00
(10.0)
4.00
(20.0)
3.00
(30.0)
Source: Bloomberg, Angel Research
Source: RBI, Angel Research
Market Outlook
October 06, 2015
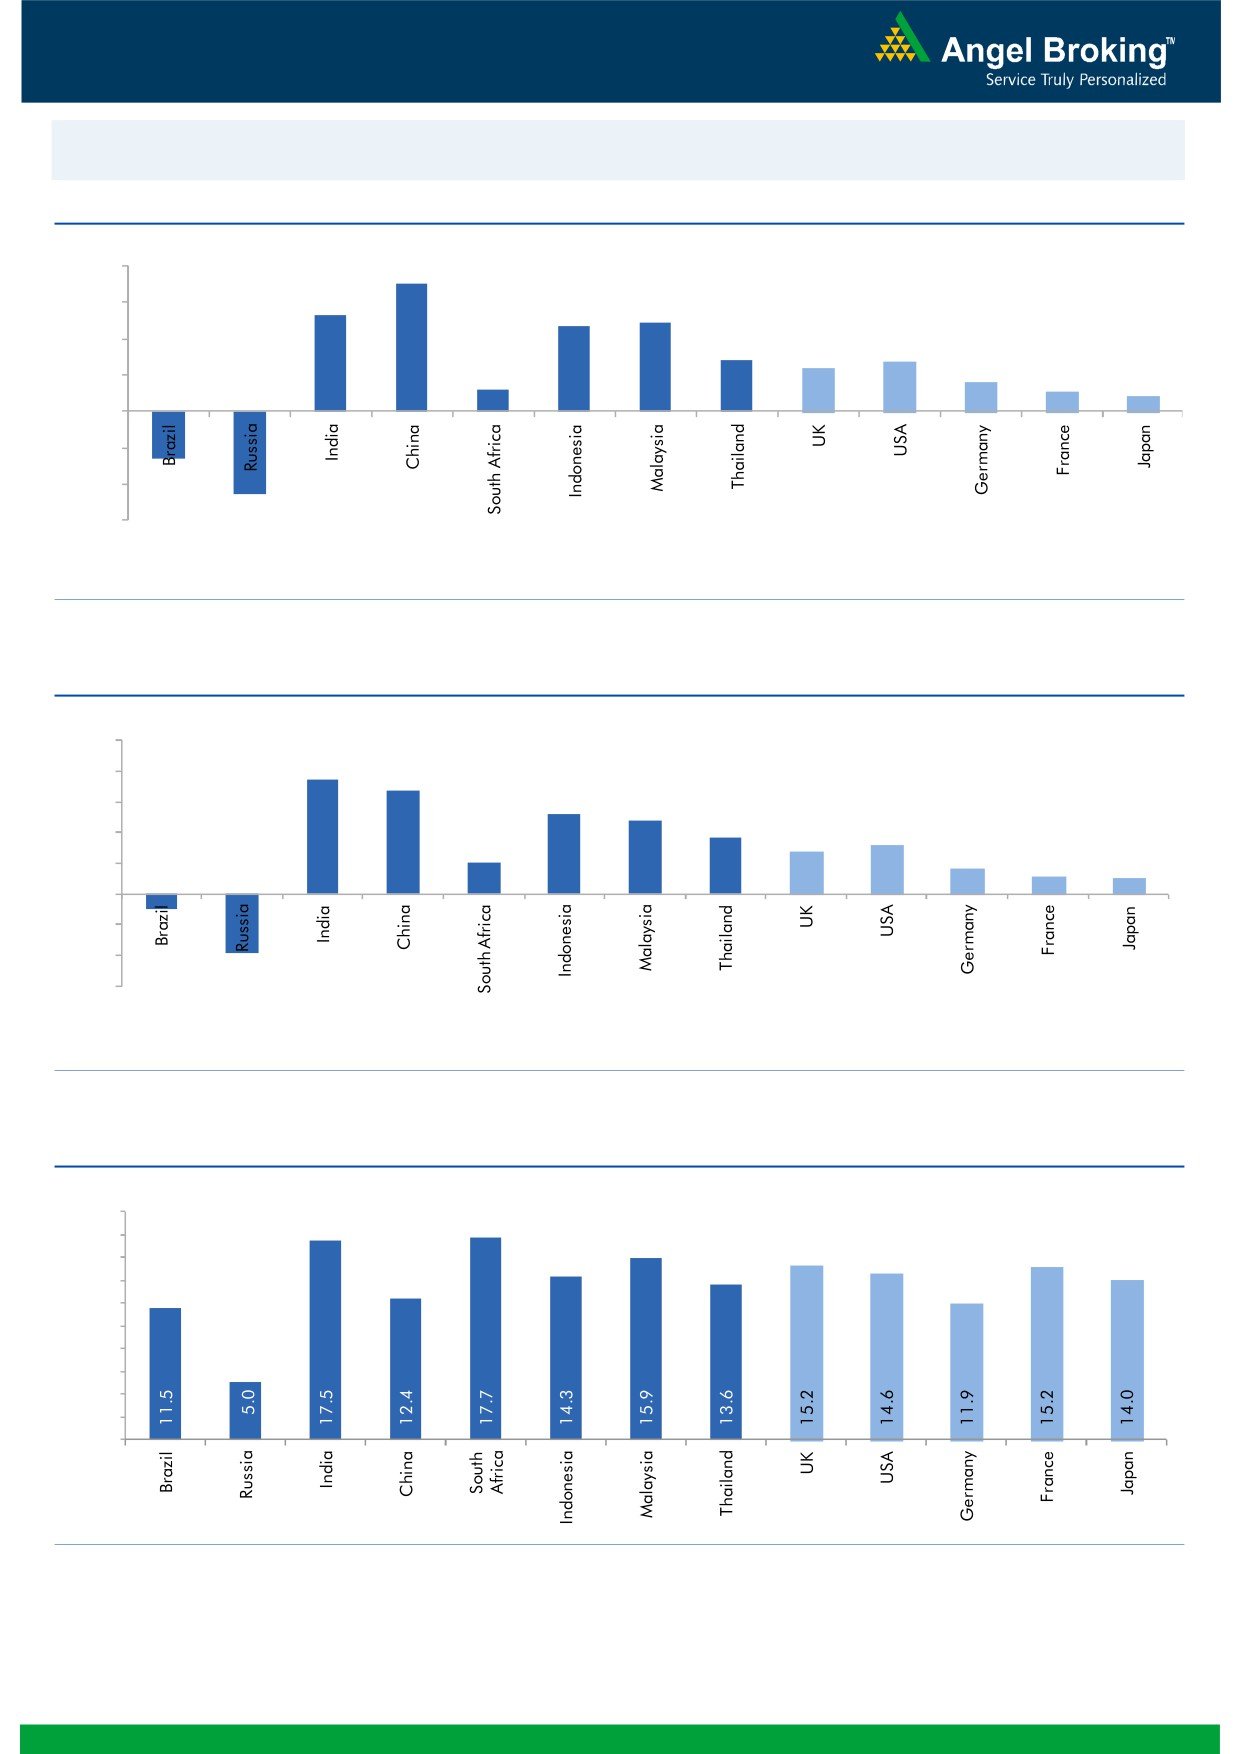
Global watch
Exhibit 1: Latest quarterly GDP Growth (%, yoy) across select developing and developed countries
(%)
8.0
7.0
6.0
5.3
4.9
4.7
4.0
2.8
2.7
2.4
1.6
2.0
1.2
1.1
0.8
-
(2.0)
(2.6)
(4.0)
(4.6)
(6.0)
Source: Bloomberg, Angel Research
Exhibit 2: 2015 GDP Growth projection by IMF (%, yoy) across select developing and developed countries
(%)
10.0
7.5
8.0
6.8
5.2
6.0
4.8
3.7
3.1
4.0
2.7
2.0
1.6
1.2
1.0
2.0
-
(2.0)
(4.0)
(1.0)
(3.8)
(6.0)
Source: IMF, Angel Research
Exhibit 3: One year forward P-E ratio across select developing and developed countries
(x)
20.0
18.0
16.0
14.0
12.0
10.0
8.0
6.0
4.0
2.0
-
Source: IMF, Angel Research
Market Outlook
October 06, 2015
Exhibit 4: Relative performance of indices across globe
Returns (%)
Country
Name of index
Closing price
1M
3M
1YR
Brazil
Bovespa
47,033
(4.4)
(15.1)
(19.5)
Russia
Micex
1,613
(5.2)
0.1
16.7
India
Nifty
7,951
(0.0)
(5.0)
(2.4)
China
Shanghai Composite
3,053
(1.0)
(28.6)
31.1
South Africa
Top 40
45,668
1.1
(2.7)
1.5
Mexico
Mexbol
42,735
(1.5)
(5.1)
(5.2)
Indonesia
LQ45
701
(8.3)
(15.9)
(19.6)
Malaysia
KLCI
1,629
1.0
(4.6)
(11.5)
Thailand
SET 50
868
(4.1)
(12.8)
(17.8)
USA
Dow Jones
16,472
(2.2)
(7.6)
(3.1)
UK
FTSE
6,130
0.8
(6.9)
(6.6)
Japan
Nikkei
17,725
(7.4)
(12.4)
9.4
Germany
DAX
9,553
(5.8)
(13.0)
2.0
France
CAC
4,459
(4.2)
(7.9)
3.9
Source: Bloomberg, Angel Research
Stock Watch
October 06, 2015
Company Name
Reco
CMP
Target
Mkt Cap
Sales ( Čcr )
OPM(%)
EPS (Č)
PER(x)
P/BV(x)
RoE(%)
EV/Sales(x)
(Č)
Price ( Č)
( Č cr )
FY16E FY17E
FY16E
FY17E
FY16E
FY17E
FY16E
FY17E
FY16E
FY17E
FY16E
FY17E
FY16E
FY17E
Agri / Agri Chemical
Rallis
Neutral
218
-
4,232
2,075
2,394
14.4
14.4
9.5
11.0
22.9
19.8
4.6
3.9
21.1
21.3
2.1
1.8
United Phosphorus
Accumulate
453
510
19,411
13,698
15,752
17.6
17.6
32.1
38.5
14.1
11.8
2.8
2.3
21.4
21.3
1.5
1.3
Auto & Auto Ancillary
Ashok Leyland
Accumulate
95
102
26,950
18,763
22,357
11.1
11.2
3.6
4.8
26.3
19.7
4.9
4.5
18.7
22.6
1.4
1.1
Bajaj Auto
Neutral
2,384
-
68,997
23,544
27,245
19.8
19.8
127.0
143.4
18.8
16.6
5.7
4.9
30.3
29.4
2.5
2.1
Eicher Motors
Buy
18,773
22,859
50,954
11,681
15,550
15.3
16.9
358.5
564.3
52.4
33.3
15.7
11.7
29.8
34.9
4.2
3.2
Hero Motocorp
Accumulate
2,502
2,672
49,955
28,500
32,764
14.1
14.3
146.9
167.0
17.0
15.0
6.4
5.5
37.8
36.5
1.6
1.4
L G Balakrishnan & Bros Neutral
437
-
685
1,254
1,394
11.6
11.8
35.9
41.7
12.2
10.5
1.7
1.5
13.5
13.8
0.7
0.6
Mahindra and Mahindra Accumulate
1,270
1,357
78,900
37,986
42,660
12.8
13.2
51.6
61.9
24.6
20.5
3.6
3.2
14.6
15.6
1.7
1.5
Maruti
Accumulate
4,415
4,960
133,382
58,102
68,587
16.7
16.9
182.0
225.5
24.3
19.6
4.8
4.1
19.9
21.0
2.1
1.7
Minda Industries
Buy
507
652
804
2,567
2,965
7.3
8.0
38.8
54.3
13.1
9.3
1.9
1.6
14.4
16.8
0.4
0.3
Rane Brake Lining
Buy
289
366
229
454
511
11.1
11.4
23.8
28.1
12.1
10.3
1.7
1.6
14.2
15.3
0.6
0.6
Setco Automotive
Neutral
235
-
627
594
741
12.7
13.7
8.4
15.8
27.9
14.9
2.9
2.5
10.4
16.9
1.5
1.2
Tata Motors
Neutral
315
-
91,005
264,038
297,882
13.8
13.9
34.5
38.9
9.1
8.1
1.5
1.3
17.6
16.8
0.5
0.5
TVS Motor
Neutral
229
-
10,879
11,702
13,713
6.8
7.7
10.1
14.5
22.7
15.8
5.5
4.5
24.5
28.3
0.9
0.8
Amara Raja Batteries
Neutral
1,034
-
17,668
5,101
6,224
17.8
17.6
31.1
39.2
33.3
26.4
8.3
6.6
24.8
24.8
3.4
2.7
Exide Industries
Neutral
153
-
12,997
7,363
8,247
13.7
14.5
6.6
7.7
23.2
19.9
2.9
2.7
12.6
13.3
1.5
1.3
Apollo Tyres
Neutral
191
-
9,722
12,576
12,978
16.8
16.1
22.3
19.9
8.6
9.6
1.5
1.3
17.2
13.4
0.8
0.9
Ceat
Neutral
1,271
-
5,139
6,041
6,597
14.3
14.2
101.5
116.6
12.5
10.9
2.5
2.1
20.0
19.1
1.0
0.9
JK Tyres
Neutral
104
-
2,358
7,446
7,669
15.2
14.0
19.6
18.4
5.3
5.7
1.3
1.1
25.2
19.5
0.7
0.6
Swaraj Engines
Neutral
881
-
1,094
593
677
14.5
14.8
51.2
60.8
17.2
14.5
4.0
3.6
23.3
24.8
1.7
1.4
Subros
Neutral
78
-
465
1,268
1,488
11.6
11.9
3.7
6.6
21.0
11.8
1.4
1.3
6.8
11.4
0.7
0.6
Indag Rubber
Neutral
185
-
485
283
329
17.0
17.2
13.0
15.4
14.3
12.0
3.1
2.6
21.8
21.6
1.4
1.2
Capital Goods
ACE
Neutral
39
-
382
660
839
4.7
8.2
1.0
3.9
38.7
9.9
1.2
1.1
3.2
11.3
0.7
0.6
BEML
Neutral
1,247
-
5,192
3,277
4,006
6.0
8.9
29.2
64.3
42.7
19.4
2.4
2.2
5.7
11.7
1.7
1.3
BGR Energy
Neutral
112
-
805
3,615
3,181
9.5
9.4
16.7
12.4
6.7
9.0
0.6
0.6
10.0
7.0
0.6
0.8
BHEL
Neutral
204
-
49,882
33,722
35,272
10.8
11.7
10.5
14.2
19.4
14.4
1.4
1.4
7.0
9.0
1.6
1.5
Blue Star
Accumulate
339
387
3,053
3,649
4,209
5.0
5.9
9.2
14.7
37.1
23.1
6.7
6.3
9.1
17.5
0.9
0.8
Crompton Greaves
Buy
174
204
10,918
13,484
14,687
4.9
6.2
4.5
7.1
38.7
24.5
2.7
2.6
7.2
10.8
0.9
0.9
Inox Wind
Buy
361
505
8,020
4,980
5,943
17.0
17.5
26.6
31.6
13.6
11.4
4.1
3.0
35.0
30.0
1.8
1.4
Stock Watch
October 06, 2015
Company Name
Reco
CMP
Target
Mkt Cap
Sales ( Čcr )
OPM(%)
EPS (Č)
PER(x)
P/BV(x)
RoE(%)
EV/Sales(x)
(Č)
Price ( Č)
( Č cr )
FY16E
FY17E
FY16E
FY17E
FY16E
FY17E
FY16E
FY17E
FY16E
FY17E
FY16E
FY17E
FY16E
FY17E
Capital Goods
KEC International
Neutral
146
-
3,765
8,791
9,716
6.1
6.8
5.4
8.2
27.1
17.9
2.7
2.5
10.0
14.0
0.6
0.6
Thermax
Neutral
856
-
10,195
6,413
7,525
7.4
8.5
30.5
39.3
28.1
21.8
4.3
3.8
15.0
17.0
1.6
1.3
Cement
ACC
Accumulate
1,373
1,548
25,773
11,856
14,092
14.5
17.8
47.6
76.1
28.8
18.0
3.0
2.7
10.6
15.7
2.0
1.7
Ambuja Cements
Accumulate
210
233
32,629
10,569
12,022
20.7
22.2
8.7
10.7
24.2
19.7
3.1
2.9
13.0
15.2
2.7
2.4
India Cements
Buy
85
112
2,620
4,716
5,133
15.9
16.9
3.7
7.5
23.1
11.4
0.9
0.8
3.8
7.3
0.9
0.7
JK Cement
Buy
653
767
4,564
4,056
4,748
14.5
17.0
22.6
41.1
28.9
15.9
2.6
2.3
9.3
15.3
1.6
1.3
J K Lakshmi Cement
Accumulate
378
430
4,442
2,947
3,616
16.7
19.9
11.5
27.2
32.8
13.9
3.1
2.7
9.8
20.8
1.9
1.5
Mangalam Cements
Neutral
229
-
611
1,053
1,347
10.5
13.3
8.4
26.0
27.3
8.8
1.2
1.1
4.3
12.5
1.0
0.7
Orient Cement
Accumulate
167
183
3,424
1,854
2,524
21.2
22.2
7.7
11.1
21.7
15.1
3.1
2.7
13.3
15.7
2.6
1.8
Ramco Cements
Neutral
337
-
8,023
4,036
4,545
20.8
21.3
15.1
18.8
22.3
17.9
2.7
2.4
12.9
14.3
2.5
2.1
Shree Cement^
Neutral
12,566
-
43,778
7,150
8,742
26.7
28.6
228.0
345.5
55.1
36.4
8.1
6.8
15.7
20.3
5.9
4.7
UltraTech Cement
Buy
2,818
3,282
77,317
27,562
31,548
20.4
22.3
111.9
143.3
25.2
19.7
3.6
3.1
15.2
16.8
2.9
2.5
Construction
ITNL
Neutral
101
-
2,484
7,360
8,825
34.0
35.9
1.0
5.0
100.7
20.1
0.4
0.4
0.3
1.4
3.8
3.7
KNR Constructions
Neutral
582
-
1,637
915
1,479
14.3
13.9
20.3
37.2
28.7
15.7
2.6
2.3
9.6
15.6
1.9
1.2
Larsen & Toubro
Buy
1,551
2,013
144,318
68,920
82,446
10.9
11.5
57.0
73.0
27.2
21.2
2.5
2.3
13.6
15.5
2.3
1.9
Gujarat Pipavav Port
Neutral
197
-
9,507
721
784
53.1
53.6
8.2
9.1
23.9
21.6
3.9
3.1
20.0
18.3
12.7
11.3
MBL Infrastructures
Buy
244
360
1,011
2,313
2,797
12.2
14.6
19.0
20.0
12.8
12.2
1.3
1.2
11.3
10.6
1.1
1.0
Nagarjuna Const.
Neutral
76
-
4,231
7,892
8,842
8.3
9.1
2.4
5.3
31.7
14.4
1.3
1.2
4.2
8.6
0.8
0.7
PNC Infratech
Neutral
520
-
2,665
1,798
2,132
13.2
13.5
22.0
30.0
23.6
17.3
2.1
1.9
11.5
11.4
1.6
1.3
Simplex Infra
Neutral
288
-
1,425
6,241
7,008
10.4
10.7
20.0
36.0
14.4
8.0
1.2
1.1
6.8
11.1
0.7
0.6
Financials
Allahabad Bank
Neutral
77
-
4,371
8,438
9,521
2.8
2.8
21.9
27.0
3.5
2.8
0.4
0.3
10.2
11.5
-
-
Axis Bank
Buy
512
701
121,758
26,941
32,298
3.5
3.6
37.4
46.4
13.7
11.0
2.8
2.4
18.7
20.0
-
-
Bank of Baroda
Neutral
187
-
41,267
19,027
21,737
1.9
2.0
16.9
24.5
11.0
7.6
1.0
0.9
9.1
12.1
-
-
Bank of India
Neutral
139
-
9,256
16,438
18,706
1.9
2.0
19.2
40.9
7.3
3.4
0.4
0.4
4.5
9.1
-
-
Canara Bank
Neutral
290
-
14,941
15,491
17,269
2.0
2.0
61.6
70.9
4.7
4.1
0.5
0.5
10.5
11.1
-
-
Dena Bank
Neutral
40
-
2,250
3,498
3,977
2.1
2.3
7.8
10.7
5.2
3.8
0.4
0.3
6.5
8.4
-
-
Federal Bank
Neutral
65
-
11,159
3,527
4,135
3.0
3.1
5.2
6.7
12.5
9.7
1.3
1.2
10.8
12.7
-
-
HDFC
Neutral
1,256
-
198,156
10,883
12,799
3.5
3.4
43.0
50.6
29.2
24.8
5.8
5.2
25.9
26.7
-
-
HDFC Bank
Accumulate
1,096
1,255
276,044
38,059
46,851
4.4
4.5
50.0
62.7
21.9
17.5
3.8
3.3
18.8
20.2
-
-
Stock Watch
October 06, 2015
Company Name
Reco
CMP
Target
Mkt Cap
Sales ( Čcr )
OPM(%)
EPS (Č)
PER(x)
P/BV(x)
RoE(%)
EV/Sales(x)
(Č)
Price ( Č)
( Č cr )
FY16E
FY17E
FY16E
FY17E
FY16E
FY17E
FY16E
FY17E
FY16E
FY17E
FY16E
FY17E
FY16E
FY17E
Financials
ICICI Bank
Buy
280
370
162,876
35,810
41,871
3.4
3.5
22.0
26.2
12.8
10.7
2.2
1.9
15.0
15.6
-
-
IDBI Bank
Neutral
80
-
12,840
9,860
10,978
1.8
1.9
9.3
15.6
8.6
5.2
0.6
0.5
6.4
10.1
-
-
Indian Bank
Neutral
137
-
6,592
6,267
7,171
2.4
2.5
25.4
32.1
5.4
4.3
0.4
0.4
8.0
9.3
-
-
LIC Housing Finance
Buy
483
570
24,395
2,934
3,511
2.3
2.3
30.9
36.8
15.6
13.1
2.5
2.2
16.8
17.5
-
-
Oriental Bank
Neutral
138
-
4,124
7,730
8,595
2.4
2.5
38.8
47.4
3.6
2.9
0.3
0.3
8.6
9.8
-
-
Punjab Natl.Bank
Neutral
136
-
25,268
23,446
26,624
2.8
2.9
17.8
27.5
7.7
5.0
0.8
0.6
8.5
12.1
-
-
South Ind.Bank
Neutral
23
-
3,045
1,930
2,215
2.4
2.4
2.6
3.6
8.7
6.3
0.9
0.8
9.9
12.5
-
-
St Bk of India
Buy
240
307
181,476
83,847
96,307
2.8
2.8
20.1
25.1
11.9
9.6
1.3
1.2
11.5
13.1
-
-
Union Bank
Neutral
182
-
11,593
12,755
14,439
2.3
2.4
31.5
39.9
5.8
4.6
0.6
0.5
9.9
11.6
-
-
Vijaya Bank
Neutral
35
-
2,968
3,594
3,969
1.8
1.9
5.8
7.1
5.9
4.9
0.5
0.5
8.2
9.3
-
-
Yes Bank
Buy
751
953
31,433
7,204
9,078
3.2
3.2
57.8
69.5
13.0
10.8
2.3
2.0
19.6
22.6
-
-
FMCG
Asian Paints
Neutral
855
-
82,011
16,553
19,160
16.0
16.2
17.7
21.5
48.4
39.8
12.8
11.6
29.4
31.2
4.8
4.1
Britannia
Neutral
3,214
-
38,555
8,065
9,395
9.6
10.2
47.2
65.5
68.1
49.1
22.6
21.4
38.3
41.2
4.6
4.0
Colgate
Neutral
963
-
26,188
4,836
5,490
19.5
19.7
48.5
53.2
19.9
18.1
14.6
12.7
99.8
97.5
5.3
4.7
Dabur India
Neutral
276
-
48,488
9,370
10,265
17.1
17.2
7.3
8.1
37.6
34.1
11.4
9.2
33.7
30.6
5.1
4.6
GlaxoSmith Con*
Neutral
6,047
-
25,432
4,919
5,742
17.2
17.4
168.3
191.2
35.9
31.6
10.2
8.7
28.8
28.9
4.7
4.0
Godrej Consumer
Neutral
1,309
-
44,564
10,168
12,886
16.1
16.1
32.1
38.4
40.8
34.1
8.3
7.7
19.7
21.0
4.5
3.5
HUL
Neutral
810
-
175,295
34,940
38,957
17.5
17.7
20.8
24.7
38.9
32.8
43.3
34.6
110.5
114.2
4.8
4.3
ITC
Buy
329
409
264,112
41,068
45,068
37.8
37.4
13.9
15.9
23.6
20.7
7.9
7.0
34.1
33.8
6.1
5.5
Marico
Neutral
403
-
25,997
6,551
7,766
15.7
16.0
10.4
12.5
38.8
32.2
11.3
9.4
33.2
32.4
3.9
3.3
Nestle*
Neutral
6,462
-
62,300
11,291
12,847
22.2
22.3
158.9
184.6
40.7
35.0
21.3
19.1
55.0
57.3
5.4
4.7
Tata Global
Accumulate
132
144
8,315
8,635
9,072
9.8
9.9
6.5
7.6
20.3
17.4
2.0
1.9
6.8
7.4
0.9
0.9
IT
HCL Tech^
Buy
860
1,132
120,913
42,038
47,503
23.5
23.5
56.4
62.9
15.3
13.7
3.5
2.7
23.2
19.8
2.5
2.0
Infosys
Accumulate
1,181
1,306
271,154
60,250
66,999
28.0
28.0
58.3
63.7
20.3
18.5
4.3
3.6
20.9
19.7
3.8
3.3
TCS
Buy
2,713
3,168
531,491
108,420
123,559
28.8
28.7
127.2
143.9
21.3
18.9
8.5
7.9
39.9
41.8
4.5
3.9
Tech Mahindra
Accumulate
570
646
54,807
25,566
28,890
16.0
17.0
26.3
31.9
21.7
17.9
3.9
3.3
17.9
18.6
1.9
1.6
Wipro
Buy
600
719
148,218
52,414
58,704
23.7
23.8
38.4
42.3
15.6
14.2
3.1
2.7
19.5
18.0
2.4
2.0
Media
D B Corp
Accumulate
324
356
5,944
2,241
2,495
27.8
27.9
21.8
25.6
14.9
12.6
3.9
3.4
26.7
28.5
2.6
2.3
HT Media
Neutral
83
-
1,931
2,495
2,603
11.2
11.2
7.3
8.6
11.4
9.7
0.9
0.8
7.4
8.1
0.3
0.3
Stock Watch
October 06, 2015
Company Name
Reco
CMP
Target
Mkt Cap
Sales ( Čcr )
OPM(%)
EPS (Č)
PER(x)
P/BV(x)
RoE(%)
EV/Sales(x)
(Č)
Price ( Č)
( Č cr )
FY16E FY17E
FY16E
FY17E
FY16E
FY17E
FY16E
FY17E
FY16E
FY17E
FY16E
FY17E
FY16E
FY17E
Media
Jagran Prakashan
Accumulate
144
156
4,701
1,939
2,122
26.0
26.0
8.3
9.2
17.3
15.6
3.0
2.7
17.5
17.1
2.4
2.2
Sun TV Network
Neutral
366
-
14,431
2,779
3,196
70.2
70.5
22.8
27.3
16.1
13.4
4.0
3.6
26.7
28.3
4.9
4.3
Hindustan Media
Buy
239
292
1,756
920
1,031
20.0
20.0
19.2
20.9
12.5
11.5
2.0
1.8
16.4
15.3
1.5
1.3
Ventures
Metals & Mining
Coal India
Buy
330
400
208,124
72,015
78,415
21.2
21.5
21.7
25.3
15.2
13.0
5.2
5.1
33.1
39.1
2.1
2.0
Hind. Zinc
Neutral
143
-
60,316
15,258
16,495
44.2
45.6
17.6
19.2
8.1
7.5
1.3
1.1
15.9
15.3
1.7
1.2
Hindalco
Neutral
74
-
15,291
104,356
111,186
8.7
9.5
6.7
11.1
11.0
6.7
0.4
0.4
3.5
5.9
0.7
0.6
JSW Steel
Neutral
910
-
21,985
48,125
53,595
18.8
21.0
46.9
97.5
19.4
9.3
0.9
0.9
4.4
9.5
1.3
1.1
NMDC
Neutral
95
-
37,823
8,237
10,893
46.6
44.5
10.0
11.7
9.6
8.2
1.1
0.9
12.5
13.0
4.4
3.3
SAIL
Neutral
52
-
21,476
45,915
53,954
7.2
10.5
1.5
4.4
34.5
11.9
0.5
0.5
2.3
4.1
1.1
1.0
Vedanta
Neutral
85
-
25,066
71,445
81,910
26.2
26.3
12.9
19.2
6.6
4.4
0.5
0.4
7.2
8.9
0.8
0.6
Tata Steel
Neutral
225
-
21,804
136,805
149,228
11.3
11.9
26.4
36.8
8.5
6.1
0.7
0.6
6.0
8.0
0.7
0.6
Oil & Gas
Cairn India
Neutral
155
-
29,079
11,323
12,490
49.4
51.0
20.7
20.7
7.5
7.5
0.5
0.5
6.4
6.1
1.6
1.0
GAIL
Neutral
299
-
37,864
64,856
70,933
9.1
9.6
24.0
28.9
12.5
10.3
1.1
1.0
8.8
9.6
0.8
0.7
ONGC
Neutral
240
-
205,503
154,564
167,321
36.8
37.4
28.6
32.5
8.4
7.4
1.1
1.0
12.7
13.5
1.5
1.4
Petronet LNG
Buy
178
210
13,365
39,007
40,785
3.8
4.2
9.2
11.0
19.5
16.3
2.2
2.0
11.6
12.7
0.4
0.4
Indian Oil Corp
Accumulate
402
455
97,640
359,607
402,760
5.9
6.1
42.5
48.7
9.5
8.3
1.3
1.1
14.1
14.4
0.4
0.3
Reliance Industries
Neutral
886
-
287,006
313,085
362,904
13.1
13.8
78.4
92.9
11.3
9.5
1.2
1.1
10.8
11.6
1.4
1.2
Pharmaceuticals
Alembic Pharma
Neutral
711
-
13,408
2,601
3,115
21.2
20.2
20.8
23.9
34.2
29.8
11.0
8.3
37.2
31.8
5.2
4.3
Aurobindo Pharma
Accumulate
766
872
44,708
14,923
17,162
23.0
23.0
38.2
43.6
20.0
17.6
6.2
4.7
36.0
30.2
3.3
2.8
Aventis*
Neutral
4,070
-
9,372
2,156
2,455
15.1
16.8
109.7
133.9
37.1
30.4
5.1
4.2
18.4
22.5
4.0
3.4
Cadila Healthcare
Neutral
2,080
-
42,594
10,224
11,840
20.0
21.0
71.0
85.6
29.3
24.3
7.9
6.2
30.1
28.5
4.2
3.6
Cipla
Neutral
642
-
51,555
14,359
16,884
21.3
19.7
28.4
30.5
22.6
21.1
4.0
3.4
19.3
17.5
3.6
3.0
Dr Reddy's
Neutral
4,182
-
71,313
18,213
21,214
22.6
22.7
163.0
192.5
25.7
21.7
5.3
4.4
22.5
20.0
3.9
3.3
Dishman Pharma
Neutral
372
-
3,004
1,716
1,888
20.2
20.2
16.3
21.6
22.8
17.2
2.1
1.9
9.7
11.7
1.9
1.6
GSK Pharma*
Neutral
3,347
-
28,346
2,870
3,158
20.0
22.1
59.5
68.3
56.2
49.0
16.6
17.1
28.5
34.3
9.4
8.6
Indoco Remedies
Neutral
314
-
2,896
1,088
1,262
18.2
18.2
13.1
15.5
24.0
20.3
4.7
3.9
21.2
21.1
2.7
2.4
Ipca labs
Accumulate
731
800
9,226
3,507
4,078
17.6
18.6
25.8
32.0
28.3
22.9
3.7
3.2
13.8
14.9
2.9
2.5
Lupin
Neutral
2,083
-
93,757
14,864
17,244
26.9
26.9
62.1
71.1
33.5
29.3
8.1
6.5
27.4
24.6
6.0
5.1
Sun Pharma
Accumulate
898
950
216,146
28,163
32,610
25.8
30.7
17.4
26.9
51.6
33.4
4.9
4.2
13.0
16.6
7.1
6.0
Stock Watch
October 06, 2015
Company Name
Reco
CMP
Target
Mkt Cap
Sales ( Čcr )
OPM(%)
EPS (Č)
PER(x)
P/BV(x)
RoE(%)
EV/Sales(x)
(Č)
Price ( Č)
( Č cr )
FY16E FY17E
FY16E
FY17E
FY16E
FY17E
FY16E
FY17E
FY16E
FY17E
FY16E
FY17E
FY16E
FY17E
Power
Tata Power
Neutral
67
-
18,175
35,923
37,402
22.6
22.8
4.1
5.2
16.6
13.1
1.3
1.2
7.5
9.3
1.5
1.3
NTPC
Buy
127
157
105,047
87,064
98,846
23.5
23.5
11.7
13.2
10.9
9.7
1.2
1.1
11.4
12.1
2.2
2.0
Power Grid
Buy
132
170
69,188
20,702
23,361
86.7
86.4
12.1
13.2
11.0
10.0
1.6
1.4
15.6
15.1
8.3
7.7
Telecom
Bharti Airtel
Neutral
347
-
138,710
101,748
109,191
32.1
31.7
12.0
12.5
28.9
27.8
2.0
1.9
6.9
6.7
2.0
1.8
Idea Cellular
Neutral
154
-
55,362
34,282
36,941
32.0
31.5
5.9
6.2
26.1
24.8
2.4
2.2
9.9
9.3
2.2
2.1
zOthers
Abbott India
Neutral
5,775
-
12,271
2,715
3,153
14.5
14.1
134.3
152.2
43.0
37.9
10.7
8.8
27.4
25.6
4.2
3.6
Bajaj Electricals
Buy
249
341
2,510
4,719
5,287
5.2
5.8
8.6
12.7
29.1
19.7
3.3
2.9
11.4
14.8
0.5
0.5
Finolex Cables
Neutral
236
-
3,606
2,728
3,036
10.8
11.0
14.4
16.8
16.4
14.1
2.5
2.2
15.2
15.3
1.1
0.9
Goodyear India*
Accumulate
572
655
1,318
1,953
1,766
12.4
12.0
67.4
59.6
8.5
9.6
2.1
1.8
27.7
20.2
0.5
0.4
Hitachi
Neutral
1,501
-
4,082
1,806
2,112
9.0
9.2
28.6
29.1
52.5
51.6
13.1
10.5
28.1
22.6
2.3
2.0
Jyothy Laboratories
Neutral
312
-
5,643
1,620
1,847
11.5
11.5
7.3
8.5
42.7
36.8
5.5
5.1
13.3
14.4
3.4
2.9
MRF
Neutral
42,869
-
18,181
20,727
14,841
19.3
18.6
4,905.8
3,351.9
8.7
12.8
2.8
2.3
37.6
19.6
0.8
1.1
Page Industries
Neutral
13,539
-
15,101
1,929
2,450
19.8
20.1
229.9
299.0
58.9
45.3
26.0
18.1
52.1
47.1
7.9
6.2
Relaxo Footwears
Neutral
533
-
6,399
1,767
2,152
12.3
12.5
19.3
25.1
27.7
21.3
6.8
5.2
27.7
27.8
3.7
3.0
Siyaram Silk Mills
Buy
979
1,221
917
1,653
1,873
11.7
12.2
99.3
122.1
9.9
8.0
1.8
1.5
19.5
20.2
0.7
0.6
Styrolution ABS India*
Neutral
776
-
1,365
1,271
1,440
8.6
9.2
32.0
41.1
24.2
18.9
2.5
2.2
10.7
12.4
1.0
0.9
Tree House
Buy
309
449
1,308
259
324
56.8
56.8
17.0
21.7
18.2
14.3
1.8
1.6
10.1
11.5
5.0
4.1
TVS Srichakra
Buy
2,590
3,210
1,983
2,127
2,388
15.2
14.9
237.7
267.5
10.9
9.7
4.6
3.3
51.7
39.8
1.0
0.8
HSIL
Accumulate
269
302
1,948
2,182
2,404
16.3
16.5
15.8
18.9
17.1
14.3
1.4
1.3
8.4
9.4
1.2
1.1
Kirloskar Engines India
Accumulate
277
297
4,007
2,634
3,252
10.1
12.0
10.9
17.4
25.4
15.9
2.8
2.5
11.4
16.8
1.2
0.9
Ltd
M M Forgings
Buy
546
797
660
563
671
22.1
22.9
51.0
66.5
10.7
8.2
2.2
1.8
23.1
24.1
1.3
1.1
Banco Products (India)
Neutral
125
-
892
1,208
1,353
11.0
12.3
10.8
14.5
11.6
8.6
1.3
1.2
11.9
14.5
0.7
0.6
Competent Automobiles Neutral
140
-
86
1,007
1,114
3.1
3.1
23.7
28.2
5.9
5.0
0.8
0.7
13.9
14.6
0.1
0.1
Nilkamal
Neutral
1,001
-
1,494
1,948
2,147
10.6
10.3
60.0
67.0
16.7
14.9
2.6
2.2
16.8
16.1
0.8
0.7
Visaka Industries
Buy
138
166
219
1,158
1,272
8.6
9.5
23.7
32.7
5.8
4.2
0.6
0.5
10.1
12.5
0.4
0.3
Transport Corporation of
Buy
246
293
1,871
2,830
3,350
8.8
9.0
14.4
18.3
17.1
13.4
2.6
2.3
15.4
17.1
0.8
0.7
India
Elecon Engineering
Buy
73
87
799
1,452
1,596
14.0
14.7
4.4
6.2
16.6
11.8
1.4
1.3
8.6
11.2
0.9
0.7
Surya Roshni
Buy
132
183
578
2,992
3,223
8.3
8.5
14.7
18.3
9.0
7.2
0.8
0.8
9.8
11.0
0.5
0.4
MT Educare
Buy
131
169
523
286
366
18.3
17.7
7.7
9.4
17.0
14.0
3.6
3.1
20.2
21.1
1.7
1.3
Stock Watch
October 06, 2015
Company Name
Reco
CMP
Target Mkt Cap
Sales ( Čcr )
OPM(%)
EPS (Č)
PER(x)
P/BV(x)
RoE(%)
EV/Sales(x)
(Č)
Price ( Č)
( Č cr )
FY16E FY17E FY16E FY17E FY16E FY17E FY16E FY17E FY16E FY17E FY16E FY17E FY16E FY17E
zOthers
Radico Khaitan
Buy
86
112
1,150
1,565
1,687
11.9
12.4
5.4
6.6
16.0
13.1
1.3
1.2
8.0
9.0
1.2
1.2
Garware Wall Ropes
Accumulate
361
390
790
875
983
10.4
10.6
23.1
27.8
15.6
13.0
2.2
1.9
14.1
14.8
0.9
0.8
Wonderla Holidays
Accumulate
286
322
1,615
206
308
44.0
43.6
9.0
12.9
31.8
22.2
4.3
3.9
13.7
17.8
7.7
5.1
Linc Pen & Plastics
Buy
154
185
227
340
371
8.3
8.9
10.8
13.2
14.2
11.6
2.3
2.0
16.0
17.1
0.7
0.6
The Byke Hospitality
Accumulate
166
181
664
222
287
20.5
20.5
5.6
7.6
29.4
21.9
5.5
4.6
18.9
20.8
3.0
2.3
Source: Company, Angel Research; Note: *December year end; #September year end; &October year end; Price as on October 05, 2015
Market Outlook
October 06, 2015
Research Team Tel: 022 - 39357800
DISCLAIMER
Angel Broking Private Limited (hereinafter referred to as “Angel”) is a registered Member of National Stock Exchange of India Limited,
Bombay Stock Exchange Limited and Metropolitian Stock Exchange of India Limited. It is also registered as a Depository Participant with
CDSL and Portfolio Manager with SEBI. It also has registration with AMFI as a Mutual Fund Distributor. Angel Broking Private Limited is a
registered entity with SEBI for Research Analyst in terms of SEBI (Research Analyst) Regulations, 2014 vide registration number
INH000000164. Angel or its associates has not been debarred/ suspended by SEBI or any other regulatory authority for accessing
/dealing in securities Market. Angel or its associates including its relatives/analyst do not hold any financial interest/beneficial ownership
of more than 1% in the company covered by Analyst. Angel or its associates/analyst has not received any compensation / managed or co
-managed public offering of securities of the company covered by Analyst during the past twelve months. Angel/analyst has not served as
an officer, director or employee of company covered by Analyst and has not been engaged in market making activity of the company
covered by Analyst.
This document is solely for the personal information of the recipient, and must not be singularly used as the basis of any investment
decision. Nothing in this document should be construed as investment or financial advice. Each recipient of this document should make
such investigations as they deem necessary to arrive at an independent evaluation of an investment in the securities of the companies
referred to in this document (including the merits and risks involved), and should consult their own advisors to determine the merits and
risks of such an investment.
Reports based on technical and derivative analysis center on studying charts of a stock's price movement, outstanding positions and
trading volume, as opposed to focusing on a company's fundamentals and, as such, may not match with a report on a company's
fundamentals.
The information in this document has been printed on the basis of publicly available information, internal data and other reliable sources
believed to be true, but we do not represent that it is accurate or complete and it should not be relied on as such, as this document is for
general guidance only. Angel Broking Pvt. Limited or any of its affiliates/ group companies shall not be in any way responsible for any
loss or damage that may arise to any person from any inadvertent error in the information contained in this report. Angel Broking Pvt.
Limited has not independently verified all the information contained within this document. Accordingly, we cannot testify, nor make any
representation or warranty, express or implied, to the accuracy, contents or data contained within this document. While Angel Broking
Pvt. Limited endeavors to update on a reasonable basis the information discussed in this material, there may be regulatory, compliance,
or other reasons that prevent us from doing so.
This document is being supplied to you solely for your information, and its contents, information or data may not be reproduced,
redistributed or passed on, directly or indirectly.
Neither Angel Broking Pvt. Limited, nor its directors, employees or affiliates shall be liable for any loss or damage that may arise from or
in connection with the use of this information.
Note: Please refer to the important ‘Stock Holding Disclosure' report on the Angel website (Research Section). Also, please refer to the
latest update on respective stocks for the disclosure status in respect of those stocks. Angel Broking Pvt. Limited and its affiliates may have
investment positions in the stocks recommended in this report.