Market Outlook
August 6, 2015
Dealer’s Diary
Domestic Indices
Chg (%)
(Pts)
(Close)
BSE Sensex
0.5
151
28,223
Indian markets are expected to open negative tracking SGX Nifty.
Nifty
0.6
51
8,568
As per yesterday’s release pace of growth in the U.S. service sector surged in July to
MID CAP
0.8
87
11,544
decade high. This backs Fed president’s view that U.S. should see a possible rate
SMALL CAP
1.0
115
12,136
hike in September, unless economic data deteriorates. Dow Jones ended in red.
BSE HC
1.6
266
17,380
Walt Disney shares corrected over 9%, single largest decline in a day since 2008,
BSE PSU
(0.1)
(7)
7,832
after the company cut down its profit forecast.
BANKEX
(0.3)
(71)
21,744
London market gained nearly 1% on Wednesday, with mining shares among the top
AUTO
1.0
201
19,641
risers. Shares in miners rebounded as investors looked for bargains after recent fall
METAL
(0.0)
(3)
8,802
in the sector. Sentiment was also helped by upbeat economic data from China.
OIL & GAS
0.2
16
9,800
BSE IT
1.8
194
11,143
Markets rebounded smartly as bulls took cues from positive commentary by the RBI
Global Indices
Chg (%)
(Pts)
(Close)
governor, a day after the monetary policy review. Euphoria surrounding Cognizant’s
Dow Jones
(0.1)
(10)
17,540
quarterly results also supported rally across IT stocks.
NASDAQ
0.7
34
5,140
News & Result Analysis
FTSE
1.0
66
6,752
Result Review: TreeHouse
Nikkei
0.5
94
20,614
Refer detailed news & result analysis on the following page
Hang Sang
0.4
108
24,514
Markets Today
Straits Times
0.0
0
3,191
The trend deciding level for the day is 28,225 / 8,569 levels. If NIFTY trades above
Shanghai Com
(1.6)
(62)
3,695
this level during the first half-an-hour of trade then we may witness a further rally up
to 28,314 - 28,405 / 8,591 - 8,615 levels. However, if NIFTY trades below
Indian ADR
Chg (%)
(Pts)
(Close)
28,225 / 8,569 levels for the first half-an-hour of trade then it may correct towards
INFY
2.7
0.4
$17.4
28,134 - 28,045 / 8,545 - 8,523 levels.
WIT
3.4
0.4
$12.7
Indices
S2
S1
PIVOT
R1
R2
IBN
(0.3)
(0.0)
$10.3
SENSEX
28,045
28,134
28,225
28,314
28,405
HDB
0.2
0.1
$63.1
NIFTY
8,523
8,545
8,569
8,591
8,615
Advances / Declines
BSE
NSE
Net Inflows (August 4, 2015)
Advances
1,813
1,002
` cr
Purch
Sales
Net
MTD
YTD
Declines
1,160
535
FII
6,043
5,708
335
765
141,735
Unchanged
104
56
MFs
887
1,215
(328)
(409)
57,539
Volumes (` cr)
FII Derivatives (August 5, 2015)
BSE
4,501
` cr
Purch
Sales
Net
Open Interest
NSE
20,415
Index Futures
1,312
714
598
15,426
Stock Futures
2,934
2,706
228
50,426
Gainers / Losers
Gainer
Loser
Company
Price (`)
chg (%)
Company
Price (`)
chg (%)
SCI
77
10.7
KAILASH
5
(4.9)
SUZLON
27
10.5
RAYMOND
457
(3.9)
HCC
24
9.2
INFRATEL
464
(3.4)
ATUL
1,336
7.6
ESSAROIL
196
(3.2)
NESTLEIND
6,832
7.5
APOLLOTYRE
210
(3.1)
Market Outlook
August 6, 2015
Result Review
Tree House (CMP: `400/ TP: `433/ Upside: 8.3%)
Tree House Education & Accessories (THEAL) reported a good set of numbers for
1QFY2015. Its top-line increased by 28.1% on yoy basis to `69cr, led by addition
of 35 new pre-schools. This is marginally higher than our estimate of `66cr.
EBITDA grew by 32.9% yoy to `44cr and EBIDTA margin came in at 64.0%
expanding by 230bp yoy. Depreciation increased by 61.1% yoy and came in at
`10cr while interest expense increased by 15.3% yoy and came in at `4cr. There
was an exceptional item during the quarter for an amount of `3cr which was
recognized as an income in prior years. This was written off during the current
quarter. Adjusting for this, the net profit grew by 25.7% yoy to `20cr which is the
same as our estimate.
At current market price, the stock is trading at 18.5x its FY2107E earnings. We
maintain our Accumulate recommendation and target price of `433 on the stock
based on target multiple of 20.0x for FY2017E.
Y/E
Sales
OPM PAT
EPS
ROE P/E P/BV EV/EBITDA
EV/Sales
March
(` cr)
(%)
(` cr)
(`)
(%) (x)
(x)
(x)
(x)
FY2016E
259
56.8
72
17.0
10.1 23.5 2.4
11.4
6.5
FY2017E
324
56.8
92
21.7
11.6 18.5 2.1
9.4
5.3
Quarterly Bloomberg Brokers Consensus Estimate
Tata Global Beverages Ltd (Consol)- August 06, 2015
Particulars (` cr)
1QFY16E
1QFY15
y-o-y (%)
4QFY15
q-o-q (%)
Net sales
1,987
1,884
5.4
1,875
6.0
EBITDA
205
201
2.0
188
9.0
EBITDA margin (%)
10.3
10.7
10.0
Net profit
104
97
6.4
4
2,553.8
Economic and Political News
Union Cabinet gives its nod to decentralize shipment of govt cargo
Services PMI returns to modest growth in July
Sugar crisis: Centre considers export incentive, barter
Corporate News
Australian court rejects green nod to $16bn Adani project
Bata India to focus on e-commerce
Tata Power to pursue expansion of Mundra UMPP
STAR exits Balaji, sells 26% stake for `108cr
Market Outlook
August 6, 2015
Top Picks
Large Cap
Market Cap
CMP
Target
Upside
Company
Sector
Rating
(` Cr)
(`)
(`)
(%)
Axis Bank
Financials
137,652
Buy
579
716
23.6
ICICI Bank
Financials
180,587
Buy
311
370
18.9
Infosys
IT
249,575
Buy
1,087
1,306
20.2
Inox Wind
Cap Goods
9,224
Buy
416
505
21.5
LIC Housing Fin. Financials
25,541
Buy
506
590
16.6
Power Grid
Power
73,556
Buy
141
170
20.9
TCS
IT
497,840
Buy
2,542
3,168
24.7
Tech Mahindra
IT
52,909
Buy
550
646
17.4
Yes Bank
Financials
34,724
Buy
831
989
19.1
Sun Pharma
Pharma
202,411
Accumulate
841
950
12.9
Source: Angel Research, Bloomberg
Mid Cap
Market Cap
CMP
Target
Upside
Company
Sector
Rating
(` Cr)
(`)
(`)
(%)
Bajaj Electricals
Others
2,633
Buy
261
341
30.6
Garware Wall Rope
Others
652
Buy
298
390
31.0
Hindustan Media Ven.
Media
1,786
Buy
243
292
20.2
MBL Infrastructures
Construction
1,111
Buy
268
395
47.3
Mangalam Cements
Cement
663
Buy
248
349
40.7
Radico Khaitan
Others
1,251
Buy
94
112
19.1
MT Educare
Others
481
Buy
121
141
16.5
Minda Industries
Auto Ancillary
933
Accumulate
588
652
10.8
Setco Automotive
Auto Ancillary
687
Accumulate
257
286
11.3
Source: Angel Research, Bloomberg
Market Outlook
August 06, 2015
Result Calendar
Date
Company
August 6, 2015
Tata Global, Motherson Sumi, Cummins India, Bajaj Electrical, Styrolution, Banco
Tata Motors, M&M, BHEL, Mangalam Cement, Rural Elec.Corp., Corporation Bank, GSPL, Kirloskar Engines India Ltd,
August 7, 2015
MT Educare
August 8, 2015
Central Bank, UCO Bank, Divi's Lab.
August 9, 2015
August 10, 2015
LMW, J & K Bank, Finolex Cables, Power Grid Corpn, Adani Power, HDIL, Radico Khaitan
Bosch India, Apollo Tyres, J K Lakshmi Cements, St Bk of India, NMDC, Tata Steel, Prakash Industries, HPCL, Siyaram
August 11, 2015
Silk Mills, Sun Pharma, Reliance Power
Ashok Leyland, India Cements, IDBI Bank, Coal India, Jindal Steel, Nalco, Bhushan Steel, TVS Srichakra, Cadila
August 12, 2015
Healthcare, Aurobindo Pharma, Anant Raj
August 13, 2015
IOC, Page Industries, Surya Roshni, Tata Power Co., Unitech
August 14, 2015
Amara Raja Batteries, SAIL, Hindalco, BPCL, Elecon Engineering, GIPCL
Source: Bloomberg, Angel Research
Global economic events release calendar
Date
Time
Country Event Description
Unit
Period
Bloomberg Data
Last Reported Estimated
August 6, 2015
6:00PM US
Initial Jobless claims
Thousands
Aug 1
267.00
53.70
4:30PM UK
BOE Announces rates
% Ratio
Aug 6
0.50
272.50
2:00PM UK
Industrial Production (YoY)
% Change
Jun
2.10
0.50
August 7, 2015
6:00PM US
Change in Nonfarm payrolls
Thousands
Jul
223.00
2.20
6:00PM US
Unnemployment rate
%
Jul
5.30
225.00
August 8, 2015
China
Exports YoY%
% Change
Jul
2.80
5.30
August 9, 2015
7:00AM China Consumer Price Index (YoY)
% Change
Jul
1.40
(1.40)
August 10, 2015
India
Imports YoY%
% Change
Jul
(13.40)
1.60
India
Exports YoY%
% Change
Jul
(15.80)
--
August 12, 2015
2:00PM UK
Jobless claims change
% Change
Jul
7.00
--
11:00AM China Industrial Production (YoY)
% Change
Jul
6.80
--
5:30PM India
Industrial Production YoY
% Change
Jun
2.70
6.60
August 14, 2015
2:30PM Euro Zone Euro-Zone CPI (YoY)
%
Jul F
0.20
--
6:45PM US
Industrial Production
%
Jul
0.23
--
12:00PM India
Monthly Wholesale Prices YoY%
% Change
Jul
(2.40)
0.25
2:30PM Euro Zone Euro-Zone GDP s.a. (QoQ)
% Change
2Q A
0.40
--
11:30AM Germany GDP nsa (YoY)
% Change
2Q P
1.10
--
Source: Bloomberg, Angel Research
Market Outlook
August 06, 2015
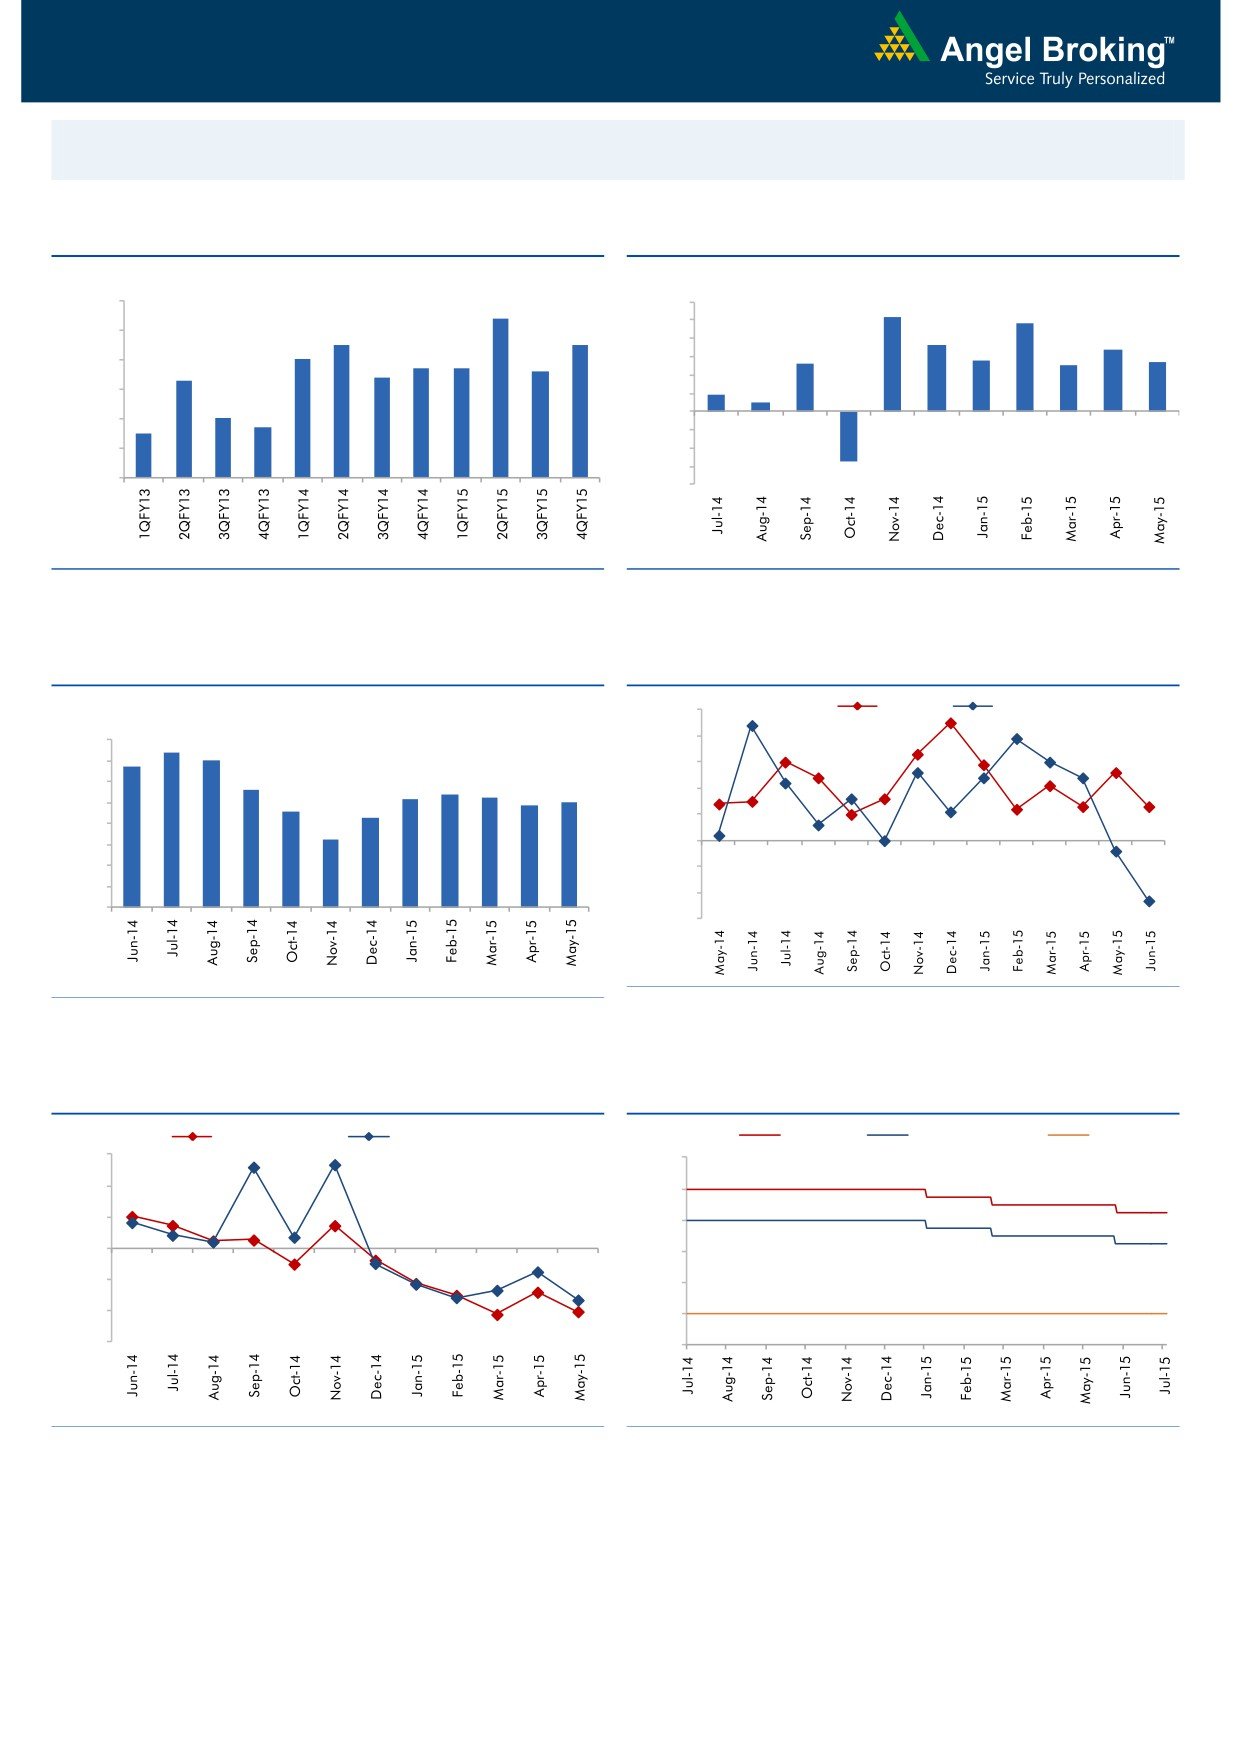
Macro watch
Exhibit 1: Quarterly GDP trends
Exhibit 2: IIP trends
(%)
(%)
9.0
8.4
6.0
5.2
4.8
5.0
8.0
7.5
7.5
3.6
3.4
7.0
4.0
2.8
2.7
6.7
6.7
2.6
2.5
6.6
3.0
7.0
6.3
6.4
2.0
0.9
6.0
0.5
1.0
5.0
4.7
-
5.0
4.5
(1.0)
4.0
(2.0)
(3.0)
3.0
(2.7)
(4.0)
Source: CSO, Angel Research
Source: MOSPI, Angel Research
Exhibit 3: Monthly CPI inflation trends
Exhibit 4: Manufacturing and services PMI
(%)
55.0
Mfg. PMI
Services PMI
8.0
7.4
54.0
6.8
7.0
7.0
53.0
5.6
5.4
6.0
5.2
5.3
4.9
5.0
52.0
4.6
5.0
4.3
51.0
4.0
3.3
50.0
3.0
2.0
49.0
1.0
48.0
-
47.0
Source: Market, Angel Research; Note: Level above 50 indicates expansion
Source: MOSPI, Angel Research
Exhibit 5: Exports and imports growth trends
Exhibit 6: Key policy rates
(%)
Exports yoy growth
Imports yoy growth
(%)
Repo rate
Reverse Repo rate
CRR
30.0
9.00
20.0
8.00
10.0
7.00
0.0
6.00
(10.0)
5.00
(20.0)
4.00
(30.0)
3.00
Source: Bloomberg, Angel Research
Source: RBI, Angel Research
Market Outlook
August 06, 2015
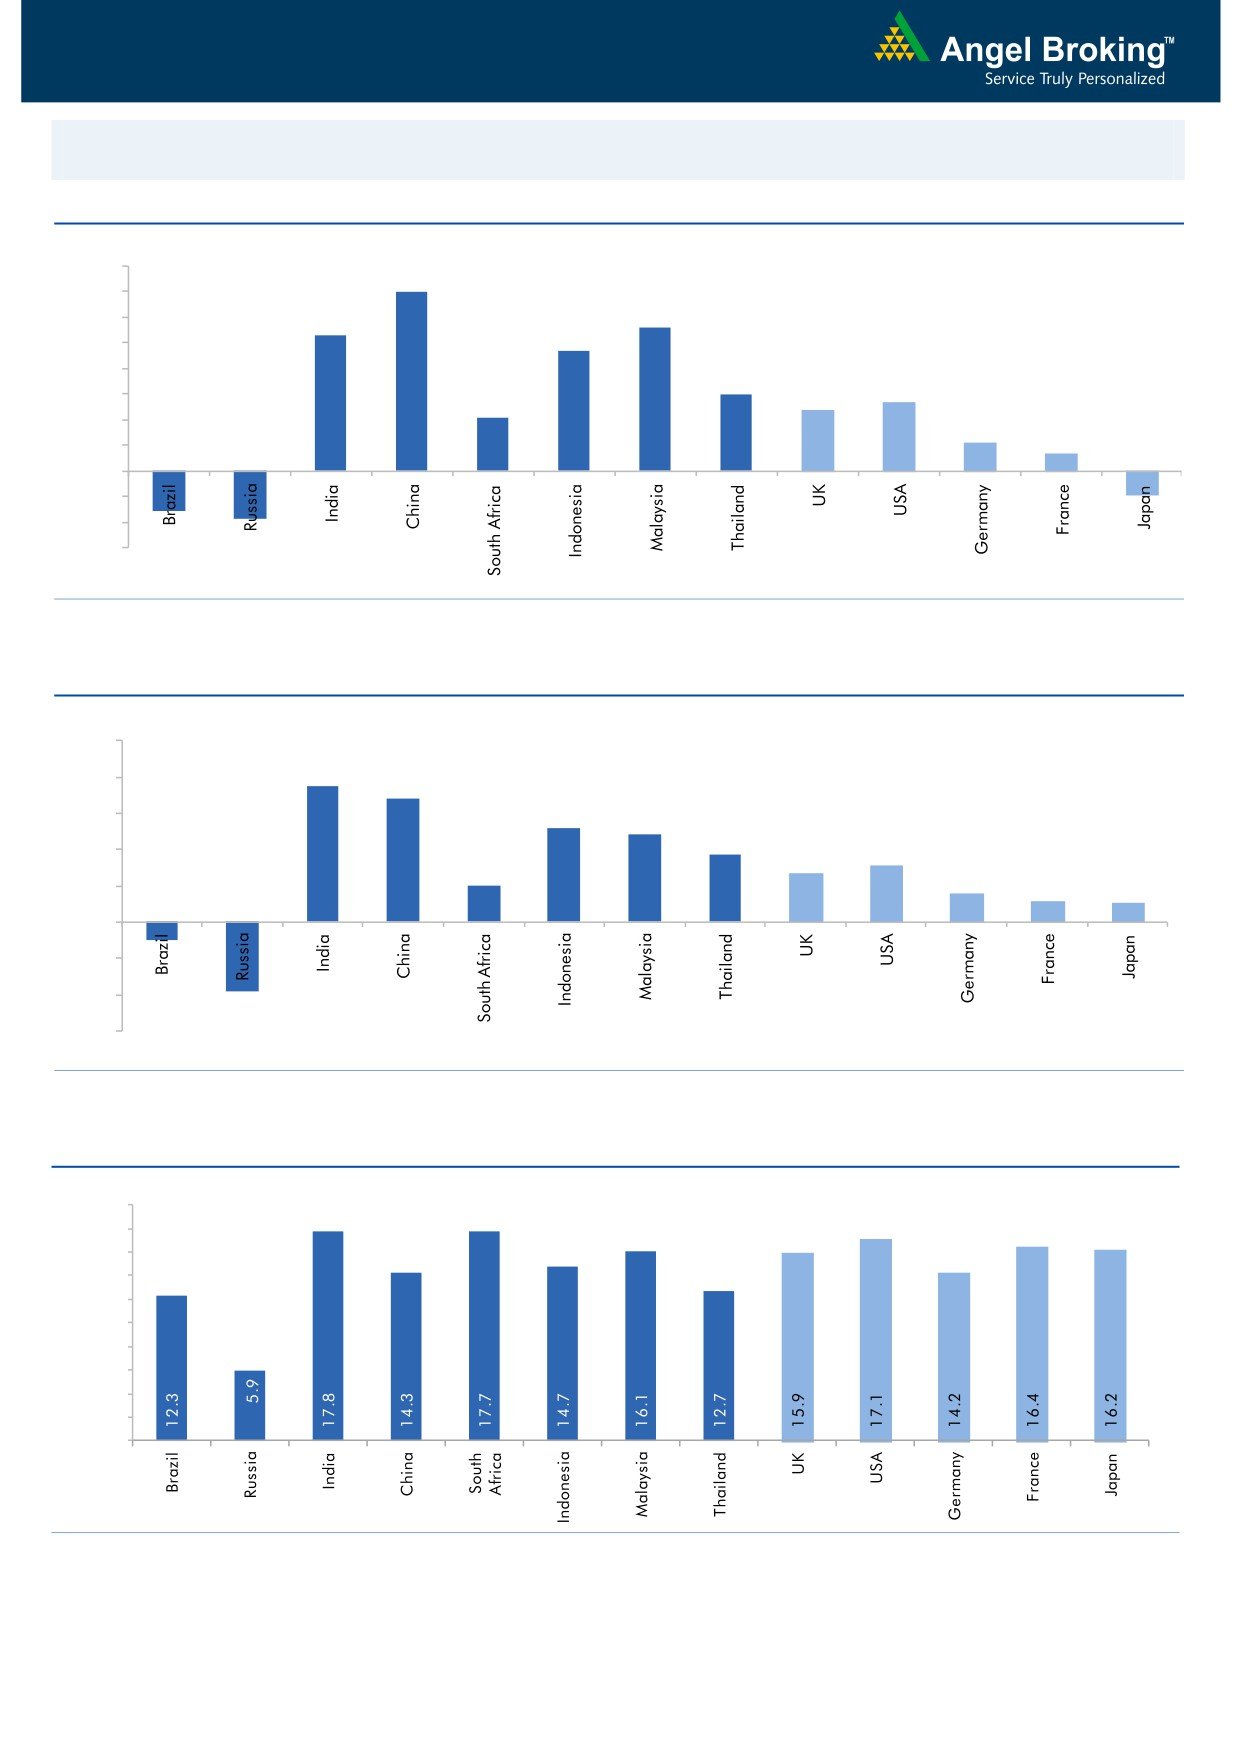
Global watch
Exhibit 1: Latest quarterly GDP Growth (%, yoy) across select developing and developed countries
(%)
8.0
7.0
7.0
5.6
6.0
5.3
4.7
5.0
4.0
3.0
2.7
3.0
2.4
2.1
2.0
1.1
0.7
1.0
(1.6)
(1.9)
(0.9)
-
(1.0)
(2.0)
(3.0)
Source: Bloomberg, Angel Research
Exhibit 2: 2015 GDP Growth projection by IMF (%, yoy) across select developing and developed countries
(%)
10.0
7.5
8.0
6.8
6.0
5.2
4.8
3.7
4.0
3.1
2.7
2.0
1.6
2.0
1.2
1.0
(1.0)
(3.8)
-
(2.0)
(4.0)
(6.0)
Source: IMF, Angel Research
Exhibit 3: One year forward P-E ratio across select developing and developed countries
(x)
20.0
18.0
16.0
14.0
12.0
10.0
8.0
6.0
4.0
2.0
-
Source: Bloomberg, Angel Research
Market Outlook
August 06, 2015
Exhibit 4: Relative performance of indices across globe
Returns (%)
Country
Name of index
Closing price
1M
3M
1YR
Brazil
Bovespa
50,287
(4.3)
(13.4)
(10.0)
Russia
Micex
1,693
4.4
(1.7)
22.8
India
Nifty
8,568
0.5
6.3
10.0
China
Shanghai Composite
3,695
(1.8)
(11.0)
67.7
South Africa
Top 40
47,259
3.3
(0.9)
2.5
Mexico
Mexbol
44,938
0.3
0.4
1.0
Indonesia
LQ45
828
(0.9)
(5.4)
(4.4)
Malaysia
KLCI
1,726
(0.1)
(5.0)
(8.0)
Thailand
SET 50
944
(3.6)
(5.9)
(8.7)
USA
Dow Jones
17,540
(0.8)
(2.2)
6.7
UK
FTSE
6,752
3.3
(2.6)
2.4
Japan
Nikkei
20,614
3.2
7.6
32.9
Germany
DAX
11,636
6.8
2.5
26.6
France
CAC
5,197
10.3
4.6
23.8
Source: Bloomberg, Angel Research
Market Outlook
August 06, 2015
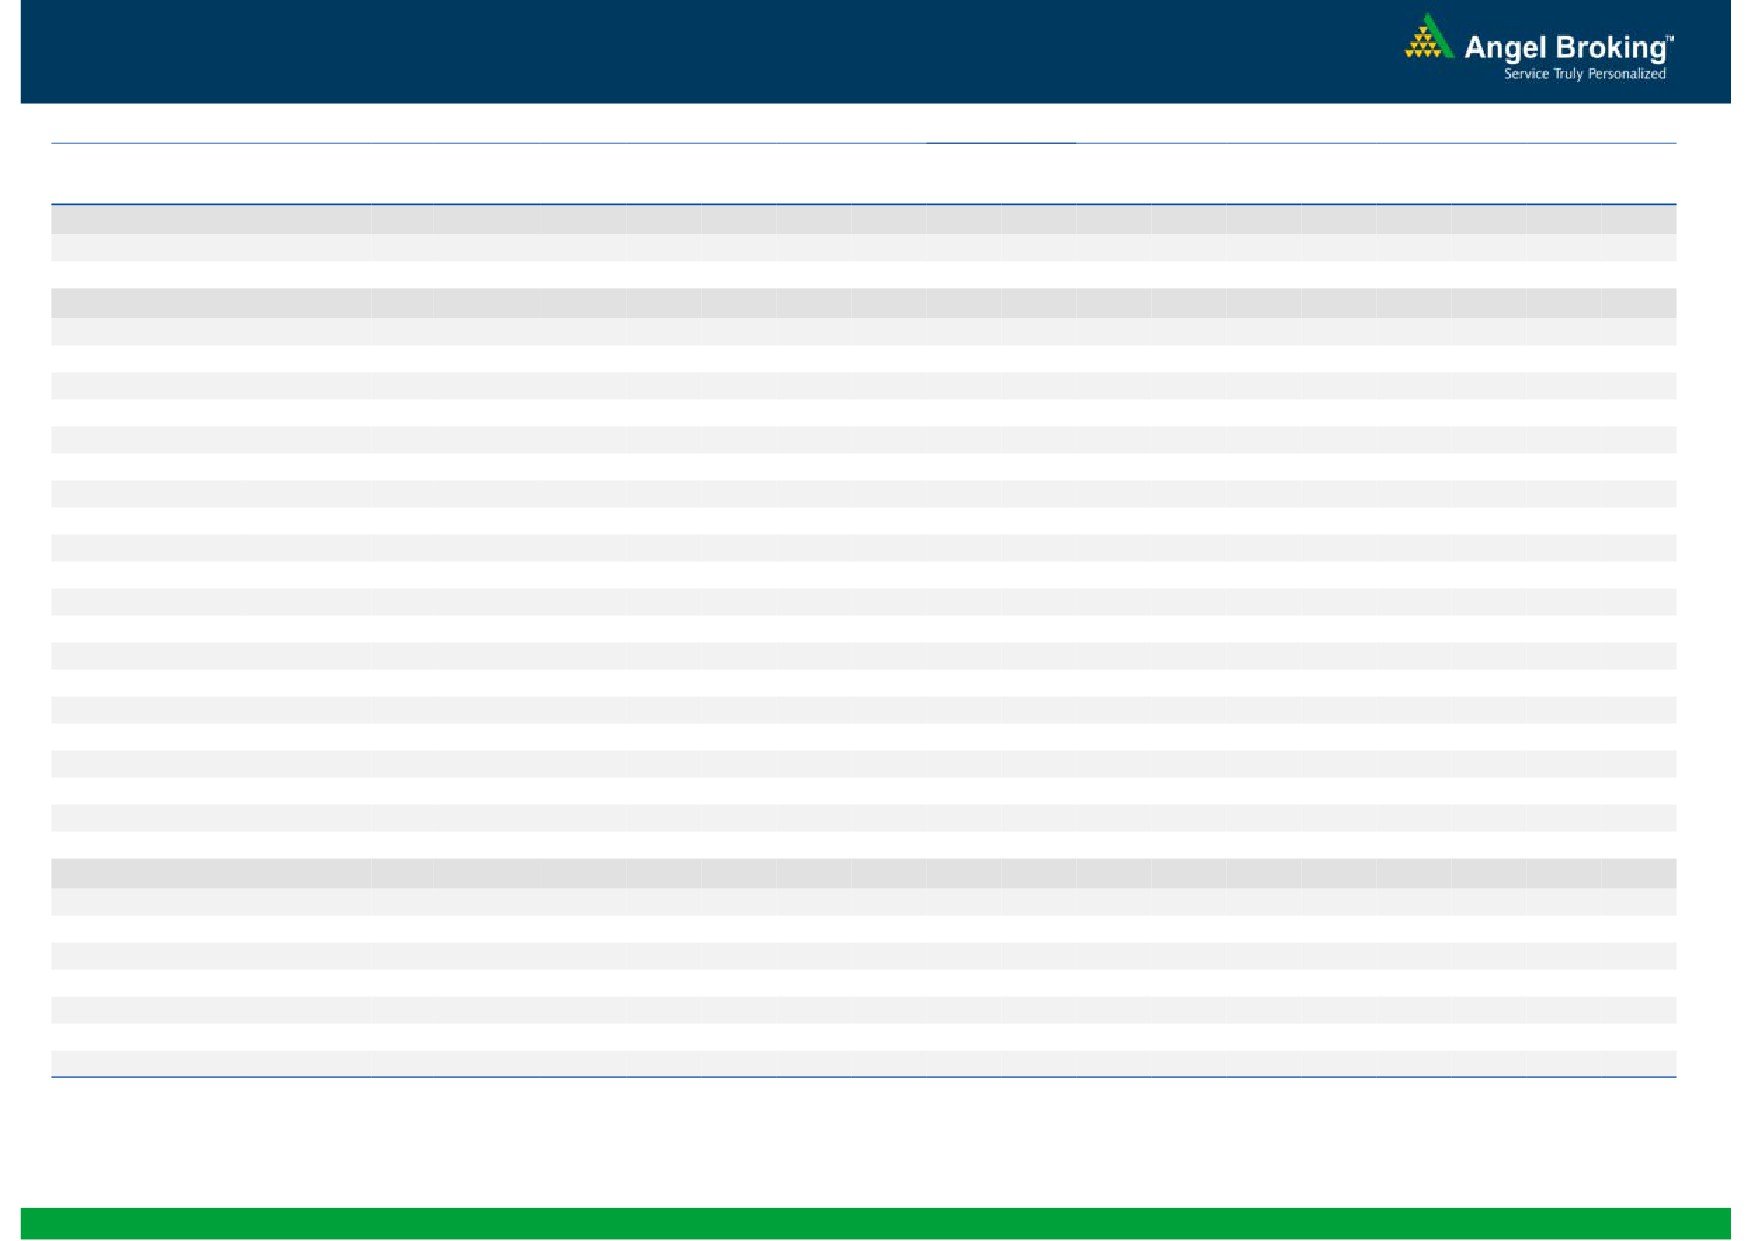
Stock Watch
Company Name
Reco
CMP
Target
Mkt Cap
Sales ( Čcr )
OPM(%)
EPS (Č)
PER(x)
P/BV(x)
RoE(%)
EV/Sales(x)
(Č)
Price ( Č)
( Č cr )
FY16E FY17E
FY16E
FY17E
FY16E
FY17E
FY16E
FY17E
FY16E
FY17E
FY16E
FY17E
FY16E
FY17E
Agri / Agri Chemical
Rallis
Neutral
230
-
4,464
2,075
2,394
14.4
14.4
9.5
11.0
24.2
20.9
4.8
4.2
21.1
21.3
2.2
1.9
United Phosphorus
Neutral
566
-
24,240
13,698
15,752
17.6
17.6
32.1
38.5
17.6
14.7
3.5
2.9
21.4
21.3
1.9
1.6
Auto & Auto Ancillary
Ashok Leyland
Neutral
87
-
24,859
17,394
20,318
9.6
10.7
2.8
4.4
31.2
19.9
4.4
4.1
14.3
20.4
1.4
1.2
Bajaj Auto
Neutral
2,570
-
74,359
23,842
27,264
19.8
19.6
128.4
144.4
20.0
17.8
6.1
5.3
30.5
29.5
2.7
2.3
Eicher Motors
Accumulate
20,567
21,843
55,823
11,681
15,550
15.3
16.9
358.5
564.3
57.4
36.5
17.2
12.8
29.8
34.9
4.7
3.5
Hero Motocorp
Neutral
2,660
-
53,125
28,500
33,028
13.8
14.1
144.2
166.3
18.5
16.0
6.8
5.8
36.7
36.0
1.7
1.4
L G Balakrishnan & Bros Neutral
467
-
734
1,254
1,394
11.6
11.8
35.9
41.7
13.0
11.2
1.8
1.6
13.5
13.8
0.7
0.6
Mahindra and Mahindra Neutral
1,383
-
85,925
41,078
46,473
11.5
12.0
51.4
62.7
26.9
22.1
4.0
3.5
14.7
15.9
1.8
1.6
Maruti
Accumulate
4,471
4,735
135,051
58,102
68,587
16.7
16.9
182.0
225.5
24.6
19.8
4.9
4.2
19.9
21.0
2.1
1.7
Minda Industries
Accumulate
588
652
933
2,500
2,889
7.6
8.3
39.4
54.3
14.9
10.8
2.1
1.8
14.1
16.3
0.5
0.4
Rane Brake Lining
Accumulate
329
366
261
454
511
11.1
11.4
23.8
28.1
13.8
11.7
2.0
1.8
14.2
15.3
0.7
0.6
Setco Automotive
Accumulate
257
286
687
718
862
13.3
14.3
13.4
19.0
19.2
13.5
3.0
2.5
15.4
18.5
1.2
1.1
Tata Motors
Accumulate
377
425
108,775
258,457
276,275
13.3
13.7
29.3
35.2
12.9
10.7
1.4
1.3
11.4
12.2
0.6
0.6
TVS Motor
Accumulate
235
255
11,148
11,839
13,985
7.0
8.0
10.8
15.9
21.7
14.8
5.6
4.4
25.5
29.7
0.9
0.7
Amara Raja Batteries
Neutral
978
-
16,706
5,355
6,641
17.4
17.8
31.8
40.9
30.8
23.9
7.7
6.1
25.2
25.5
3.1
2.4
Exide Industries
Neutral
154
-
13,124
7,363
8,247
13.7
14.5
6.6
7.7
23.4
20.1
3.0
2.7
12.6
13.3
1.5
1.4
Apollo Tyres
Neutral
210
-
10,702
12,866
13,892
15.7
15.4
20.1
19.9
10.5
10.6
1.7
1.4
15.8
13.6
0.9
0.9
Ceat
Neutral
998
-
4,035
6,041
6,770
14.3
13.6
101.5
114.5
9.8
8.7
2.0
1.6
20.0
18.8
0.8
0.7
JK Tyres
Accumulate
120
127
2,712
7,774
8,456
13.3
12.9
17.3
18.1
6.9
6.6
1.6
1.3
22.8
19.7
0.7
0.7
Swaraj Engines
Neutral
988
-
1,228
593
677
14.5
14.8
51.2
60.8
19.3
16.3
4.5
4.0
23.3
24.8
1.9
1.6
Subros
Neutral
97
-
584
1,268
1,488
11.6
11.9
3.7
6.6
26.3
14.7
1.8
1.6
6.8
11.4
0.8
0.6
Indag Rubber
Buy
199
247
523
283
329
17.0
17.2
13.0
15.4
15.4
12.9
3.4
2.8
21.8
21.6
1.6
1.3
Capital Goods
ACE
Neutral
54
-
537
660
839
4.7
8.2
1.0
3.9
54.3
13.9
1.7
1.5
3.2
11.3
1.0
0.8
BEML
Neutral
1,545
-
6,435
3,277
4,006
6.0
8.9
29.2
64.3
52.9
24.0
3.0
2.7
5.7
11.7
2.1
1.6
BGR Energy
Neutral
142
-
1,023
3,615
3,181
9.5
9.4
16.7
12.4
8.5
11.4
0.8
0.8
10.0
7.0
0.7
0.9
BHEL
Neutral
280
-
68,631
33,722
35,272
10.8
11.7
10.5
14.2
26.7
19.8
2.0
1.9
7.0
9.0
2.1
2.0
Blue Star
Neutral
374
-
3,365
3,649
4,209
5.0
5.9
9.2
14.7
40.9
25.4
7.4
7.0
9.1
17.5
1.0
0.9
Crompton Greaves
Accumulate
190
204
11,930
13,484
14,687
4.9
6.2
4.5
7.1
42.3
26.8
3.0
2.8
7.2
10.8
1.0
0.9
Inox Wind
Buy
416
505
9,224
4,980
5,943
17.0
17.5
26.6
31.6
15.6
13.2
4.7
3.4
35.0
30.0
2.0
1.6
Market Outlook
August 06, 2015
Stock Watch
Company Name
Reco
CMP
Target
Mkt Cap
Sales ( Čcr )
OPM(%)
EPS (Č)
PER(x)
P/BV(x)
RoE(%)
EV/Sales(x)
(Č)
Price ( Č)
( Č cr )
FY16E
FY17E
FY16E
FY17E
FY16E
FY17E
FY16E
FY17E
FY16E
FY17E
FY16E
FY17E
FY16E
FY17E
Capital Goods
KEC International
Neutral
150
-
3,852
8,791
9,716
6.1
6.8
5.4
8.2
27.8
18.3
2.8
2.5
10.0
14.0
0.7
0.6
Thermax
Neutral
1,033
-
12,309
6,413
7,525
7.4
8.5
30.5
39.3
33.9
26.3
5.2
4.5
15.0
17.0
1.9
1.6
Cement
ACC
Accumulate
1,381
1,548
25,926
11,856
14,092
14.5
17.8
47.6
76.2
29.0
18.1
3.0
2.7
10.6
15.7
2.0
1.7
Ambuja Cements
Neutral
230
-
35,701
10,930
12,022
20.7
22.2
8.7
10.7
26.4
21.5
3.4
3.2
13.0
15.2
2.8
2.6
India Cements
Buy
92
132
2,835
4,716
5,133
14.9
15.8
1.0
4.5
92.3
20.5
0.9
0.9
1.0
4.5
0.9
0.8
JK Cement
Buy
676
778
4,724
4,061
4,748
16.2
17.7
24.5
42.9
27.6
15.8
2.7
2.4
10.0
15.9
1.6
1.3
J K Lakshmi Cement
Buy
366
443
4,301
3,004
3,618
17.6
19.9
13.9
27.2
26.3
13.4
3.0
2.6
11.8
20.5
1.8
1.5
Mangalam Cements
Buy
248
349
663
1,111
1,336
12.2
15.1
16.3
34.6
15.2
7.2
1.2
1.1
8.2
16.0
0.9
0.7
Orient Cement
Neutral
179
-
3,672
2,039
2,573
22.7
24.5
9.3
13.3
19.3
13.5
3.3
2.8
18.3
22.6
2.4
1.8
Ramco Cements
Neutral
361
-
8,591
4,036
4,545
20.8
21.3
15.1
18.8
23.9
19.2
2.9
2.6
12.9
14.3
2.6
2.3
Shree Cement^
Neutral
11,641
-
40,553
7,150
8,742
26.7
28.6
228.0
345.5
51.1
33.7
7.5
6.3
15.7
20.3
5.4
4.4
UltraTech Cement
Neutral
3,211
-
88,124
27,562
31,548
20.3
22.0
111.0
145.0
28.9
22.2
4.1
3.5
15.1
17.0
3.3
2.8
Construction
ITNL
Neutral
147
-
3,622
7,589
8,021
34.0
35.9
16.0
19.0
9.2
7.7
0.6
0.5
6.5
6.7
3.6
3.8
KNR Constructions
Neutral
562
-
1,597
915
1,479
14.3
13.9
20.3
37.2
27.7
15.1
2.5
2.2
9.6
15.6
1.9
1.2
Larsen & Toubro
Accumulate
1,779
2,013
165,454
68,920
82,446
10.9
11.5
57.0
73.0
31.2
24.4
2.9
2.7
13.6
15.5
2.6
2.2
Gujarat Pipavav Port
Neutral
219
-
10,599
793
694
53.0
50.9
9.0
8.0
24.4
27.4
5.3
4.3
25.9
18.4
13.0
14.8
MBL Infrastructures
Buy
268
395
1,111
2,507
2,986
12.4
14.4
21.5
20.5
12.5
13.1
1.5
1.4
12.6
12.7
1.2
1.1
PNC Infratech
Accumulate
455
445
2,335
1,719
2,003
13.0
13.5
21.0
28.0
21.7
16.3
1.9
1.7
11.0
10.9
1.4
1.2
Financials
Allahabad Bank
Neutral
94
-
5,374
8,859
9,817
3.0
3.0
23.7
30.1
4.0
3.1
0.5
0.4
10.6
12.3
-
-
Axis Bank
Buy
579
716
137,652
26,522
31,625
3.6
3.6
36.2
45.4
16.0
12.8
3.1
2.7
18.2
19.6
-
-
Bank of Baroda
Neutral
189
-
41,764
18,934
21,374
2.0
2.0
13.2
15.1
14.3
12.5
1.1
1.0
7.1
7.7
-
-
Bank of India
Neutral
170
-
11,320
17,402
20,003
2.0
2.1
40.3
50.7
4.2
3.4
0.4
0.4
9.0
10.4
-
-
Canara Bank
Neutral
304
-
15,639
15,805
17,745
2.0
2.2
64.3
73.5
4.7
4.1
0.5
0.5
10.8
11.3
-
-
Dena Bank
Neutral
45
-
2,531
3,580
4,040
2.1
2.2
8.4
10.9
5.4
4.1
0.5
0.4
6.8
8.4
-
-
Federal Bank
Neutral
68
-
11,738
3,522
4,045
3.2
3.2
12.2
14.1
5.6
4.9
0.7
0.6
12.9
13.4
-
-
HDFC
Neutral
1,303
-
205,347
11,198
13,321
3.5
3.5
45.1
53.7
28.9
24.3
6.0
5.3
27.2
28.2
-
-
HDFC Bank
Accumulate
1,092
1,255
274,565
38,629
47,500
4.5
4.7
52.6
66.4
20.8
16.5
3.8
3.2
19.6
21.2
-
-
ICICI Bank
Buy
311
370
180,587
36,037
41,647
3.5
3.6
22.9
26.7
13.6
11.7
2.3
2.0
15.7
15.9
-
-
IDBI Bank
Neutral
68
-
10,859
9,806
11,371
1.7
1.9
10.0
16.3
6.8
4.2
0.5
0.4
6.8
10.4
-
-
Market Outlook
August 06, 2015
Stock Watch
Company Name
Reco
CMP
Target
Mkt Cap
Sales ( Čcr )
OPM(%)
EPS (Č)
PER(x)
P/BV(x)
RoE(%)
EV/Sales(x)
(Č)
Price ( Č)
( Č cr )
FY16E FY17E
FY16E
FY17E
FY16E
FY17E
FY16E
FY17E
FY16E
FY17E
FY16E
FY17E
FY16E
FY17E
Financials
Indian Bank
Neutral
156
-
7,507
6,454
7,321
2.5
2.6
26.4
33.3
5.9
4.7
0.5
0.5
8.1
9.6
-
-
LIC Housing Finance
Buy
506
590
25,541
2,934
3,511
2.3
2.3
30.9
36.8
16.4
13.8
2.6
2.3
16.8
17.5
-
-
Oriental Bank
Neutral
183
-
5,478
7,930
8,852
2.5
2.5
51.8
57.1
3.5
3.2
0.4
0.4
9.3
9.5
-
-
Punjab Natl.Bank
Neutral
159
-
29,497
24,160
27,777
2.9
3.0
18.5
24.6
8.6
6.5
0.8
0.7
8.8
10.8
-
-
South Ind.Bank
Neutral
24
-
3,186
1,999
2,249
2.4
2.4
3.5
4.0
6.8
5.9
0.9
0.8
12.6
13.1
-
-
St Bk of India
Neutral
285
-
215,902
86,900
100,550
3.1
3.1
22.1
27.7
12.9
10.3
1.6
1.4
12.7
14.3
-
-
Union Bank
Neutral
204
-
12,995
12,995
14,782
2.4
2.4
32.3
40.9
6.3
5.0
0.8
0.6
10.7
12.3
-
-
Vijaya Bank
Neutral
41
-
3,527
3,474
3,932
1.8
1.9
5.9
7.2
7.0
5.7
0.6
0.5
8.1
9.3
-
-
Yes Bank
Buy
831
989
34,724
7,006
8,825
3.1
3.3
61.4
77.1
13.5
10.8
2.5
2.1
20.1
21.3
-
-
FMCG
Asian Paints
Neutral
921
-
88,385
16,553
19,160
16.0
16.2
17.7
21.5
52.1
42.9
13.8
12.5
29.4
31.2
5.2
4.5
Britannia
Neutral
3,155
-
37,851
8,065
9,395
9.6
10.2
47.2
65.5
66.8
48.2
22.2
21.0
38.3
41.2
4.5
3.9
Colgate
Neutral
1,980
-
26,931
4,836
5,490
19.5
19.7
48.5
53.2
40.8
37.2
29.9
26.1
99.8
97.5
5.5
4.8
Dabur India
Neutral
307
-
53,855
9,370
10,265
17.1
17.2
7.3
8.1
41.8
37.9
12.6
10.3
33.7
30.6
5.7
5.2
GlaxoSmith Con*
Neutral
6,341
-
26,667
4,919
5,742
17.2
17.4
168.3
191.2
37.7
33.2
10.7
9.1
28.8
28.9
5.0
4.2
Godrej Consumer
Neutral
1,413
-
48,104
10,168
12,886
16.1
16.1
32.1
38.4
44.0
36.8
9.0
8.3
19.7
21.0
4.8
3.8
HUL
Neutral
907
-
196,344
34,940
38,957
17.5
17.7
20.8
24.7
43.6
36.7
48.5
38.8
110.5
114.2
5.4
4.8
ITC
Buy
332
409
265,981
41,068
45,068
37.8
37.4
13.9
15.9
23.8
20.9
8.0
7.0
34.1
33.8
6.1
5.5
Marico
Neutral
440
-
28,397
6,551
7,766
15.7
16.0
10.4
12.5
42.4
35.2
12.3
10.2
33.2
32.4
4.3
3.6
Nestle*
Neutral
6,832
-
65,871
11,291
12,847
22.2
22.3
158.9
184.6
43.0
37.0
22.5
20.2
55.0
57.3
5.7
5.0
Tata Global
Accumulate
142
152
8,964
8,635
9,072
9.8
9.9
6.5
7.6
21.9
18.7
2.2
2.1
6.8
7.4
1.0
0.9
IT
HCL Tech^
Buy
938
1,100
131,874
41,535
46,519
24.0
23.4
56.6
61.1
16.6
15.4
3.5
2.7
20.8
17.7
3.1
2.6
Infosys
Buy
1,087
1,306
249,575
60,250
66,999
28.0
28.0
58.3
63.7
18.6
17.1
3.9
3.4
20.9
19.7
3.5
3.0
TCS
Buy
2,542
3,168
497,840
108,420
123,559
28.8
28.7
127.2
143.9
20.0
17.7
8.0
7.4
39.9
41.8
4.2
3.6
Tech Mahindra
Buy
550
646
52,909
25,566
28,890
16.0
17.0
26.3
31.9
20.9
17.3
3.8
3.2
17.9
18.6
1.8
1.6
Wipro
Buy
575
719
141,896
52,414
58,704
23.7
23.8
38.4
42.3
15.0
13.6
2.9
2.6
19.5
18.0
2.3
1.9
Media
D B Corp
Accumulate
329
356
6,042
2,241
2,495
27.8
27.9
21.8
25.6
15.1
12.9
3.9
3.5
26.7
28.5
2.6
2.4
HT Media
Neutral
87
-
2,013
2,495
2,603
11.2
11.2
7.3
8.6
11.9
10.1
0.9
0.9
7.4
8.1
0.3
0.3
Jagran Prakashan
Accumulate
141
156
4,605
1,939
2,122
26.0
26.0
8.3
9.2
17.0
15.3
2.9
2.6
17.5
17.1
2.3
2.1
Sun TV Network
Neutral
353
-
13,913
2,779
3,196
70.2
70.5
22.8
27.3
15.5
12.9
3.8
3.5
26.7
28.3
4.8
4.1
Market Outlook
August 06, 2015
Stock Watch
Company Name
Reco
CMP
Target
Mkt Cap
Sales ( Čcr )
OPM(%)
EPS (Č)
PER(x)
P/BV(x)
RoE(%)
EV/Sales(x)
(Č)
Price ( Č)
( Č cr )
FY16E FY17E
FY16E
FY17E
FY16E
FY17E
FY16E
FY17E
FY16E
FY17E
FY16E
FY17E
FY16E
FY17E
Media
Hindustan Media
Buy
243
292
1,786
920
1,031
20.0
20.0
19.2
20.9
12.7
11.7
2.1
1.8
16.4
15.3
1.5
1.3
Ventures
Metals & Mining
Coal India
Neutral
438
-
276,688
77,595
89,628
22.9
24.4
27.6
30.0
15.9
14.6
6.9
6.8
33.9
33.2
2.9
2.5
Hind. Zinc
Neutral
158
-
66,887
15,546
16,821
47.5
49.0
19.7
20.3
8.0
7.8
1.4
1.2
17.2
16.6
2.1
1.6
Hindalco
Neutral
108
-
22,364
112,328
119,817
7.7
7.9
16.3
20.1
6.7
5.4
0.5
0.5
8.0
8.5
0.7
0.6
JSW Steel
Neutral
886
-
21,418
48,125
53,595
18.8
21.0
46.9
97.5
18.9
9.1
0.9
0.9
4.4
9.5
1.3
1.1
NMDC
Neutral
102
-
40,381
12,544
13,330
59.5
59.7
16.3
16.5
6.3
6.2
1.1
1.0
5.1
9.9
2.0
1.9
SAIL
Neutral
60
-
24,904
56,365
63,383
6.9
8.0
7.1
8.2
8.5
7.4
0.5
0.5
7.0
7.1
1.0
0.9
Vedanta
Neutral
128
-
37,859
81,842
88,430
30.6
32.8
20.2
25.7
6.3
5.0
0.5
0.4
7.5
8.5
0.8
0.6
Tata Steel
Neutral
262
-
25,470
136,805
149,228
11.3
11.9
26.4
36.8
9.9
7.1
0.8
0.7
6.0
8.0
0.7
0.7
Oil & Gas
Cairn India
Neutral
168
-
31,413
12,617
14,513
33.7
40.0
25.5
27.7
6.6
6.0
0.5
0.5
7.4
7.7
1.2
0.9
GAIL
Neutral
345
-
43,737
75,595
85,554
8.6
8.0
31.8
36.1
10.8
9.5
1.2
1.1
10.7
11.4
0.7
0.6
ONGC
Neutral
270
-
231,041
174,773
192,517
22.7
24.8
34.6
38.2
7.8
7.1
1.1
1.0
14.2
14.9
1.4
1.3
Petronet LNG
Neutral
192
-
14,389
45,759
49,386
3.7
4.0
12.6
14.9
15.2
12.9
2.3
2.1
16.1
16.7
0.4
0.3
Reliance Industries
Accumulate
988
1,050
319,816
339,083
384,014
7.8
9.5
75.7
94.5
13.1
10.5
1.3
1.2
10.7
12.2
1.3
1.1
Pharmaceuticals
Alembic Pharma
Neutral
733
-
13,822
2,405
2,859
19.9
20.4
17.7
22.0
41.4
33.3
11.9
9.1
32.6
30.9
5.8
4.8
Aurobindo Pharma
Accumulate
764
824
44,597
14,435
16,600
22.6
22.6
36.1
41.2
21.2
18.5
6.3
4.8
34.5
29.3
3.4
2.9
Aventis*
Neutral
4,179
-
9,624
2,156
2,455
15.1
16.8
109.7
133.9
38.1
31.2
5.2
4.3
18.4
22.5
4.2
3.5
Cadila Healthcare
Neutral
1,919
-
39,281
10,224
11,840
19.7
20.0
69.8
81.0
27.5
23.7
7.3
5.8
26.8
25.3
3.9
3.3
Cipla
Neutral
719
-
57,743
14,051
16,515
18.9
18.7
25.1
28.9
28.7
24.9
4.6
3.9
17.2
16.9
4.1
3.4
Dr Reddy's
Neutral
4,195
-
71,518
17,443
20,296
22.3
22.4
156.7
180.1
26.8
23.3
5.3
4.5
21.8
20.8
4.1
3.4
Dishman Pharma
Buy
202
282
1,627
1,716
1,888
20.2
20.2
16.3
21.6
12.4
9.3
1.2
1.0
9.7
11.7
1.1
0.9
GSK Pharma*
Neutral
3,746
-
31,731
2,818
3,044
18.9
18.9
56.2
58.6
66.7
63.9
18.9
20.4
27.1
30.7
10.8
10.0
Indoco Remedies
Neutral
330
-
3,045
1,088
1,262
18.2
18.2
13.1
15.5
25.2
21.3
4.9
4.1
21.2
21.1
2.9
2.5
Ipca labs
Neutral
723
-
9,125
3,533
4,109
18.6
19.6
28.2
34.8
25.7
20.8
3.6
3.1
15.0
15.9
2.8
2.4
Lupin
Neutral
1,680
-
75,593
14,864
17,244
26.9
26.9
62.1
71.1
27.1
23.6
6.6
5.2
27.4
24.6
4.8
4.0
Sun Pharma
Accumulate
841
950
202,411
27,839
33,542
27.7
29.7
18.9
26.9
44.5
31.3
4.0
3.5
13.0
14.6
6.6
5.2
Power
Tata Power
Neutral
70
-
18,865
38,302
38,404
14.1
13.1
5.1
6.0
13.6
11.7
1.3
1.2
9.2
10.3
1.4
1.4
NTPC
Neutral
137
-
112,551
89,067
98,329
15.9
16.5
12.1
13.1
11.3
10.5
1.2
1.2
11.0
11.6
2.3
2.3
Power Grid
Buy
141
170
73,556
19,986
22,702
86.2
86.3
11.1
12.7
12.7
11.1
1.7
1.5
14.4
14.7
8.8
8.2
Market Outlook
August 06, 2015
Stock Watch
Company Name
Reco
CMP
Target
Mkt Cap
Sales ( Čcr )
OPM(%)
EPS (Č)
PER(x)
P/BV(x)
RoE(%)
EV/Sales(x)
(Č)
Price ( Č)
( Č cr )
FY16E FY17E
FY16E
FY17E
FY16E
FY17E
FY16E
FY17E
FY16E
FY17E
FY16E
FY17E
FY16E
FY17E
Telecom
Bharti Airtel
Neutral
417
-
166,652
101,748
109,191
32.1
31.7
12.0
12.5
34.7
33.4
2.4
2.2
6.9
6.7
2.3
2.1
Idea Cellular
Neutral
166
-
59,739
34,282
36,941
32.0
31.5
5.9
6.2
28.1
26.8
2.6
2.3
9.9
9.3
2.3
2.2
zOthers
Abbott India
Neutral
4,682
-
9,949
2,713
3,141
13.7
13.5
127.8
145.7
36.6
32.1
8.6
7.0
25.9
23.9
3.4
2.8
Bajaj Electricals
Buy
261
341
2,633
4,719
5,287
5.2
5.8
8.6
12.7
30.5
20.6
3.5
3.1
11.4
14.8
0.6
0.5
Finolex Cables
Neutral
254
-
3,886
2,728
3,036
10.8
11.0
14.4
16.8
17.6
15.2
2.7
2.3
15.2
15.3
1.2
1.0
Goodyear India*
Neutral
642
-
1,481
1,536
1,683
9.6
10.0
41.8
48.0
15.4
13.4
2.6
2.3
18.2
18.3
0.7
0.6
Hitachi
Neutral
1,422
-
3,868
1,806
2,112
9.0
9.2
28.6
29.1
49.7
48.9
12.4
10.0
28.1
22.6
2.2
1.9
Jyothy Laboratories
Neutral
302
-
5,460
1,620
1,847
11.5
11.5
7.3
8.5
41.4
35.6
5.4
5.0
13.3
14.4
3.2
2.8
MRF
Neutral
45,397
-
19,254
20,727
14,841
19.3
18.6
4,905.8
3,351.9
9.3
13.5
2.9
2.4
37.6
19.6
0.9
1.2
Page Industries
Neutral
14,550
-
16,229
1,929
2,450
19.8
20.1
229.9
299.0
63.3
48.7
27.9
19.4
52.1
47.1
8.4
6.6
Relaxo Footwears
Neutral
566
-
6,795
1,767
2,152
12.3
12.5
19.3
25.1
29.4
22.6
7.2
5.6
27.7
27.8
3.9
3.2
Siyaram Silk Mills
Neutral
1,255
-
1,176
1,653
1,873
11.7
12.2
99.3
122.1
12.6
10.3
2.3
1.9
19.5
20.2
0.9
0.8
Styrolution ABS India*
Neutral
899
-
1,581
1,271
1,440
8.6
9.2
32.0
41.1
28.1
21.9
2.9
2.6
10.7
12.4
1.2
1.1
Tree House
Accumulate
401
433
1,698
259
324
56.8
56.8
17.0
21.7
23.6
18.5
2.4
2.1
10.1
11.5
6.5
5.3
TVS Srichakra
Neutral
2,962
-
2,268
2,112
2,389
11.9
12.1
168.5
202.5
17.6
14.6
6.1
4.5
39.6
35.5
1.2
1.0
HSIL
Buy
295
434
2,131
2,085
2,436
18.5
18.6
21.7
28.9
13.6
10.2
1.4
1.2
10.0
12.1
1.2
0.9
Kirloskar Engines India
Neutral
315
-
4,555
2,779
3,314
10.3
11.9
12.0
17.5
26.3
18.0
3.2
2.9
12.5
16.7
1.3
1.0
Ltd
M M Forgings
Buy
661
797
798
563
671
22.1
22.9
51.0
66.5
13.0
10.0
2.7
2.2
23.1
24.1
1.6
1.3
Banco Products (India)
Neutral
134
-
959
1,196
1,370
9.7
11.8
9.4
14.3
14.3
9.4
1.4
1.3
10.4
14.5
0.8
0.7
Competent Automobiles Neutral
224
-
138
1,007
1,114
3.1
3.1
23.7
28.2
9.5
8.0
1.3
1.2
13.9
14.6
0.1
0.1
Nilkamal
Neutral
1,097
-
1,637
1,948
2,147
10.6
10.3
60.0
67.0
18.3
16.4
2.9
2.5
16.8
16.1
0.9
0.8
Visaka Industries
Neutral
168
-
267
1,158
1,272
8.6
9.5
23.7
32.7
7.1
5.1
0.7
0.6
10.1
12.5
0.4
0.3
Transport Corporation of
Accumulate
275
293
2,078
2,830
3,350
8.8
9.0
14.4
18.3
19.1
15.0
2.9
2.6
15.4
17.1
0.9
0.7
India
Elecon Engineering
Neutral
95
-
1,035
1,452
1,596
13.7
14.7
4.2
6.2
22.9
15.2
1.8
1.6
8.1
11.2
1.0
0.9
Surya Roshni
Neutral
147
-
645
2,992
3,223
8.4
8.7
15.2
19.3
9.7
7.6
0.9
0.8
10.1
11.5
0.5
0.5
MT Educare
Buy
121
141
481
275
355
18.3
17.3
7.4
8.8
16.3
13.7
3.3
2.9
20.2
21.1
1.6
1.2
Radico Khaitan
Buy
94
112
1,251
1,565
1,687
11.9
12.4
5.4
6.6
17.4
14.3
1.4
1.3
8.0
9.0
1.3
1.2
Garware Wall Ropes
Buy
298
390
652
875
983
10.4
10.6
23.1
27.8
12.9
10.7
1.8
1.6
14.1
14.8
0.8
0.6
Source: Company, Angel Research; Note: *December year end; #September year end; &October year end; Price as on August 05, 2015
Market Outlook
August 06, 2015
Research Team Tel: 022 - 39357800
DISCLAIMER
Angel Broking Private Limited (hereinafter referred to as “Angel”) is a registered Member of National Stock Exchange of India Limited,
Bombay Stock Exchange Limited and MCX Stock Exchange Limited. It is also registered as a Depository Participant with CDSL and
Portfolio Manager with SEBI. It also has registration with AMFI as a Mutual Fund Distributor. Angel Broking Private Limited is a registered
entity with SEBI for Research Analyst in terms of SEBI (Research Analyst) Regulations, 2014 vide registration number INH000000164.
Angel or its associates has not been debarred/ suspended by SEBI or any other regulatory authority for accessing /dealing in securities
Market. Angel or its associates including its relatives/analyst do not hold any financial interest/beneficial ownership of more than 1% in
the company covered by Analyst. Angel or its associates/analyst has not received any compensation / managed or co-managed public
offering of securities of the company covered by Analyst during the past twelve months. Angel/analyst has not served as an officer,
director or employee of company covered by Analyst and has not been engaged in market making activity of the company covered by
Analyst.
This document is solely for the personal information of the recipient, and must not be singularly used as the basis of any investment
decision. Nothing in this document should be construed as investment or financial advice. Each recipient of this document should make
such investigations as they deem necessary to arrive at an independent evaluation of an investment in the securities of the companies
referred to in this document (including the merits and risks involved), and should consult their own advisors to determine the merits and
risks of such an investment.
Reports based on technical and derivative analysis center on studying charts of a stock's price movement, outstanding positions and
trading volume, as opposed to focusing on a company's fundamentals and, as such, may not match with a report on a company's
fundamentals.
The information in this document has been printed on the basis of publicly available information, internal data and other reliable sources
believed to be true, but we do not represent that it is accurate or complete and it should not be relied on as such, as this document is for
general guidance only. Angel Broking Pvt. Limited or any of its affiliates/ group companies shall not be in any way responsible for any
loss or damage that may arise to any person from any inadvertent error in the information contained in this report. Angel Broking Pvt.
Limited has not independently verified all the information contained within this document. Accordingly, we cannot testify, nor make any
representation or warranty, express or implied, to the accuracy, contents or data contained within this document. While Angel Broking
Pvt. Limited endeavors to update on a reasonable basis the information discussed in this material, there may be regulatory, compliance,
or other reasons that prevent us from doing so.
This document is being supplied to you solely for your information, and its contents, information or data may not be reproduced,
redistributed or passed on, directly or indirectly.
Neither Angel Broking Pvt. Limited, nor its directors, employees or affiliates shall be liable for any loss or damage that may arise from or
in connection with the use of this information.
Note: Please refer to the important ‘Stock Holding Disclosure' report on the Angel website (Research Section). Also, please refer to the
latest update on respective stocks for the disclosure status in respect of those stocks. Angel Broking Pvt. Limited and its affiliates may have
investment positions in the stocks recommended in this report.