Market Outlook
June 06, 2016
Market Cues
Domestic Indices
Chg (%)
(Pts)
(Close)
Indian Markets are expected to open flat tracking SGX Nifty.
BSE Sensex
(0.0)
(0)
26,843
Equity markets and U.S. dollar traded lower Friday, while gold soared higher on the
Nifty
0.0
2
8,221
heels of release of Employment report, key piece of employment data that Fed
Mid Cap
(0.1)
(12)
11,395
considers for monetary policy. The report showed that U.S. economy created fewest
Small Cap
(0.4)
(47)
11,149
jobs in more than 5 years in May as employment in manufacturing, mining and
Bankex
0.8
165
20,220
construction sectors fell sharply. Payrolls only increased by 38,000 jobs last month,
below the consensus forecast of 164,000.
Global Indices
Chg (%)
(Pts)
(Close)
Majority of European markets ended Friday's session in negative territory, after the
Dow Jones
(0.2)
(32)
17,807
U.S. job growth for May came in weaker than anticipated. FTSE also gave up its
earlier gains, but ended in positive territory as European markets took hammering
Nasdaq
(0.6)
(29)
4,943
following the dismal economic update from America. CIPS services purchasing
FTSE
0.4
24
6,210
managers' index (PMI) showed a reading of 53.5 in May, up from 52.3 in April,
0.5
80
16,642
Nikkei
when activity rose at its slowest pace for over 3 years. A reading above 50 signals
0.4
88
20,947
Hang Seng
growth. Mining majors Glencore and Anglo American closed in the green.
0.5
13
2,939
Shanghai Com
Indian markets hit fresh 7-month high intraday on Friday with Sensex reclaiming the
27,000 and Nifty 8,250 levels. However, profit booking in the last couple of hours
Advances / Declines
BSE
NSE
of trade pulled down the benchmarks as well as broader markets to end on a flat
note, despite all the positive global cues.
Advances
1,084
670
Declines
1,559
891
News Analysis
Unchanged
169
70
HDFC Ergo to acquire L&T Insurance arm for `551cr
India to invest `3.3 lakh cr on 3 new Dedicated Freight Corridors
Volumes (` Cr)
Detailed analysis on Pg2
BSE
2,935
Investor’s Ready Reckoner
NSE
20,319
Key Domestic & Global Indicators
Stock Watch: Latest investment recommendations on 150+ stocks
Net Inflows (` Cr)
Net
Mtd
Ytd
Refer P54 onwards
FII
603
946
15,315
MFs
(204)
(188)
9,243
Top Picks
CMP
Target
Upside
Company
Sector
Rating
(`)
(`)
(%)
Top Gainers
Price (`)
Chg (%)
Amara Raja
Auto/Auto Ancillary
Buy
836
1,076
28.7
Natcopharm
518
8.5
HCL Tech
IT
Buy
722
1,000
38.5
Iifl
225
7.9
LIC Housing
Financials
Buy
475
592
24.5
Bharat Electronics
Capital Goods
Buy
1,143
1,414
23.7
Manappuram
57
7.5
Navkar Corporation Others
Buy
200
265
32.7
Sreinfra
60
6.5
More Top Picks on Pg4
Muthootfin
254
4.9
Key Upcoming Events
Previous
Consensus
Top Losers
Price (`)
Chg (%)
Date
Region
Event Description
Reading
Expectations
Idea
107
(10.0)
June 06 EUR
German Factory orders (MoM) (Apr)
1.9%
(0.6%)
Vakrangee
172
(6.9)
June 06 US
BRC Retail Sales Monitor (YoY) (May)
(0.9%)
Gvkpil
4
(6.8)
June 07 India
RBI Repo rate
6.5
6.5
Welcorp
71
(5.2)
June 07 India
RBI Reverse Repo rate
6.0
6.0
6.(
Aloktext
3
(5.0)
More Events on Pg5
As on June 3, 2016
Market Outlook
June 06, 2016
HDFC Ergo to acquire L&T Insurance arm for `551cr
HDFC Ergo (Joint Venture between home loan major HDFC and German insurer
Ergo International), has agreed to buy L&T General Insurance for `551cr. To
complete the acquisition process, HDFC Ergo has to apply to Insurance regulator,
IRDA and Competition Commission of India (CCI). The acquisition will help HDFC
Ergo become 3rd largest private general insurer, behind ICICI Lombard and Bajaj
Allianz General Insurance, over-taking Iffco Tokio.
This deal has been valued at 1.1x gross premium and 3.9x the book value of L&T
General Insurance.
L&T General Insurance, part of India's largest engineering company L&T started its
operations in FY2011. It currently has ~28 offices and 800 employees. It earned
gross written premium of `483cr during FY2016, focusing mainly on private motor
and retail health insurance. It is the 14th largest player in the sector with 0.5%
market share. L&T General Insurance has 2,000 retail agents and sells policies
through L&T Finance branches. The Insurance company reported `102cr loss in
the last fiscal.
Earlier in 2013, L&T attempted to merge its general insurance subsidiary with
Future Generali Insurance but called off the plan due to differences over valuation.
HDFC Ergo (owned 51% by HDFC and 49% by Re-insurance giant Munich Re's
Ergo), operates out 108 branches spread across 91 cities. The company had gross
written premium of `3,467cr in FY2016, across motor, health, property and crops
insurance. It reported profit of `151cr during FY2016.
Our View: We expect this proposed acquisition to result in larger size, better
expertise for the combined entity. Further, this acquisition should lead to improved
cost efficiencies (on account of technology optimization, rationalization of offices)
in merged entity and benefit the policy holders on a whole.
This transaction would not majorly affect the consol. financials of the company
given the size of the business and transaction, but this development is very much
in-line with L&T management’s long-term strategy to divest its non-core assets. L&T
Management had guided in 4QFY2016 analyst meet that they intend to divest
stake in their Insurance arm.
We continue to maintain BUY rating on L&T with price target of `1,700.
India to invest `3.3 lakh cr on 3 new Dedicated Freight Corridors
In this year’s Railway Budget 3 new Railway corridors were announced, namely,
2,328km North-South corridor (between Delhi-Chennai);
2,327km East-West
corridor (between Kolkata-Mumbai); and 1,114km East Coast corridor (between
Kharagpur-Vijaywada). The proposed
5,500km long new corridors would
supplement the existing plans to lay 3,300km of long 2 Dedicated Freight
Corridors (DFC’s).
Feasibility study of the 3 corridors has been completed and submitted by RITES
(consultancy firm). The 3 corridors are expected to be developed at cost of `3.3
lakh cr in the ~8 years. This is in extension to the `82,000cr DFC plan being
implemented.
Market Outlook
June 06, 2016
Dedicated Freight Corridor Corporation (DFCC) has not shared any details of the
funding plan. However, top management of DFCC has highlighted that- Earnings
from the freight carried by DFCC will go to Indian Railways. Railways will then
share with us ~35-40% of the apportioned earnings as Track Access Charges
(TACs), which could be used for the next round of capex. We sense that Railways
could explore Bond markets, funding from JICA/ WB/ ADB and other financing
avenues to address funding shortfall for the proposed capex.
DFCC is soon expected to place total contracts worth `10,000cr in FY2017,
including 2 contracts worth `2,300cr for works on Saharanpur-Ludhiana and
Khurja-Dadri sections. `900cr contract is expected to be issued for Kanpur-
Mughalsarai section of Eastern DFCC. With entire funding tied-up and contracts in
place, entire DFCC project would be implemented in phases between Mar-18 and
Dec-19.
We expect this to be a positive announcement for Infrastructure/ Construction
companies, like L&T (management claims 75-80% of market share for projects
awarded in FY2016), Gammon, Tata Projects, IVRCL, Simplex amongst other
players.
Economic and Political News
Govts of Telangana, US' California sign MoU, pledge cooperation
India, US to identify new ways in defence cooperation
Services growth declines to 6-month low in May: PMI
Corporate News
Aramco, Total, Shell eye entry into retail fuel market: Pradhan
Pradhan says govt won't come in way of ONGC-GSPC deal
Reliance Industries restarts PTA plants at Dahej
Future Consumer plans to raise `134cr from IFC
Adani Enterprise may withdraw from Australian coal mine project: Report
Market Outlook
June 06, 2016
Top Picks ★★★★★
Large Cap
Market Cap
CMP
Target
Upside
Company
Rationale
(` Cr)
(`)
(`)
(%)
To outpace battery industry growth due to better technological
Amara Raja Batteries
14,285
836
1,076
28.7
products leading to market share gains in both the
automotive OEM and replacement segments.
Uptick in defense capex by government, coupled with BELs
Bharat Electronics
27,439
1,143
1,414
23.7
strong market positioning, indicate good times ahead for BEL.
Strong product pipeline, (82 ANDAs are pending approvals),
Dr Reddys Lab.
53,881
3,159
3,476
10.0
new product launches, strong earnings growth potential.
HCL Tech
101,821
722
1,000
38.5
Stock is trading at attractive valuations & factors all bad news.
Strong visibility for a robust 20% earnings trajectory, coupled
HDFC Bank
296,452
1,172
1,262
7.7
with high quality of earnings on account of high quality retail
business and strategic focus on highly rated corporates.
Back on the growth trend, expect a long term growth of 14%
Infosys
290,897
1,266
1,374
8.5
to be a US$20bn in FY2020.
Continues to grow its retail loan book at healthy pace with
improvement in asset quality. Expect LICHF to post a healthy
LIC Housing Finance
23,984
475
592
24.5
loan book which is likely to reflect in a strong earnings
growth.
Huge bid pipeline of re-development works at Delhi and
NBCC
11,772
195
220
11.3
other State Governments and opportunity from Smart City,
positions NBCC to report strong growth, going forward.
Strong market positioning within the domestic AC markets to
Voltas
11,058
334
407
21.8
continue, EMP business set to revive
Source: Company, Angel Research
Mid Cap
Market Cap
CMP
Target
Upside
Company
Rationale
(` Cr)
(`)
(`)
(%)
Among the top 4 players in the consumer durables segment.
Bajaj Electricals
2,243
222
268
20.6
Improved profitability backed by turn around in E&P segment.
Strong order book lends earnings visibility.
Favourable outlook for AC industry to augur well for Cooling
Blue Star
3,746
416
495
18.9
products business. EMPPAC division's profitability to improve
once operating environment turns around.
With a focus on the low and medium income (LMI) consumer
Dewan Housing
5,754
197
270
36.9
segment, the company has increased its presence in tier-II &
III cities where the growth opportunity is immense.
Strong loan growth backed by diversified loan portfolio and
Equitas Holdings
5,822
174
235
35.4
adequate CAR. ROE & ROA likely to remain decent as risk of
dilution remains low. Attractive valuations considering growth.
Commencement of new projects, downtrend in the interest
IL&FS Transport
2,288
70
93
33.7
rate cycle, to lead to stock re-rating
Economic recovery to have favourable impact on advertising
& circulation revenue growth. Further, the acquisition of a
Jagran Prakashan
5,571
170
205
20.3
radio business (Radio City) would also boost the company's
revenue growth.
Speedier execution and speedier sales, strong revenue
Mahindra Lifespace
1,792
437
554
26.8
visibility in short-to-long run, attractive valuations
Massive capacity expansion along with rail advantage at ICD
Navkar Corporation
2,847
200
265
32.7
as well CFS augurs well for the company
Earnings boost on back of stable material prices and
Radico Khaitan
1,181
89
125
40.8
favourable pricing environment. Valuation discount to peers
provides additional comfort
Strong brands and distribution network would boost growth
Siyaram Silk Mills
961
1,025
1,347
31.4
going ahead. Stock currently trades at an inexpensive
valuation.
Source: Company, Angel Research
Market Outlook
June 06, 2016
Key Upcoming Events
Global economic events release calendar
Date
Time
Country
Event Description
Unit
Period
Bloomberg Data
Last Reported Estimated
Jun 7, 2016
2:30PM
Euro Zone
Euro-Zone GDP s.a. (QoQ)
% Change
1Q F
0.50
0.50
11:00AM
India
RBI Reverse Repo rate
%
Jun 7
6.00
6.00
11:00AM
India
RBI Cash Reserve ratio
%
Jun 7
4.00
4.00
11:00AM
India
RBI Repo rate
%
Jun 7
6.50
6.50
Jun 8, 2016
2:00PM
UK
Industrial Production (YoY)
% Change
Apr
(0.20)
(0.40)
7:00AM
China
Consumer Price Index (YoY)
% Change
May
2.30
2.30
Jun 9, 2016
China
Exports YoY%
% Change
May
(1.80)
(4.20)
6:00PM
US
Initial Jobless claims
Thousands
Jun 4
267.00
270.00
Jun 10, 2016
India
Imports YoY%
% Change
May
(23.10)
--
India
Exports YoY%
% Change
May
(6.70)
--
5:30PM
India
Industrial Production YoY
% Change
Apr
0.10
--
Jun 12, 2016
11:00AM
China
Industrial Production (YoY)
% Change
May
6.00
6.00
Jun 14, 2016
12:00PM
India
Monthly Wholesale Prices YoY%
% Change
May
0.34
--
2:00PM
UK
CPI (YoY)
% Change
May
0.30
--
Jun 15, 2016
2:00PM
UK
Jobless claims change
% Change
May
(2.40)
--
US
Producer Price Index (mom)
% Change
May
0.20
--
6:45PM
US
Industrial Production
%
May
0.66
(0.10)
2:30PM
Euro Zone
Euro-Zone CPI (YoY)
%
May F
(0.10)
--
Jun 16, 2016
11:30PM
US
FOMC rate decision
%
Jun 15
0.50
0.50
6:00PM
US
Consumer price index (mom)
% Change
May
0.40
0.20
4:30PM
UK
BOE Announces rates
% Ratio
Jun 16
0.50
--
Jun 17, 2016
6:00PM
US
Housing Starts
Thousands
May
1,172.00
1,164.00
6:00PM
US
Building permits
Thousands
May
1,130.00
1,145.00
Jun 22, 2016
7:30PM
Euro Zone
Euro-Zone Consumer Confidence
Value
Jun A
(7.00)
--
7:30PM
US
Existing home sales
Million
May
5.45
--
Jun 23, 2016
1:00PM
Germany
PMI Services
Value
Jun P
55.20
--
1:00PM
Germany
PMI Manufacturing
Value
Jun P
52.10
--
7:30PM
US
Consumer Confidence
S.A./ 1985=100
Jun
92.60
--
Source: Bloomberg, Angel Research
Market Outlook
June 06, 2016
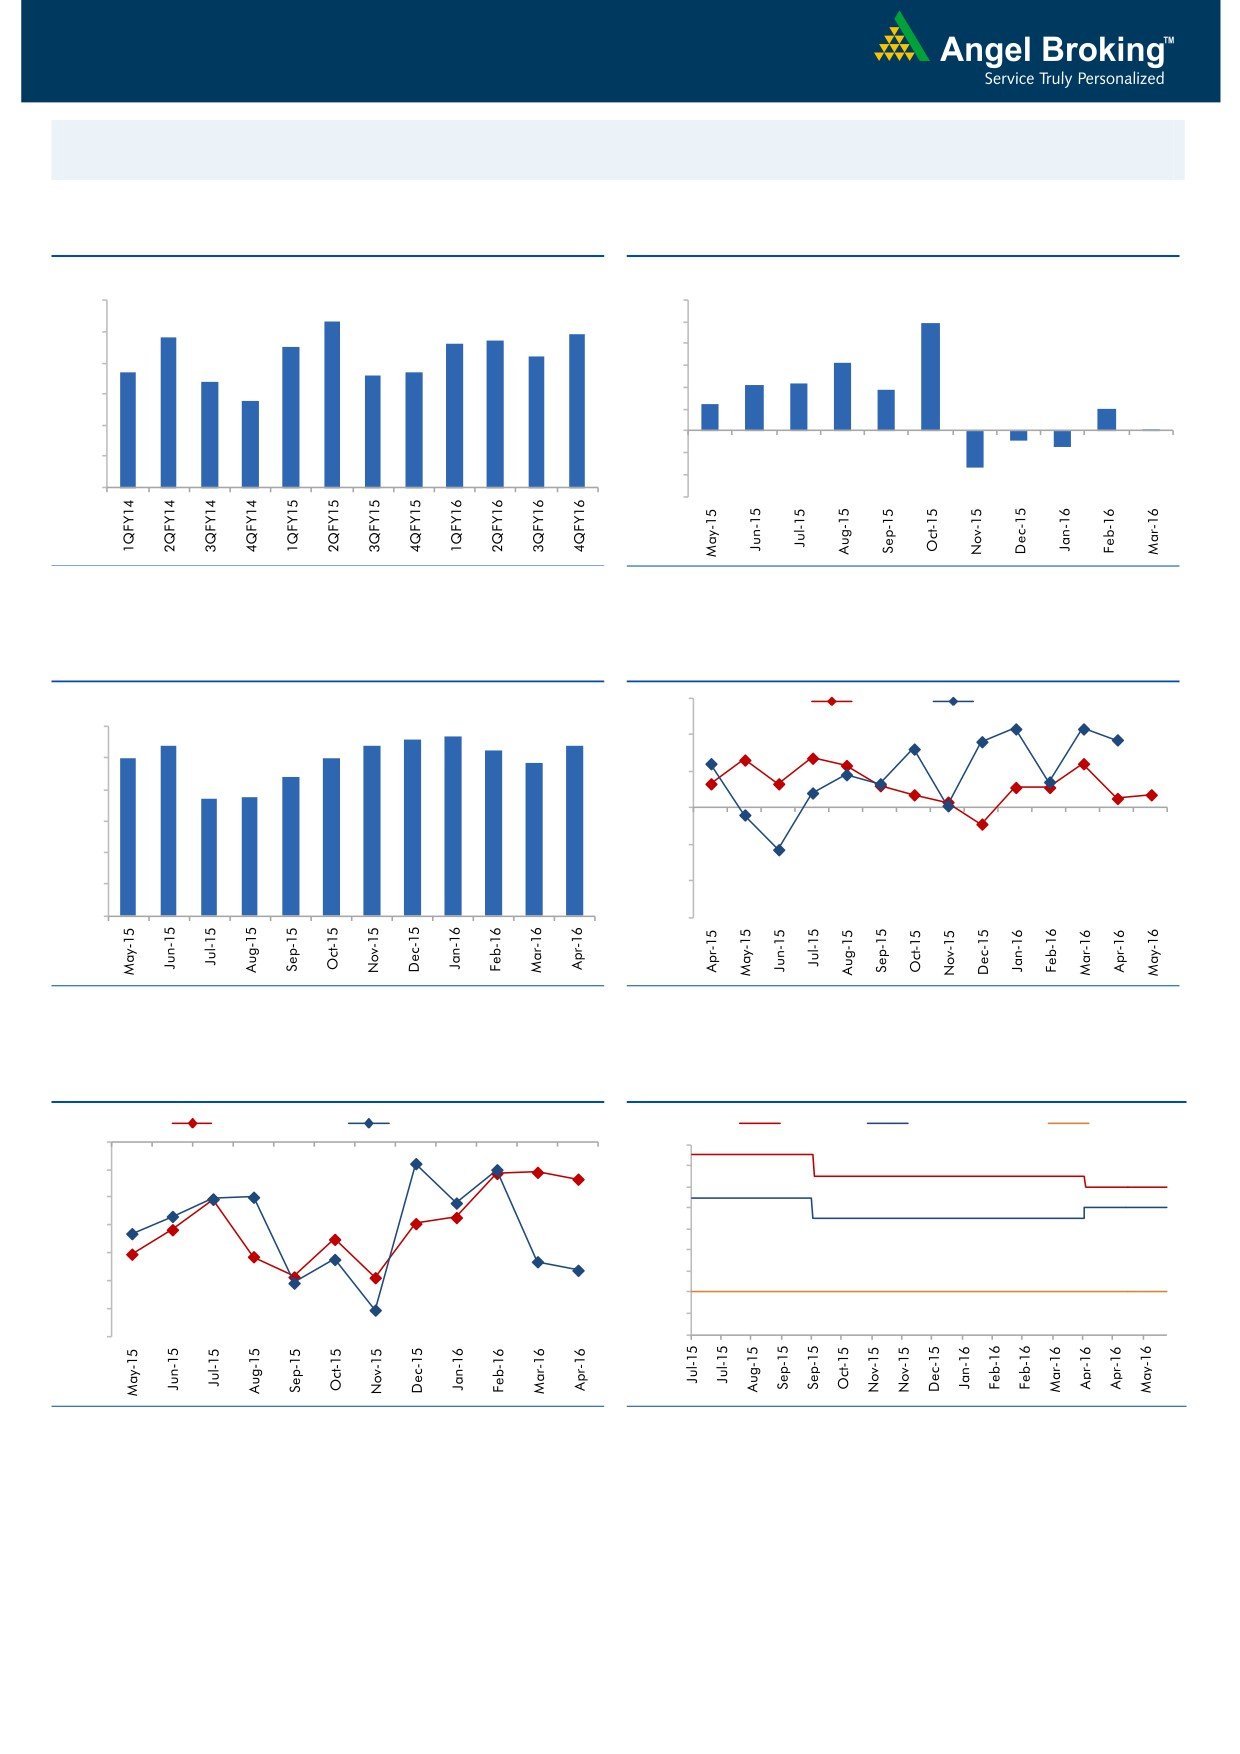
Macro watch
Exhibit 1: Quarterly GDP trends
Exhibit 2: IIP trends
(%)
(%)
9.0
8.3
12.0
9.9
7.8
7.7
7.9
10.0
8.0
7.5
7.6
7.2
8.0
6.3
6.7
6.6
6.7
7.0
6.4
6.0
4.2
4.3
3.7
5.8
4.0
2.5
6.0
2.0
2.0
0.1
5.0
-
4.0
(2.0)
(0.9)
(1.5)
(4.0)
3.0
(3.4)
(6.0)
Source: CSO, Angel Research
Source: MOSPI, Angel Research
Exhibit 3: Monthly CPI inflation trends
Exhibit 4: Manufacturing and services PMI
56.0
Mfg. PMI
Services PMI
(%)
5.6
5.7
6.0
5.4
5.4
5.4
5.3
54.0
5.0
5.0
4.8
5.0
4.4
52.0
3.7
3.7
4.0
50.0
3.0
48.0
2.0
1.0
46.0
-
44.0
Source: MOSPI, Angel Research
Source: Market, Angel Research; Note: Level above 50 indicates expansion
Exhibit 5: Exports and imports growth trends
Exhibit 6: Key policy rates
(%)
Exports yoy growth
Imports yoy growth
(%)
Repo rate
Reverse Repo rate
CRR
0.0
7.50
(5.0)
7.00
6.50
(10.0)
6.00
(15.0)
5.50
(20.0)
5.00
4.50
(25.0)
4.00
(30.0)
3.50
(35.0)
3.00
Source: Bloomberg, Angel Research
Source: RBI, Angel Research
Market Outlook
June 06, 2016
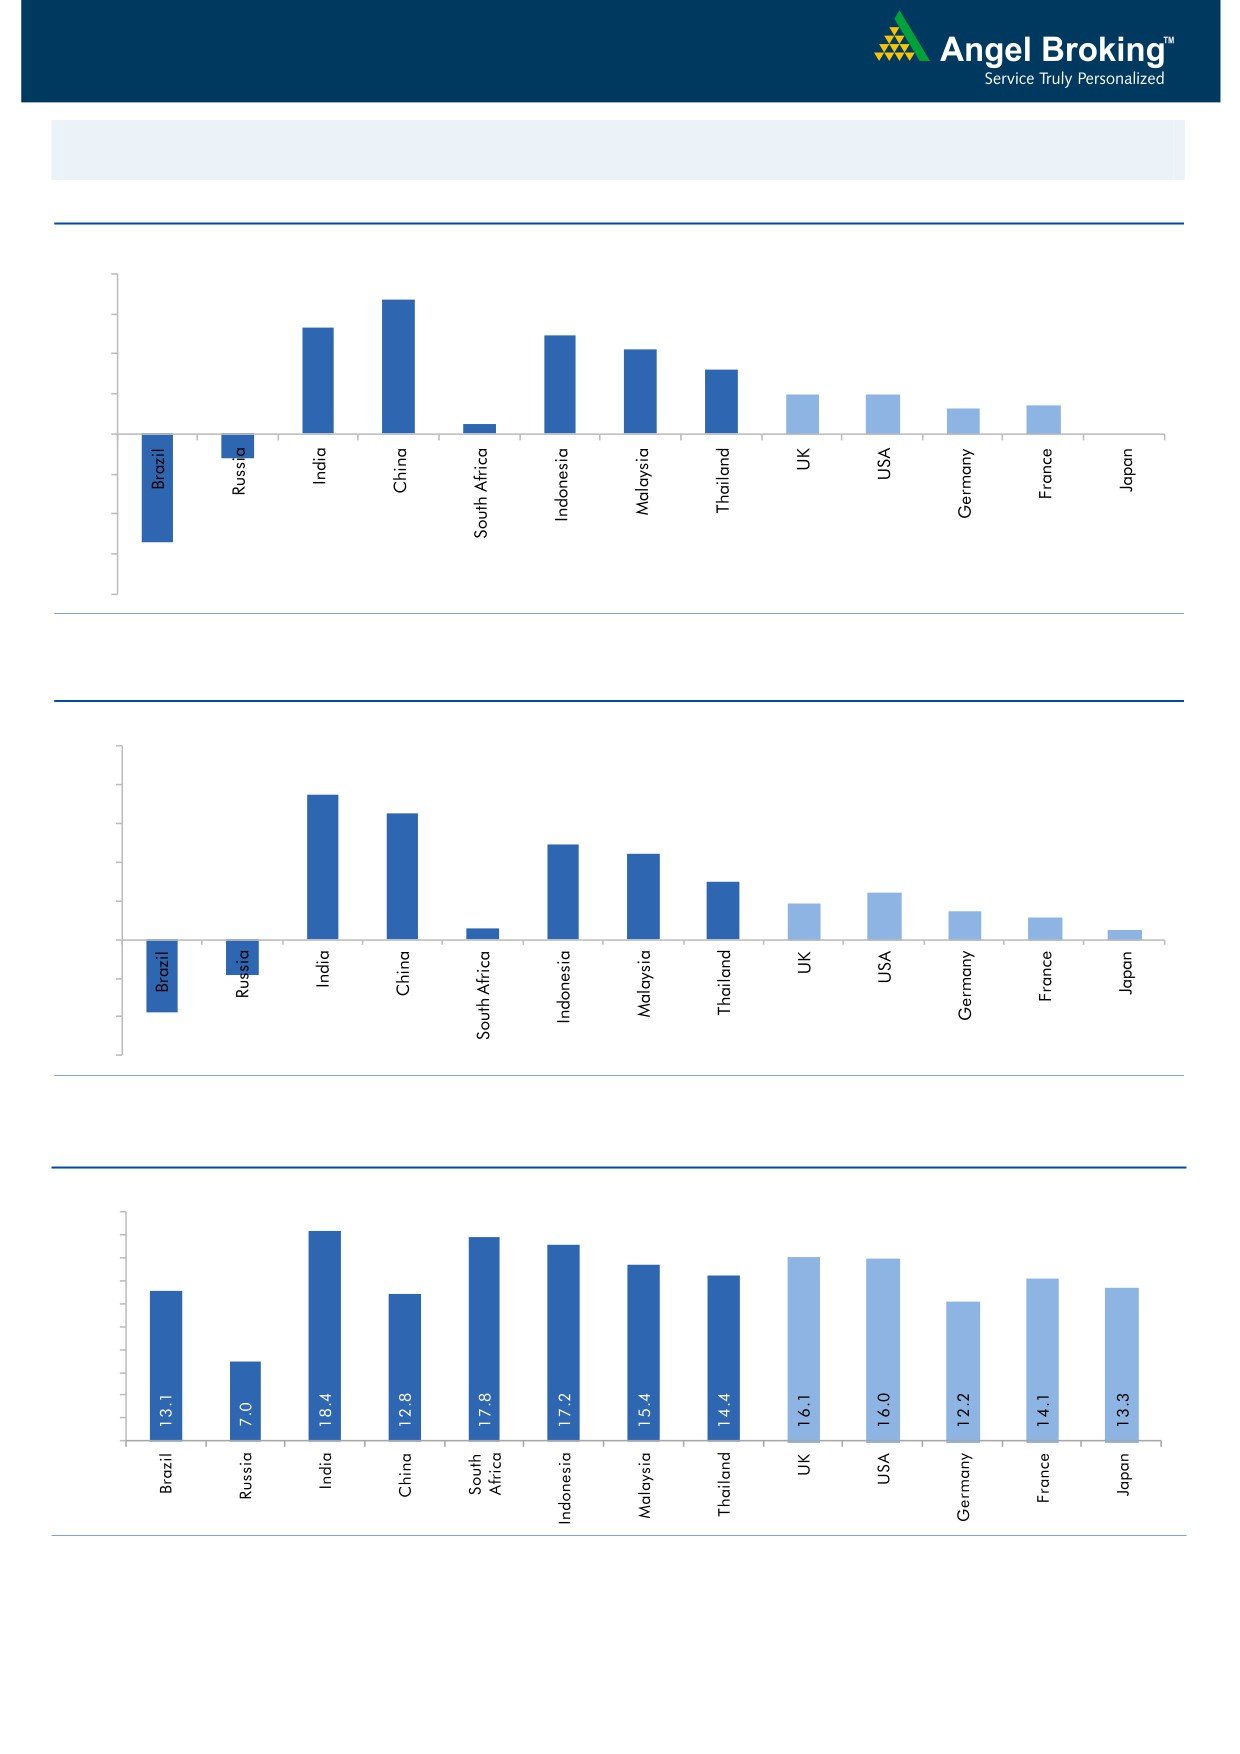
Global watch
Exhibit 1: Latest quarterly GDP Growth (%, yoy) across select developing and developed countries
(%)
8.0
6.7
6.0
5.3
4.9
4.2
4.0
3.2
2.0
2.0
1.3
1.4
2.0
0.5
-
-
(2.0)
(4.0)
(1.2)
(6.0)
(5.4)
(8.0)
Source: Bloomberg, Angel Research
Exhibit 2: 2016 GDP Growth projection by IMF (%, yoy) across select developing and developed countries
(%)
10.0
7.5
8.0
6.5
6.0
4.9
4.4
4.0
3.0
2.4
1.9
1.5
2.0
1.1
0.6
0.5
(3.8)
(1.8)
-
(2.0)
(4.0)
(6.0)
Source: IMF, Angel Research
Exhibit 3: One year forward P-E ratio across select developing and developed countries
(x)
20.0
18.0
16.0
14.0
12.0
10.0
8.0
6.0
4.0
2.0
-
Source: IMF, Angel Research
Market Outlook
June 06, 2016
Exhibit 4: Relative performance of indices across globe
Returns (%)
Country
Name of index
Closing price
1M
3M
1YR
Brazil
Bovespa
50,620
(3.1)
12.8
(6.7)
Russia
Micex
1,887
(3.4)
2.3
15.8
India
Nifty
8,221
6.7
16.9
(2.5)
China
Shanghai Composite
2,939
(1.8)
2.8
(40.5)
South Africa
Top 40
48,084
5.5
9.8
4.3
Mexico
Mexbol
45,928
1.3
2.9
3.1
Indonesia
LQ45
831
0.5
(0.7)
(9.8)
Malaysia
KLCI
1,636
(1.3)
(3.3)
(6.4)
Thailand
SET 50
917
3.3
7.7
(8.0)
USA
Dow Jones
17,807
0.3
5.1
(0.2)
UK
FTSE
6,210
0.4
0.9
(8.5)
Japan
Nikkei
16,642
(0.1)
3.8
(18.6)
Germany
DAX
10,103
1.8
3.3
(8.2)
France
CAC
4,422
2.3
0.1
(9.8)
Source: Bloomberg, Angel Research
Stock Watch
June 06, 2016
Company Name
Reco
CMP
Target
Mkt Cap
Sales ( Čcr )
OPM(%)
EPS (Č)
PER(x)
P/BV(x)
RoE(%)
EV/Sales(x)
(Č)
Price ( Č)
( Č cr )
FY16E FY17E
FY16E
FY17E
FY16E
FY17E
FY16E
FY17E
FY16E
FY17E
FY16E
FY17E
FY16E
FY17E
Agri / Agri Chemical
Rallis
Neutral
215
-
4,188
1,612
1,911
13.3
13.3
7.4
9.5
29.1
22.7
4.7
4.2
16.7
18.4
2.6
2.2
United Phosphorus
Accumulate
606
684
25,963
13,083
15,176
18.5
18.5
31.5
37.4
19.2
16.2
3.8
3.2
21.4
21.4
2.2
1.8
Auto & Auto Ancillary
Ashok Leyland
Neutral
106
-
30,266
17,995
21,544
11.4
11.6
3.4
4.7
31.3
22.6
5.5
5.0
17.7
22.2
1.6
1.3
Bajaj Auto
Neutral
2,635
-
76,248
22,709
25,860
20.9
20.1
129.0
143.6
20.4
18.4
6.3
5.4
30.7
29.4
2.9
2.5
Bharat Forge
Buy
751
875
17,486
7,351
8,318
19.9
19.7
31.2
36.5
24.1
20.6
4.3
3.6
19.3
19.2
2.5
2.2
Eicher Motors
Accumulate
18,787
20,044
51,028
15,556
16,747
15.5
17.3
464.8
597.5
40.4
31.4
14.8
10.9
36.2
34.3
3.2
2.9
Gabriel India
Accumulate
90
101
1,289
1,415
1,544
8.7
9.0
4.6
5.4
19.5
16.6
3.5
3.1
18.1
18.9
0.9
0.8
Hero Motocorp
Neutral
3,147
-
62,838
28,244
30,532
15.5
15.9
156.7
168.5
20.1
18.7
8.0
6.8
39.9
36.4
2.1
1.9
Jamna Auto Industries Neutral
161
-
1,283
1,281
1,473
11.2
11.5
7.6
9.2
21.1
17.5
5.3
4.4
25.4
25.2
1.1
0.9
L G Balakrishnan & Bros Neutral
465
-
730
1,254
1,394
11.6
11.8
35.9
41.7
13.0
11.2
1.8
1.6
13.5
13.8
0.7
0.6
Mahindra and Mahindra Neutral
1,353
-
84,062
38,416
42,904
13.7
13.9
54.8
63.4
24.7
21.4
3.8
3.4
15.4
15.8
1.8
1.6
Maruti
Neutral
4,220
-
127,481
57,865
68,104
16.4
16.7
176.3
225.5
23.9
18.7
4.7
4.0
19.4
21.2
2.0
1.6
Minda Industries
Neutral
1,177
-
1,868
2,523
2,890
8.7
9.0
55.0
65.4
21.4
18.0
4.1
3.4
19.3
18.7
0.8
0.7
Motherson Sumi
Accumulate
276
313
36,567
39,343
45,100
8.8
9.1
10.1
12.5
27.4
22.1
8.7
6.8
35.3
34.4
1.0
0.9
Rane Brake Lining
Buy
378
465
299
454
511
11.5
12.0
25.2
31.0
15.0
12.2
2.2
2.0
14.9
16.6
0.8
0.7
Setco Automotive
Neutral
39
-
521
594
741
12.7
13.7
1.7
3.2
22.9
12.2
2.4
2.1
10.4
16.9
1.3
1.1
Tata Motors
Neutral
454
-
131,050
259,686
273,957
13.0
13.4
25.9
29.5
17.5
15.4
2.3
2.0
8.0
9.0
0.7
0.7
TVS Motor
Accumulate
297
330
14,115
11,263
13,122
6.9
8.5
9.2
15.0
32.3
19.8
7.4
5.9
22.7
29.6
1.2
1.0
Amara Raja Batteries
Buy
836
1,076
14,285
4,690
5,429
17.5
17.5
28.5
35.3
29.4
23.7
6.8
5.6
23.1
25.9
3.0
2.6
Exide Industries
Neutral
158
-
13,409
6,950
7,784
14.4
14.8
6.6
7.3
23.9
21.6
3.0
2.8
12.6
12.8
1.6
1.5
Apollo Tyres
Buy
151
183
7,684
12,056
12,714
17.2
16.4
23.0
20.3
6.6
7.4
1.2
1.0
17.7
13.6
0.7
0.7
Ceat
Buy
901
1,119
3,643
6,041
6,597
14.1
13.7
99.5
111.9
9.1
8.1
1.8
1.5
19.6
18.5
0.8
0.6
JK Tyres
Neutral
86
-
1,959
7,446
7,669
15.2
14.0
19.6
18.4
4.4
4.7
1.1
0.9
25.2
19.5
0.7
0.6
Swaraj Engines
Neutral
1,104
-
1,371
552
630
14.2
14.7
44.6
54.1
24.7
20.4
5.8
5.2
23.2
25.6
2.3
2.0
Subros
Neutral
93
-
556
1,293
1,527
11.8
11.9
4.2
6.7
22.1
13.8
1.7
1.5
7.7
11.5
0.7
0.6
Indag Rubber
Neutral
189
-
495
283
329
17.0
17.2
13.0
15.4
14.6
12.2
3.2
2.6
21.8
21.6
1.5
1.2
Capital Goods
ACE
Neutral
40
-
399
660
839
4.7
8.2
1.0
3.9
40.4
10.4
1.3
1.1
3.2
11.3
0.8
0.6
BEML
Buy
829
1,157
3,453
3,277
4,006
6.0
8.9
36.2
64.3
22.9
12.9
1.6
1.4
5.7
11.7
1.1
0.9
Bharat Electronics
Buy
1,143
1,414
27,439
7,295
8,137
20.0
16.8
56.5
58.7
20.2
19.5
3.0
2.7
42.1
44.6
3.0
2.5
Stock Watch
June 06, 2016
Company Name
Reco
CMP
Target
Mkt Cap
Sales ( Čcr )
OPM(%)
EPS (Č)
PER(x)
P/BV(x)
RoE(%)
EV/Sales(x)
(Č)
Price ( Č)
( Č cr )
FY16E
FY17E
FY16E
FY17E
FY16E
FY17E
FY16E
FY17E
FY16E
FY17E
FY16E
FY17E
FY16E
FY17E
Capital Goods
Voltas
Buy
334
407
11,058
5,857
6,511
7.5
7.9
11.7
12.9
28.6
25.9
4.7
4.1
17.1
16.7
1.9
1.7
BGR Energy
Neutral
113
-
812
3,615
3,181
9.5
9.4
16.7
12.4
6.7
9.1
0.6
0.6
10.0
7.0
0.6
0.8
BHEL
Neutral
118
-
28,869
33,722
35,272
10.8
11.7
10.5
14.2
11.2
8.3
0.8
0.8
7.0
9.0
0.9
0.9
Blue Star
Buy
416
495
3,746
3,770
4,351
5.7
6.4
11.4
17.2
36.5
24.3
5.7
5.3
18.4
23.1
1.0
0.9
Crompton Greaves
Neutral
72
-
4,491
13,484
14,687
4.9
6.2
4.5
7.1
15.9
10.1
1.1
1.1
7.2
10.8
0.5
0.4
Greaves Cotton
Neutral
137
-
3,355
1,655
1,755
16.6
16.8
7.4
7.8
18.6
17.6
3.7
3.5
21.1
20.6
2.0
1.9
Inox Wind
Buy
218
286
4,846
4,406
5,605
15.5
15.7
20.4
24.8
10.7
8.8
2.5
1.8
27.9
25.9
1.3
1.0
KEC International
Neutral
136
-
3,485
8,791
9,716
6.1
6.8
5.4
8.2
25.1
16.5
2.5
2.3
10.0
14.0
0.6
0.6
Thermax
Neutral
757
-
9,022
6,413
7,525
7.4
8.5
30.5
39.3
24.8
19.3
3.8
3.3
15.0
17.0
1.4
1.1
VATech Wabag
Neutral
608
-
3,312
2,722
3,336
7.9
8.1
19.5
24.6
31.2
24.7
3.3
2.9
11.1
12.4
1.3
1.1
Cement
ACC
Neutral
1,536
-
28,839
13,151
14,757
16.4
18.3
63.9
83.4
24.0
18.4
3.1
2.8
13.3
16.1
2.0
1.7
Ambuja Cements
Neutral
228
-
35,414
11,564
12,556
19.4
20.7
8.9
10.1
25.6
22.6
3.2
3.0
12.8
13.8
2.7
2.5
HeidelbergCement
Neutral
106
-
2,400
1,772
1,926
13.3
15.4
1.0
3.0
105.9
35.3
2.7
2.5
2.6
7.9
1.9
1.7
India Cements
Neutral
96
-
2,934
4,216
4,840
18.0
19.5
4.0
9.9
23.9
9.7
1.0
0.9
4.0
9.5
1.0
0.8
JK Cement
Neutral
612
-
4,283
3,661
4,742
10.1
15.8
7.5
28.5
81.7
21.5
2.5
2.2
7.5
22.9
1.6
1.2
J K Lakshmi Cement
Neutral
338
-
3,983
2,947
3,616
16.7
19.9
11.5
27.2
29.4
12.4
2.8
2.4
9.8
20.8
1.8
1.4
Mangalam Cements
Neutral
268
-
716
1,053
1,347
10.5
13.3
8.4
26.0
31.9
10.3
1.4
1.2
4.3
12.5
1.1
0.8
Orient Cement
Neutral
167
-
3,416
1,854
2,524
21.2
22.2
7.7
11.1
21.7
15.0
3.1
2.7
13.3
15.7
2.6
1.8
Ramco Cements
Neutral
501
-
11,935
4,036
4,545
20.8
21.3
15.1
18.8
33.2
26.7
4.1
3.6
12.9
14.3
3.5
3.0
Shree Cement^
Neutral
13,617
-
47,436
7,150
8,742
26.7
28.6
228.0
345.5
59.7
39.4
8.8
7.4
15.7
20.3
6.4
5.1
UltraTech Cement
Neutral
3,189
-
87,518
24,669
29,265
18.2
20.6
82.0
120.0
38.9
26.6
4.2
3.7
11.3
14.7
3.6
3.1
Construction
ITNL
Buy
70
93
2,288
7,360
8,682
34.0
32.2
7.0
8.6
9.9
8.1
0.3
0.3
3.2
2.5
3.7
3.5
KNR Constructions
Neutral
580
-
1,632
937
1,470
14.3
14.0
44.2
38.6
13.1
15.0
2.6
2.3
15.4
15.4
1.8
1.2
Larsen & Toubro
Buy
1,461
1,700
136,141
58,870
65,708
8.3
10.3
42.0
53.0
34.8
27.6
2.4
2.2
8.8
11.2
2.5
2.3
Gujarat Pipavav Port
Neutral
158
-
7,660
629
684
51.0
52.2
6.4
5.9
24.8
26.9
3.3
3.0
15.9
12.7
11.8
10.7
MBL Infrastructures
Buy
121
285
502
2,313
2,797
12.2
14.6
19.0
20.0
6.4
6.1
0.7
0.6
11.3
10.6
0.9
0.8
Nagarjuna Const.
Neutral
71
-
3,922
7,892
8,842
8.8
9.1
3.0
5.3
23.5
13.3
1.2
1.1
5.0
8.5
0.7
0.6
PNC Infratech
Neutral
555
-
2,845
1,873
2,288
13.2
13.5
24.0
32.0
23.1
17.3
2.2
2.0
12.1
12.3
1.6
1.3
Simplex Infra
Neutral
270
-
1,337
5,955
6,829
10.3
10.5
16.0
31.0
16.9
8.7
0.9
0.8
5.3
9.9
0.7
0.6
Stock Watch
June 06, 2016
Company Name
Reco
CMP
Target
Mkt Cap
Sales ( Čcr )
OPM(%)
EPS (Č)
PER(x)
P/BV(x)
RoE(%)
EV/Sales(x)
(Č)
Price ( Č)
( Č cr )
FY16E
FY17E
FY16E
FY17E
FY16E
FY17E
FY16E
FY17E
FY16E
FY17E
FY16E
FY17E
FY16E
FY17E
Construction
Power Mech Projects
Neutral
593
-
872
1,539
1,801
12.8
12.7
59.0
72.1
10.1
8.2
1.5
1.3
18.6
16.8
0.6
0.5
Sadbhav Engineering
Accumulate
280
298
4,810
3,186
3,598
10.2
10.3
8.0
9.0
35.1
31.2
3.3
2.9
9.4
9.9
1.8
1.6
NBCC
Accumulate
196
220
11,772
5,838
7,428
6.0
7.9
5.2
8.2
37.7
23.9
1.2
0.9
21.9
28.2
1.8
1.3
MEP Infra
Neutral
37
-
599
1,956
1,876
28.1
30.5
1.3
3.0
28.4
12.3
5.9
4.0
21.2
32.8
1.7
1.7
SIPL
Neutral
97
-
3,399
675
1,042
62.4
64.7
-
-
3.6
4.1
-
-
16.7
11.3
Engineers India
Neutral
192
-
6,476
1,667
1,725
13.5
16.0
9.7
11.4
19.8
16.9
2.3
2.3
11.7
13.4
2.7
2.7
Financials
Allahabad Bank
Neutral
51
-
3,109
8,569
9,392
2.8
2.9
16.3
27.5
3.1
1.8
0.3
0.2
7.6
11.9
-
-
Axis Bank
Neutral
543
-
129,443
26,204
29,738
3.6
3.5
34.5
35.4
15.7
15.3
2.5
2.2
16.8
14.9
-
-
Bank of Baroda
Neutral
140
-
32,304
18,802
21,088
2.0
2.2
(7.4)
13.0
10.8
1.1
0.9
(4.2)
7.3
-
-
Bank of India
Neutral
84
-
7,851
15,972
17,271
1.9
2.0
15.3
33.4
5.5
2.5
0.3
0.2
3.6
7.6
-
-
Canara Bank
Neutral
193
-
10,461
15,441
16,945
2.0
2.1
46.6
70.4
4.1
2.7
0.4
0.3
8.0
11.2
-
-
Dena Bank
Neutral
29
-
1,934
3,440
3,840
2.1
2.3
7.3
10.0
4.0
2.9
0.3
0.3
6.1
7.9
-
-
Dewan Housing Finance Buy
197
270
5,754
1,828
2,225
2.9
3.0
24.9
29.7
7.9
6.7
1.2
1.1
15.1
16.1
-
-
Equitas Holdings
Buy
174
235
5,822
679
1,076
12.4
11.7
6.2
6.7
28.0
25.9
3.5
2.5
13.3
12.5
-
-
Federal Bank
Neutral
51
-
8,779
3,279
3,787
2.8
2.9
3.9
5.5
13.0
9.2
1.1
1.0
8.4
10.8
-
-
HDFC
Neutral
1,256
-
198,349
10,358
11,852
3.3
3.3
41.1
47.0
30.6
26.7
5.8
5.3
24.7
24.9
-
-
HDFC Bank
Accumulate
1,172
1,262
296,452
38,606
47,696
4.4
4.5
48.8
61.4
24.0
19.1
4.1
3.6
18.7
20.0
-
-
ICICI Bank
Neutral
244
-
141,695
34,279
39,262
3.3
3.3
21.0
24.4
11.6
10.0
2.0
1.7
14.4
14.7
-
-
IDBI Bank
Neutral
64
-
13,207
9,625
10,455
1.8
1.8
8.5
14.2
7.5
4.5
0.5
0.4
5.9
9.3
-
-
Indian Bank
Neutral
92
-
4,428
6,160
6,858
2.5
2.5
24.5
29.8
3.8
3.1
0.3
0.3
7.7
8.6
-
-
LIC Housing Finance
Buy
475
592
23,984
3,179
3,758
2.6
2.6
32.9
40.6
14.5
11.7
2.7
2.3
19.6
20.7
-
-
Oriental Bank
Neutral
81
-
2,795
7,643
8,373
2.4
2.4
37.2
45.4
2.2
1.8
0.2
0.2
8.2
9.4
-
-
Punjab Natl.Bank
Neutral
76
-
14,953
23,122
26,022
2.8
2.8
7.0
21.6
10.9
3.5
0.6
0.5
3.4
10.0
-
-
South Ind.Bank
Neutral
19
-
2,566
1,965
2,185
2.5
2.5
2.5
3.3
7.6
5.8
0.8
0.7
9.5
11.7
-
-
St Bk of India
Neutral
197
-
152,539
79,958
86,061
2.6
2.6
13.4
20.7
14.7
9.5
1.2
1.1
11.5
12.8
-
-
Union Bank
Neutral
113
-
7,785
12,646
14,129
2.3
2.4
31.0
39.1
3.7
2.9
0.4
0.3
9.8
11.4
-
-
Vijaya Bank
Neutral
30
-
2,830
3,536
3,827
1.9
1.9
5.5
6.7
5.5
4.6
0.5
0.4
7.8
8.8
-
-
Yes Bank
Neutral
1,049
-
44,155
7,190
9,011
3.2
3.3
58.2
69.7
18.0
15.1
3.2
2.7
19.2
19.6
-
-
FMCG
Asian Paints
Neutral
1,026
-
98,375
15,534
17,445
17.7
16.8
18.4
19.6
55.8
52.3
19.7
18.6
34.6
35.6
6.2
5.5
Stock Watch
June 06, 2016
Company Name
Reco
CMP
Target
Mkt Cap
Sales ( Čcr )
OPM(%)
EPS (Č)
PER(x)
P/BV(x)
RoE(%)
EV/Sales(x)
(Č)
Price ( Č)
( Č cr )
FY16E FY17E
FY16E
FY17E
FY16E
FY17E
FY16E
FY17E
FY16E
FY17E
FY16E
FY17E
FY16E
FY17E
FMCG
Britannia
Neutral
2,763
-
33,146
8,481
9,795
14.0
14.1
65.5
78.3
42.2
35.3
20.0
16.4
38.3
41.2
3.8
3.3
Colgate
Neutral
866
-
23,550
4,136
4,632
22.5
23.3
22.2
25.3
39.0
34.2
23.7
21.1
68.6
67.5
5.6
5.0
Dabur India
Neutral
305
-
53,715
9,370
10,265
17.6
17.3
7.3
8.1
41.6
37.7
10.8
9.9
31.7
30.6
5.6
5.1
GlaxoSmith Con*
Accumulate
5,728
6,118
24,091
4,519
5,142
19.6
19.8
164.3
191.2
34.9
30.0
9.7
8.2
30.8
29.9
4.7
4.1
Godrej Consumer
Neutral
1,568
-
53,380
9,003
10,335
18.1
18.7
34.1
41.8
46.0
37.5
9.9
8.5
23.9
24.8
6.1
5.3
HUL
Neutral
885
-
191,487
33,299
35,497
17.1
17.1
18.9
20.0
46.8
44.2
41.0
35.7
87.6
80.8
5.6
5.2
ITC
Accumulate
355
380
285,354
36,837
39,726
38.8
38.7
12.2
13.5
29.0
26.3
8.1
7.1
27.8
26.9
7.2
6.7
Marico
Neutral
253
-
32,661
6,151
6,966
17.2
17.3
5.4
6.4
46.9
39.6
14.7
11.6
33.2
32.4
5.2
4.6
Nestle*
Neutral
6,279
-
60,543
9,393
10,507
22.2
22.3
106.8
121.8
58.8
51.6
20.7
18.6
34.8
36.7
6.2
5.6
Tata Global
Accumulate
120
137
7,586
8,635
9,072
9.8
9.9
5.8
7.2
20.7
16.7
1.8
1.8
6.8
7.4
0.9
0.9
Procter & Gamble
Buy
6,240
7,369
20,256
2,588
2,939
23.3
23.2
130.2
146.2
47.9
42.7
95.6
91.6
27.6
25.3
7.4
6.4
Hygiene
IT
HCL Tech^
Buy
722
1,000
101,821
37,061
30,781
21.5
20.5
51.4
40.0
14.0
18.1
3.6
2.6
20.1
20.3
2.5
2.7
Infosys
Accumulate
1,266
1,374
290,897
62,441
70,558
27.5
27.5
59.0
65.3
21.5
19.4
4.3
3.9
22.2
22.4
4.1
3.5
TCS
Accumulate
2,631
3,004
518,390
108,646
122,770
28.3
28.3
123.7
141.0
21.3
18.7
7.0
6.5
33.1
34.6
4.3
3.7
Tech Mahindra
Buy
550
700
53,332
26,494
30,347
16.3
17.0
32.2
37.5
17.1
14.7
3.7
3.2
21.7
21.8
1.8
1.5
Wipro
Buy
541
680
133,678
50,808
56,189
23.7
23.8
37.3
40.7
14.5
13.3
2.8
2.5
19.2
17.7
2.1
1.7
Media
D B Corp
Neutral
374
-
6,870
2,025
2,187
27.4
27.4
17.4
18.9
21.5
19.8
4.8
4.4
22.9
23.7
3.4
3.1
HT Media
Neutral
81
-
1,881
2,495
2,673
12.9
13.2
6.8
7.2
11.9
11.2
0.9
0.9
7.5
7.8
0.3
0.3
Jagran Prakashan
Buy
170
205
5,571
2,107
2,355
33.5
28.0
10.1
10.8
17.0
15.8
4.0
3.4
23.3
21.7
2.7
2.4
Sun TV Network
Neutral
363
-
14,317
2,510
2,763
71.8
71.5
21.9
24.8
16.6
14.7
3.9
3.6
22.8
24.3
5.2
4.7
Hindustan Media
Neutral
271
-
1,988
914
1,016
21.7
21.5
21.9
23.3
12.4
11.7
2.2
1.9
18.0
16.2
1.6
1.4
Ventures
Metals & Mining
Coal India
Buy
309
380
195,144
76,167
84,130
19.9
22.3
22.4
25.8
13.8
12.0
5.0
4.8
35.5
41.0
1.9
1.7
Hind. Zinc
Neutral
168
-
70,985
14,641
14,026
50.4
50.4
17.7
16.0
9.5
10.5
1.5
1.3
16.2
13.2
2.5
2.3
Hindalco
Neutral
105
-
21,775
104,356
111,186
8.7
9.5
6.7
11.1
15.7
9.5
0.6
0.5
3.5
5.9
0.7
0.7
JSW Steel
Neutral
1,370
-
33,126
42,308
45,147
16.4
20.7
(10.3)
49.5
27.7
1.5
1.5
(1.0)
5.6
1.8
1.7
NMDC
Neutral
90
-
35,702
8,237
10,893
46.6
44.5
10.0
11.7
9.1
7.7
1.0
0.9
12.5
13.0
4.1
3.1
SAIL
Neutral
42
-
17,202
45,915
53,954
7.2
10.5
1.5
4.4
27.7
9.5
0.4
0.4
2.3
4.1
1.0
0.9
Vedanta
Neutral
105
-
31,026
71,445
81,910
26.2
26.3
12.9
19.2
8.1
5.5
0.6
0.5
7.2
8.9
0.9
0.7
Tata Steel
Neutral
339
-
32,890
126,760
137,307
8.9
11.3
6.4
23.1
53.2
14.7
1.1
1.0
2.0
7.1
0.8
0.8
Stock Watch
June 06, 2016
Company Name
Reco
CMP
Target
Mkt Cap
Sales ( Čcr )
OPM(%)
EPS (Č)
PER(x)
P/BV(x)
RoE(%)
EV/Sales(x)
(Č)
Price ( Č)
( Č cr )
FY16E FY17E
FY16E
FY17E
FY16E
FY17E
FY16E
FY17E
FY16E
FY17E
FY16E
FY17E
FY16E
FY17E
Oil & Gas
Cairn India
Neutral
142
-
26,604
11,323
12,490
49.4
51.0
20.7
20.7
6.9
6.9
0.4
0.4
6.4
6.1
1.4
0.8
GAIL
Neutral
370
-
46,946
64,856
70,933
9.1
9.6
24.0
28.9
15.5
12.8
1.3
1.2
8.8
9.6
0.9
0.8
ONGC
Neutral
212
-
181,291
154,564
145,998
36.8
37.4
20.8
22.6
10.2
9.4
1.0
0.9
10.1
9.7
1.4
1.5
Petronet LNG
Neutral
270
-
20,213
29,691
31,188
5.8
6.2
12.8
13.4
21.1
20.1
3.1
2.8
15.8
14.8
0.8
0.7
Indian Oil Corp
Accumulate
424
455
102,945
359,607
402,760
5.9
6.1
42.5
48.7
10.0
8.7
1.3
1.2
14.1
14.4
0.4
0.3
Reliance Industries
Buy
958
1,150
310,499
304,775
344,392
12.6
13.4
91.3
102.6
10.5
9.3
1.2
1.1
11.8
12.0
0.9
0.8
Pharmaceuticals
Alembic Pharma
Neutral
555
-
10,467
3,274
3,802
26.9
19.4
35.0
28.7
15.9
19.4
7.0
5.3
55.6
31.2
3.2
2.7
Aurobindo Pharma
Accumulate
789
856
46,190
14,923
17,162
22.0
23.0
35.7
42.8
22.1
18.4
6.5
4.9
34.0
30.2
3.5
3.0
Aventis*
Accumulate
4,302
4,738
9,908
2,049
2,375
15.4
17.3
115.4
153.5
37.3
28.0
6.1
4.8
19.3
25.8
4.6
3.9
Cadila Healthcare
Buy
320
400
32,729
9,469
11,246
21.2
22.0
14.9
17.1
21.5
18.7
6.1
4.8
28.8
26.6
3.4
2.9
Cipla
Buy
465
605
37,365
13,979
16,447
20.2
18.6
25.7
27.5
18.1
16.9
3.0
2.5
17.6
16.1
2.7
2.2
Dr Reddy's
Accumulate
3,159
3,476
53,881
15,471
17,479
24.6
24.6
138.2
152.4
22.9
20.7
4.2
3.6
19.7
18.7
3.4
3.0
Dishman Pharma
Neutral
153
-
2,469
1,733
1,906
21.5
21.5
10.1
10.0
15.2
15.3
1.8
1.6
10.5
11.2
1.9
1.7
GSK Pharma*
Neutral
3,526
-
29,865
2,870
3,158
20.0
22.1
59.5
68.3
59.3
51.6
17.5
18.0
28.5
34.3
9.9
9.1
Indoco Remedies
Neutral
287
-
2,645
1,033
1,199
15.9
18.2
9.4
13.6
30.5
21.1
4.5
3.9
15.7
19.7
2.6
2.3
Ipca labs
Buy
417
750
5,263
3,363
3,909
12.9
18.6
13.4
28.0
31.1
14.9
2.2
2.0
7.4
14.0
1.9
1.6
Lupin
Buy
1,449
1,809
65,308
13,702
15,912
23.7
26.4
50.5
58.1
28.7
24.9
5.9
4.9
22.9
21.4
5.2
4.2
Sun Pharma
Buy
738
950
177,674
28,163
32,610
25.8
30.7
17.4
26.9
42.4
27.4
4.0
3.5
13.0
16.6
5.8
4.8
Power
Tata Power
Neutral
74
-
19,987
35,923
37,402
22.6
22.8
4.1
5.2
18.2
14.4
1.4
1.3
7.5
9.3
1.5
1.4
NTPC
Neutral
148
-
121,868
87,271
99,297
23.5
23.5
11.8
13.3
12.6
11.1
1.4
1.3
11.5
12.2
2.4
2.2
Power Grid
Accumulate
150
170
78,657
20,702
23,361
86.7
86.4
12.1
13.2
12.4
11.4
1.8
1.6
15.6
15.1
8.7
8.1
Real Estate
MLIFE
Buy
437
554
1,792
826
1,011
20.1
21.9
22.7
30.7
19.2
14.2
1.2
1.1
6.0
7.4
4.1
3.1
Telecom
Bharti Airtel
Neutral
358
-
143,187
101,748
109,191
32.1
31.7
12.0
12.5
29.9
28.7
2.1
1.9
6.9
6.7
2.0
1.9
Idea Cellular
Neutral
107
-
38,364
34,282
36,941
32.0
31.5
5.9
6.2
18.1
17.2
1.7
1.5
9.9
9.3
1.7
1.6
zOthers
Abbott India
Neutral
4,540
-
9,648
2,715
3,153
14.5
14.1
134.3
152.2
33.8
29.8
8.4
7.0
27.4
25.6
3.3
2.8
Bajaj Electricals
Buy
222
268
2,243
4,612
5,351
5.6
5.7
9.5
12.4
23.5
18.0
5.2
4.6
23.7
25.9
0.5
0.4
Finolex Cables
Neutral
348
-
5,327
2,520
2,883
12.2
12.0
12.7
14.2
27.5
24.5
3.7
3.3
13.6
13.5
1.9
1.6
Goodyear India*
Accumulate
509
582
1,174
1,800
1,600
11.7
11.5
58.7
52.9
8.7
9.6
1.9
1.7
24.6
18.7
0.4
0.4
Hitachi
Neutral
1,274
-
3,464
1,779
2,081
7.8
8.8
21.8
33.4
58.4
38.1
9.4
7.6
17.4
22.1
2.0
1.7
Stock Watch
June 06, 2016
Company Name
Reco
CMP
Target
Mkt Cap
Sales ( Čcr )
OPM(%)
EPS (Č)
PER(x)
P/BV(x)
RoE(%)
EV/Sales(x)
(Č)
Price ( Č)
( Č cr )
FY16E
FY17E
FY16E
FY17E
FY16E
FY17E
FY16E
FY17E
FY16E
FY17E
FY16E
FY17E
FY16E
FY17E
zOthers
Jyothy Laboratories
Neutral
292
-
5,296
1,620
1,847
11.5
11.5
7.3
8.5
40.1
34.5
5.2
4.8
13.3
14.4
3.1
2.7
MRF
Buy
33,414
45,575
14,171
20,316
14,488
21.4
21.1
5,488.0
3,798.0
6.1
8.8
2.1
1.7
41.1
21.2
0.6
0.9
Page Industries
Neutral
14,099
-
15,726
1,929
2,450
19.8
20.1
229.9
299.0
61.3
47.2
27.1
18.8
52.1
47.1
8.2
6.4
Relaxo Footwears
Neutral
437
-
5,249
1,767
2,152
12.3
12.5
19.3
25.1
22.7
17.5
5.6
4.3
27.7
27.8
3.0
2.5
Siyaram Silk Mills
Buy
1,025
1,347
961
1,619
1,799
11.6
11.6
93.5
104.9
11.0
9.8
1.9
1.6
17.1
16.4
0.8
0.8
Styrolution ABS India* Neutral
602
-
1,058
1,271
1,440
8.6
9.2
32.0
41.1
18.8
14.7
1.9
1.7
10.7
12.4
0.8
0.7
TVS Srichakra
Buy
2,315
2,932
1,773
2,035
2,252
15.9
15.3
248.6
268.1
9.3
8.6
4.1
2.9
43.6
33.9
0.9
0.8
HSIL
Accumulate
270
310
1,951
2,123
2,384
16.1
16.5
15.0
18.9
17.9
14.3
1.4
1.3
8.0
9.4
1.3
1.1
Kirloskar Engines India
Neutral
254
-
3,674
2,403
2,554
8.6
9.9
9.2
10.5
27.7
24.2
2.7
2.5
9.7
10.7
1.2
1.1
Ltd
M M Forgings
Buy
444
546
536
511
615
21.7
21.6
43.1
55.8
10.3
8.0
1.9
1.5
19.9
21.2
1.3
1.0
Banco Products (India) Neutral
139
-
991
1,208
1,353
11.0
12.3
10.8
14.5
12.9
9.6
1.5
1.3
11.9
14.5
0.8
0.7
Competent Automobiles Neutral
139
-
86
1,040
1,137
3.2
3.1
25.7
28.0
5.4
5.0
0.8
0.7
15.0
14.3
0.1
0.1
Nilkamal
Neutral
1,204
-
1,797
1,871
2,031
10.7
10.5
63.2
69.8
19.1
17.3
3.1
2.7
17.6
16.6
1.0
0.9
Visaka Industries
Buy
138
162
219
1,020
1,120
8.7
9.1
13.9
20.1
9.9
6.8
0.6
0.6
6.4
8.7
0.4
0.4
Transport Corporation of
Neutral
302
-
2,298
2,830
3,350
8.8
9.0
14.4
18.3
21.0
16.5
3.2
2.8
15.4
17.1
0.9
0.8
India
Elecon Engineering
Neutral
58
-
632
1,359
1,482
10.3
13.7
0.8
3.9
72.3
14.9
1.2
1.1
1.6
7.8
0.8
0.7
Surya Roshni
Buy
155
201
681
2,992
3,223
8.1
8.4
14.7
18.3
10.6
8.5
1.0
0.9
9.7
11.0
0.5
0.5
MT Educare
Neutral
179
-
712
286
366
18.3
17.7
7.7
9.4
23.1
19.1
4.9
4.3
20.2
21.1
2.4
1.8
Radico Khaitan
Buy
89
125
1,181
1,543
1,659
12.6
13.0
5.8
6.3
15.4
14.0
1.3
1.2
8.5
8.6
1.3
1.2
Garware Wall Ropes
Buy
358
460
783
828
898
11.2
10.3
28.3
29.0
12.7
12.3
2.1
1.8
16.8
14.9
0.9
0.8
Wonderla Holidays
Neutral
384
-
2,169
206
308
44.0
43.6
9.0
12.9
42.7
29.8
5.8
5.3
13.7
17.8
10.4
6.9
Linc Pen & Plastics
Accumulate
205
235
304
344
382
9.1
9.1
12.4
13.1
16.6
15.7
3.0
2.6
18.0
16.7
1.0
0.9
The Byke Hospitality
Neutral
170
-
681
222
287
20.5
20.5
5.6
7.6
30.1
22.5
5.7
4.7
18.9
20.8
3.1
2.4
Interglobe Aviation
Neutral
993
-
35,773
17,022
21,122
20.7
14.5
63.9
53.7
15.5
18.5
23.3
19.1
149.9
103.2
2.1
1.7
Coffee Day Enterprises
Neutral
256
-
5,283
2,692
2,964
17.0
18.6
-
4.7
-
54.1
3.1
3.0
0.2
5.5
2.4
2.2
Ltd
Navneet Education
Neutral
86
-
2,046
998
1,062
24.1
24.0
5.8
6.1
14.9
14.1
3.3
2.9
22.0
20.6
2.1
2.0
Navkar Corporation
Buy
200
265
2,847
347
408
43.2
42.9
6.7
6.8
29.9
29.5
2.2
2.0
7.3
6.9
8.7
7.9
UFO Moviez
Neutral
534
-
1,473
558
619
32.0
33.2
22.5
30.0
23.7
17.8
2.9
2.5
12.0
13.8
2.5
2.1
VRL Logistics
Neutral
276
-
2,519
1,725
1,902
16.5
16.7
12.2
14.6
22.7
19.0
4.7
4.2
20.8
21.9
1.6
1.4
Stock Watch
June 06, 2016
Company Name
Reco
CMP
Target Mkt Cap
Sales ( Čcr )
OPM(%)
EPS (Č)
PER(x)
P/BV(x)
RoE(%)
EV/Sales(x)
(Č)
Price ( Č)
( Č cr )
FY16E FY17E FY16E FY17E FY16E FY17E FY16E FY17E FY16E FY17E FY16E FY17E FY16E FY17E
zOthers
Team Lease Serv.
Neutral
912
-
1,559
2,565
3,229
1.3
1.5
15.2
22.8
60.1
40.0
4.8
4.3
8.0
10.7
0.5
0.4
S H Kelkar & Co.
Neutral
211
-
3,052
928
1,036
15.3
15.1
4.9
6.1
42.8
34.6
4.0
3.7
9.4
10.7
3.2
2.8
Quick Heal
Neutral
239
-
1,674
339
408
27.8
27.3
7.1
7.7
33.8
30.9
2.9
2.9
8.5
9.3
3.8
3.2
Narayana Hrudaya
Neutral
310
-
6,337
1,603
1,873
10.9
11.5
1.0
2.6
325.5
117.2
7.8
7.2
2.4
6.1
4.1
3.5
Manpasand Bever.
Neutral
545
-
2,729
540
836
19.9
19.6
10.2
16.9
53.2
32.3
4.3
3.9
8.1
12.0
4.7
3.0
Source: Company, Angel Research; Note: *December year end; #September year end; &October year end; Price as on June 03, 2016
Market Outlook
June 06, 2016
Research Team Tel: 022 - 39357800
DISCLAIMER
Angel Broking Private Limited (hereinafter referred to as “Angel”) is a registered Member of National Stock Exchange of India Limited,
Bombay Stock Exchange Limited and Metropolitian Stock Exchange of India Limited. It is also registered as a Depository Participant with
CDSL and Portfolio Manager with SEBI. It also has registration with AMFI as a Mutual Fund Distributor. Angel Broking Private Limited is a
registered entity with SEBI for Research Analyst in terms of SEBI (Research Analyst) Regulations, 2014 vide registration number
INH000000164. Angel or its associates has not been debarred/ suspended by SEBI or any other regulatory authority for accessing
/dealing in securities Market. Angel or its associates including its relatives/analyst do not hold any financial interest/beneficial ownership
of more than 1% in the company covered by Analyst. Angel or its associates/analyst has not received any compensation / managed or co
-managed public offering of securities of the company covered by Analyst during the past twelve months. Angel/analyst has not served as
an officer, director or employee of company covered by Analyst and has not been engaged in market making activity of the company
covered by Analyst.
This document is solely for the personal information of the recipient, and must not be singularly used as the basis of any investment
decision. Nothing in this document should be construed as investment or financial advice. Each recipient of this document should make
such investigations as they deem necessary to arrive at an independent evaluation of an investment in the securities of the companies
referred to in this document (including the merits and risks involved), and should consult their own advisors to determine the merits and
risks of such an investment.
Reports based on technical and derivative analysis center on studying charts of a stock's price movement, outstanding positions and
trading volume, as opposed to focusing on a company's fundamentals and, as such, may not match with a report on a company's
fundamentals.
The information in this document has been printed on the basis of publicly available information, internal data and other reliable sources
believed to be true, but we do not represent that it is accurate or complete and it should not be relied on as such, as this document is for
general guidance only. Angel Broking Pvt. Limited or any of its affiliates/ group companies shall not be in any way responsible for any
loss or damage that may arise to any person from any inadvertent error in the information contained in this report. Angel Broking Pvt.
Limited has not independently verified all the information contained within this document. Accordingly, we cannot testify, nor make any
representation or warranty, express or implied, to the accuracy, contents or data contained within this document. While Angel Broking
Pvt. Limited endeavors to update on a reasonable basis the information discussed in this material, there may be regulatory, compliance,
or other reasons that prevent us from doing so.
This document is being supplied to you solely for your information, and its contents, information or data may not be reproduced,
redistributed or passed on, directly or indirectly.
Neither Angel Broking Pvt. Limited, nor its directors, employees or affiliates shall be liable for any loss or damage that may arise from or
in connection with the use of this information.
Note: Please refer to the important ‘Stock Holding Disclosure' report on the Angel website (Research Section). Also, please refer to the
latest update on respective stocks for the disclosure status in respect of those stocks. Angel Broking Pvt. Limited and its affiliates may have
investment positions in the stocks recommended in this report.