Market Outlook
November 5, 2015
Market Cues
Domestic Indices
Chg (%)
(Pts)
(Close)
Indian markets are expected to open flat tracking SGX Nifty.
BSE Sensex
(0.1)
(38)
26,553
U.S. stocks ended the Wednesday’s session slightly lower, taking a pause after two
Nifty
(0.3)
(21)
8,040
straight days of gains. Main indexes retreated as Fed Chairwoman Yellen hinted that
Mid Cap
0.2
21
11,034
a 25bp rate hike in December would not derail the economy or housing market.
Small Cap
(0.3)
(37)
11,299
Notably, Energy and Consumer Discretionary were the biggest decliners.
Bankex
(0.5)
(95)
19,663
European stock markets rallied on Wednesday after ECB President Mario Draghi
reiterated that bank is ready to provide more stimulus in December if required.
Global Indices
Chg (%)
(Pts)
(Close)
These gains trimmed after Janet Yellen hinted at rate hike possibility in Dec-2015.
For FTSE 100, Glencore was the biggest gainer of the day as it reported significant
Dow Jones
(0.3)
(51)
17,867
progress on its plans to cut down the net debt by FY2016-end.
Nasdaq
(0.1)
(3)
5,142
Indian markets lost the previous day's gains on Wednesday’s trading session as
FTSE
0.5
29
6,413
benchmark indices fell marginally, despite the positive global cues. Indices started
Nikkei
1.3
244
18,927
on a strong note, with Nifty trading above 8100-mark, but could not sustain gains in
Hang Seng
2.2
485
23,054
the afternoon trade as profit booking was seen across heavyweight stocks. Private
Shanghai Com
4.3
143
3,460
sector bank, healthcare, technology and select oil stocks pulled the market lower.
News & Result Analysis
Advances / Declines
BSE
NSE
Biocodex inks distribution pact with Dr. Reddy’s to market its flagship products in
Advances
1,257
635
Romania
Declines
1,470
855
Result Review: Canara Bank, PNC Infratech, Ashok Leyland
Unchanged
129
95
Result Preview: Cipla
Detailed analysis on Pg2
Volumes (` Cr)
Investor’s Ready Reckoner
BSE
2,780
Key Domestic & Global Indicators
NSE
14,578
Stock Watch: Latest investment recommendations on 150+ stocks
Refer P7 onwards
Net Inflows (` Cr)
Net
Mtd
Ytd
Top Picks
FII
(373)
(380)
(15,199)
CMP
Target
Upside
Company
Sector
Rating
MFs
352
519
50,866
(`)
(`)
(%)
Axis Bank
Financials
Buy
473
630
33.1
HCL Tech
IT
Buy
880
1,132
28.6
Top Gainers
Price (`)
Chg (%)
ICICI Bank
Financials
Buy
273
348
27.2
Jisljaleqs
68
6.6
Ashok Leyland
Automobiles
Buy
92
111
20.5
Tatamotors
405
6.0
Larsen & Toubro
Construction
Buy
1,371
1,646
20.1
Ubl
996
4.6
More Top Picks on Pg5
Denabank
43
4.5
Redington
119
4.2
Key Upcoming Events
Previous
Consensus
Date
Region
Event Description
Reading
Expectations
Top Losers
Price (`)
Chg (%)
Nov 5
GBP
Interest Rate Decision
0.5%
0.5%
Cox&kings
260
(4.9)
Nov 6
US
Unemployment Rate (Oct)
5.1%
5.1%
Adanient
85
(3.5)
Nov 6
GBP
Manufacturing Production (MOM) (Sep)
0.5%
0.4%
Fsl
32
(3.5)
Nov 6
US
Unemployment Rate (Oct)
5.1%
5.1%
Ceatltd
1,068
(3.3)
Vakrangee
122
(3.3)
As on November 04, 2015
Market Outlook
November 5, 2015
Biocodex inks distribution pact with Dr. Reddy’s to market
its flagship products in Romania
Dr. Reddy’s Laboratories has entered into a strategic alliance with Biocodex to
market and distribute Biocodex products in the Romanian market. Biocodex has
announced the change in partnership and effective October 1, 2015, Dr. Reddy’s
has been given the complete rights for promotion and distribution of the Biocodex
products across Romania. Earlier, AKACIA was in partnership with Biocodex for
similar distribution pact. With this new collaboration coming into existence, Dr.
Reddy’s will aim to develop the access of the Romanian patients to the Rx portfolio
including Biocodex’s well-known OTC products ENTEROL and OTIPAX. We
maintain our neutral stance on the stock.
Result Review
Canara Bank (CMP: `274 / TP: / Upside: )
Canara Bank reported 2QFY16 results, with de-growth in PAT by 15.6% yoy.
Advances growth was lower than the system growth at 3.9% yoy, however bank
registered NII growth of 11.8% yoy. Other income growth of 18.5% yoy led to
13.8% growth in operating income. PBT de-grew by 9.9% yoy due to steep rise in
provisions by 49% yoy. On the asset quality front, the asset quality deteriorated
with an increase of 29bp and 16bp respectively in the Gross and Net NPA ratio
respectively. On an absolute basis, the closing gross and net NPA increased by
7.2% and 5.6% qoq respectively. At CMP, the stock is trading at 0.4x2017E P/ABV.
We maintain our NEUTRAL rating on the stock.
Y/E
Op. Inc
NIM
PAT
EPS ABV ROA ROE
P/E P/ABV
March
(` cr)
(%)
(` cr)
(`)
(`)
(%)
(%)
(x)
(x)
FY2016E
15,251
2.0
2,819
59.3
545.7
0.5
10.1
4.7
0.5
FY2017E
16,725
2.0
3,259
68.6
622.6
0.5
10.7
4.0
0.4
PNC Infratech (CMP: `527 / TP: / Upside: )
PNC Infratech (PNC) has reported a strong set of numbers for 2QFY2016. The
performance was mainly driven by strong execution of captive BOT as well as
other EPC road projects, which in our view, contributed to the strong 45.1% yoy
increase in top-line to `463cr (ahead of our expectation of `378cr). The strong
execution led the company to report a strong EBITDA of `54cr. The EBITDA margin
declined by 50bp yoy to 11.7%, which we believe, could be due to higher
dependency on sub-contracting, during the quarter. On the same lines, lower
interest expenses helped the company to report a strong quarterly PAT of `30cr,
which is again ahead of our estimates. The Reported PAT margin for the quarter
stood at 6.6%, which is flat on a yoy basis.
Our estimation suggests PNC having drawn order inflows of `1,743cr year till
date, which is ahead of FY2015’s order inflows of `1,618cr. We estimate PNC to
be sitting on an order book of `3,648cr (order book to LTM sales ratio at 2.2x).
On the back of order book growth, we expect earnings to gain further traction
going forward. Strong earnings performance has led us to revise our estimates
upwards. After a more detailed analysis of PNC’s 2QFY2016 performance, we
Market Outlook
November 5, 2015
would likely raise our price target on the stock. We maintain our positive view on
the stock.
Y/E
Sales OPM PAT EPS ROE P/E P/BV
EV/EBITDA EV/Sales
March
(` cr)
(%)
(` cr)
(`)
(%)
(x)
(x)
(x)
(x)
FY2016E
1,798
13.2
114
22.2
11.5
23.7
2.1
12.1
1.6
FY2017E
2,132
13.5
153
29.8
11.4
17.7
1.9
10.0
1.4
Ashok Leyland (CMP: `92/ TP: `111 /Upside: 21%)
Ashok Leyland 2QFY16 results were below estimates on back of lower than
expected topline and higher depreciation charge. Revenues grew 54% yoy to
`4,940cr coming lower than our estimates of `5,281cr. Volume growth has been
robust at 51% driven by a 64% growth in the MHCV space. However blended
realization/vehicle grew
2% yoy to
`14.08 lakh coming lower than our
expectations of `15 lakh possibly due to slightly unfavorable product mix. EBIDTA
margins at 12% improved sharply 490 bp yoy and were at five year highs coming
broadly in line with our estimates of 12.6%. Soft commodity prices and operating
leverage led to sharp margin improvement. However, given the topline miss, the
EBIDTA at `594cr was lower than our estimates of `668cr. Further, higher
depreciation expenses at `113cr also impacted profitability. Net Profit at `287cr
was below our expectations of `355cr. We currently have Buy rating on the stock.
Y/E
Sales OPM
PAT
EPS ROE P/E P/BV EV/EBITDA EV/Sales
March
(` cr)
(%)
(` cr)
(`)
(%)
(x)
(x)
(x)
(x)
FY2016E
18,763
11.1
1,025
3.6
18.7
25.6
4.7
14.4
1.4
FY2017E
22,357
11.2
1,366
4.8
22.6
19.2
4.3
11.4
1.1
Result Preview
Cipla (CMP: `671 / TP: /Upside:)
Cipla for 2QFY2016 is expected to post a robust set of numbers. On sales the
company is expected to post sales of `3,343cr V/s `2,630cr, yoy growth of 27.1%.
The growth on the topline is expected to come through a
11.7% yoy growth in
domestic formulation market, while exports are likely to post sales of `1,946cr V/s
`1,379cr, a yoy growth of 41.1%, mainly driven by formulation exports( on back
of generic nexium). On the EBIDTA front, the margins are expected to come in at
19.7% V/s 16.0% in 2QFY2015. Thus, the Net Profit is expected to come in at
`458cr V/s `299cr, a yoy 53.3%. We currently have a neutral rating on the stock.
Y/E
Sales OPM
PAT
EPS ROE P/E P/BV EV/EBITDA EV/Sales
March
(` cr)
(%)
(` cr)
(`)
(%)
(x)
(x)
(x)
(x)
FY2016E
14,359
21.3
2,283
28.4
19.3
23.1
4.1
17.2
3.7
FY2017E
16,884
19.7
2,449
30.5
17.5
21.5
3.5
15.5
3.0
Market Outlook
November 5, 2015
Economic and Political News
Bankruptcy law: panel proposes 180-day limit to deal with insolvency
Mumbai’s Coastal road project to get Centre’s nod
Government considering anti-dumping duty on dry cell batteries
Corporate News
DGCA issues notification on User Development Fee at Hyderabad Airport
CARE ratings signs pact with GREX to grade start-ups
Cairn-Vedanta merger now by June 2016, says group firm
Market Outlook
November 5, 2015
Top Picks ★★★★★
Large Cap
Market Cap
CMP
Target
Upside
Company
Rationale
(` Cr)
(`)
(`)
(%)
To outpace battery industry growth due to better technological
Amara Raja Batteries
15,175
888
1,040
17.1
products leading to market share gains in both the automotive
OEM and replacement segments.
Earnings to grow strongly given the MHCV cyclical upturn.
Ashok Leyland
26,225
92
111
20.5
Focus on exports and LCV's provides additional growth
avenue.
Healthy pace of branch expansion, backed by distribution
Axis Bank
112,532
473
630
33.1
network, will be the driving force for the bank’s retail business
and overall earnings.
The stock is trading at attractive valuations and is factoring all
HCL Tech
123,789
880
1,132
28.6
the bad news.
Strong visibility for a robust 20% earnings trajectory, coupled
HDFC Bank
272,557
1,082
1,262
16.6
with high quality of earnings on account of high quality retail
business and strategic focus on highly rated corporates.
Due to its robust franchise and capital adequacy position, the
bank is well positioned to grow by at least a few percentage
ICICI Bank
158,782
273
348
27.2
points higher than the average industry growth rate from a
structural point of view.
Back on the growth trend, expect a long term growth of 14% to
Infosys
261,174
1,137
1,306
14.9
be a US$20bn in FY2020.
Well positioned to benefit from such expected gradual recovery
in the overall domestic capex cycle, given its presence across
Larsen & Toubro
127,547
1,371
1,646
20.1
various infrastructure segments, its execution capabilities, and
its strong balance sheet.
LICHF continues to grow its retail loan book at a healthy pace
with improvement in asset quality. We expect the company to
LIC Housing Finance
24,284
481
571
18.6
post a healthy loan book which is likely to reflect in a strong
earnings growth.
Source: Company, Angel Research
Mid Cap
Market Cap
CMP
Target
Upside
Company
Rationale
(` Cr)
(`)
(`)
(%)
Government thrust on Renewable sector and strong order
Inox Wind
8,624
389
505
30.0
book would drive future growth.
Change in business focus towards high-margin chronic and
Ipca labs
9,448
749
900
20.2
lifestyle segments and increasing penetration in Europe and
US
Economic recovery to have favourable impact on advertising &
circulation revenue growth. Further, the acquisition of a radio
Jagran Prakashan
4,776
146
169
15.7
business (Radio City) would also boost the company's revenue
growth.
Strong brand & quality teaching with innovative technologies
MT Educare
554
139
169
21.6
& higher government educational spending to boost growth
Earnings boost on back of stable material prices and
Radico Khaitan
1,441
108
119
9.8
favourable pricing environment. Valuation discount to peers
provides additional comfort
Strong brands and distribution network would boost growth
Siyaram Silk Mills
897
957
1,145
19.8
going ahead. Stock currently trades at an inexpensive
valuation.
Structural shift in the Lighting industry towards LED lighting will
Surya Roshni
584
133
183
37.4
drive growth.
Source: Company, Angel Research
Market Outlook
November 5, 2015
Quarterly Bloomberg Brokers Consensus Estimate
Cipla Ltd - November 5, 2015
Particulars (` cr)
2QFY16E
2QFY15
y-o-y (%)
1QFY16
q-o-q (%)
Net sales
3,526
2,647
33.2
3,777
(6.6)
EBITDA
789
558
41.4
1,039
(24.1)
EBITDA margin (%)
22.4
21.2
27.5
Net profit
488
321
52
657
(31.8)
Cummins India Ltd - November 5, 2015
Particulars (` cr)
2QFY16E
2QFY15
y-o-y (%)
1QFY16
q-o-q (%)
Net sales
1,301
1,117
16.5
1,282
1.5
EBITDA
216
190
13.7
218
(0.9)
EBITDA margin (%)
16.6
17.0
17.0
Net profit
206
202
2.0
210
(1.9)
Tata Global Beverages Ltd (Consol.) - November 5, 2015
Particulars (` cr)
2QFY16E
2QFY15
y-o-y (%)
1QFY16
q-o-q (%)
Net sales
2,123
1,964
8.1
2,004
5.9
EBITDA
216
186
16.1
188
14.9
EBITDA margin (%)
10.2
9.5
9.4
Net profit
110
62
77.4
83
32.5
Tata Steel Ltd (Consol.) - November 5, 2015
Particulars (` cr)
2QFY16E
2QFY15
y-o-y (%)
1QFY16
q-o-q (%)
Net sales
30,033
35,503
(15.4)
29,900
0.4
EBITDA
2,426
3,642
(33.4)
2,774
(12.5)
EBITDA margin (%)
8.1
10.3
9.3
Net profit
(96)
1,254
(107.7)
604
(115.9)
Market Outlook
November 5, 2015
Macro watch
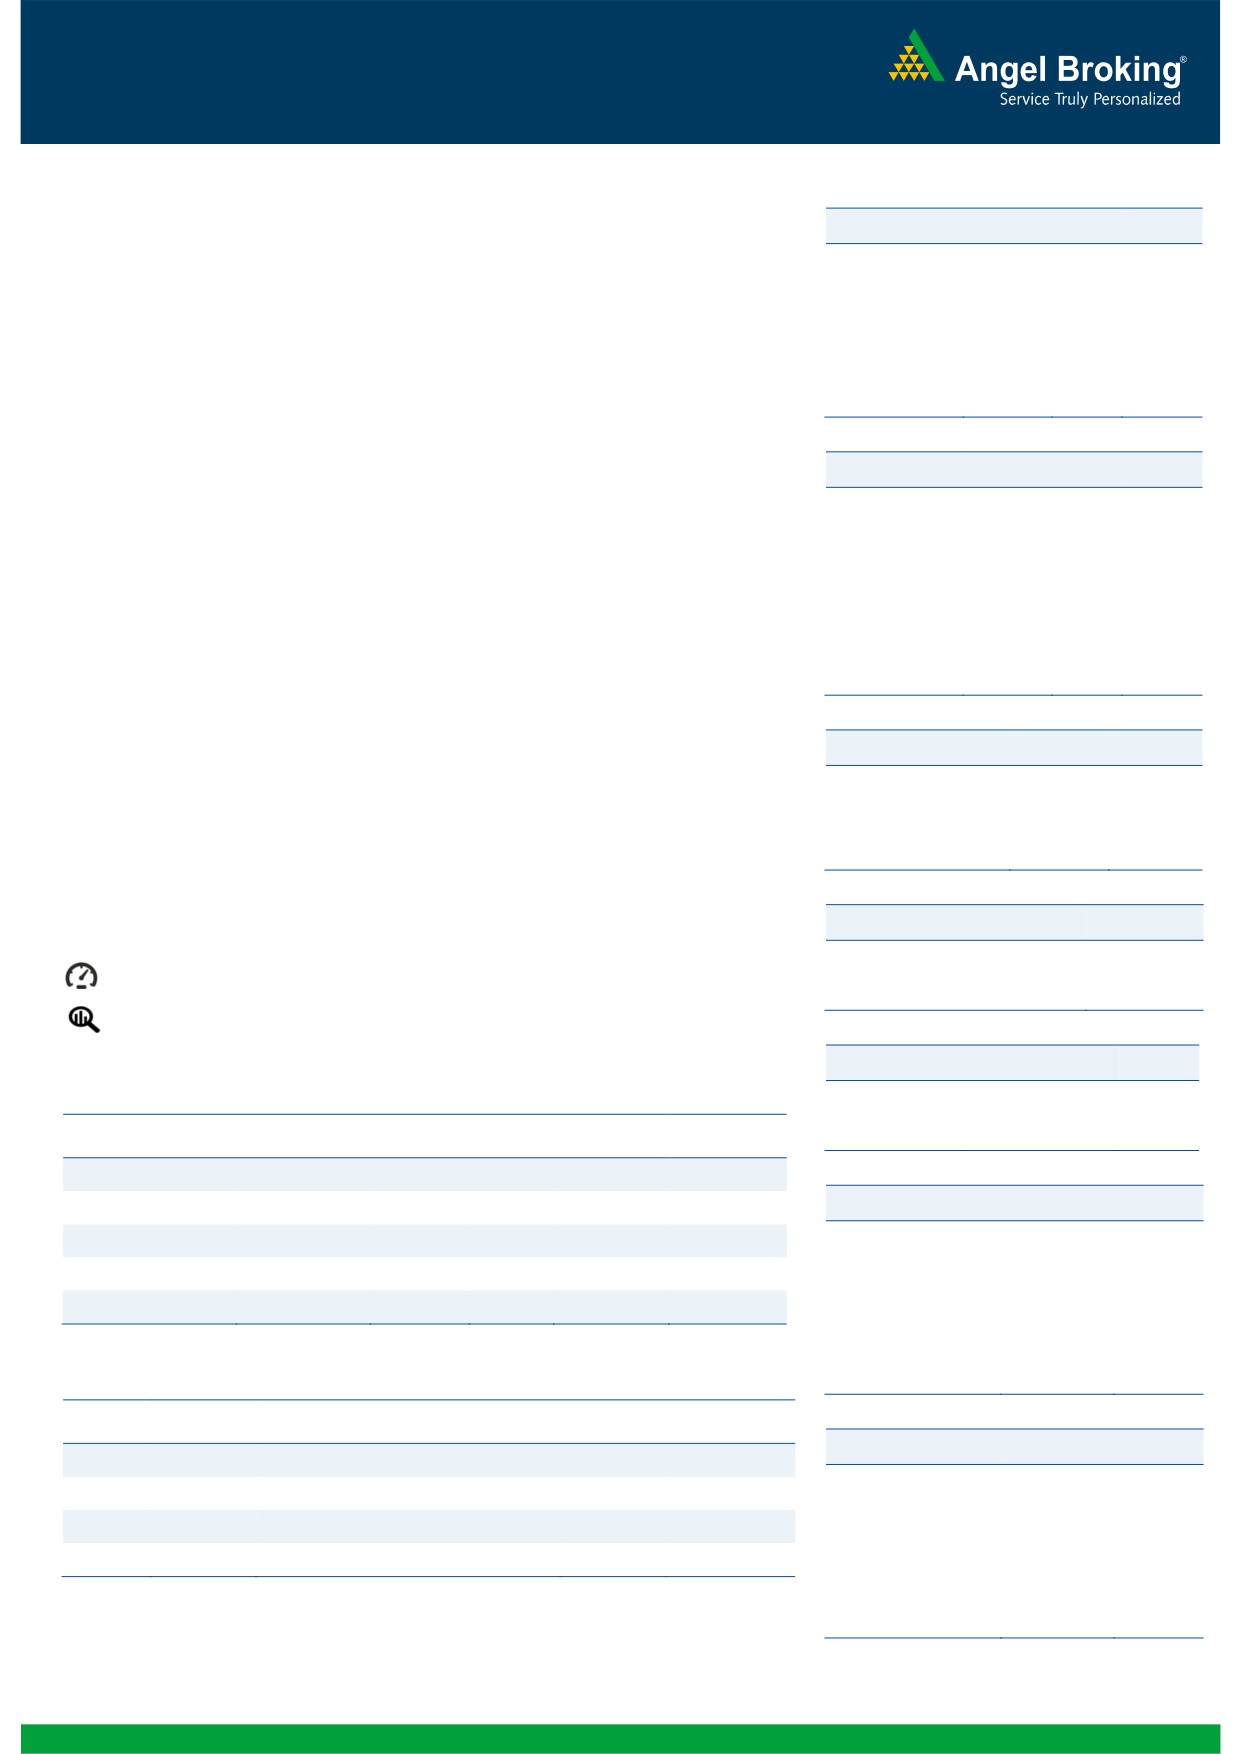
Exhibit 1: Quarterly GDP trends
Exhibit 2: IIP trends
(%)
(%)
9.0
8.4
8.0
6.4
7.5
7.5
5.2
8.0
6.0
4.8
7.0
7.0
4.4
4.1
6.7
6.7
3.6
7.0
6.4
6.6
4.0
2.8
3.0
6.3
2.5
2.5
6.0
2.0
5.0
4.7
5.0
-
4.0
(2.0)
3.0
(4.0)
(2.7)
Source: CSO, Angel Research
Source: MOSPI, Angel Research
Exhibit 3: Monthly CPI inflation trends
Exhibit 4: Manufacturing and services PMI
(%)
56.0
Mfg. PMI
Services PMI
6.0
5.4
5.3
5.4
54.0
5.2
5.0
4.9
4.6
5.0
4.3
4.4
52.0
3.7
3.7
4.0
3.3
50.0
3.0
2.0
48.0
1.0
46.0
-
44.0
Source: Market, Angel Research; Note: Level above 50 indicates expansion
Source: MOSPI, Angel Research
Exhibit 5: Exports and imports growth trends
Exhibit 6: Key policy rates
(%)
Exports yoy growth
Imports yoy growth
(%)
Repo rate
Reverse Repo rate
CRR
30.0
9.00
20.0
8.00
10.0
7.00
0.0
6.00
(10.0)
5.00
(20.0)
4.00
(30.0)
3.00
Source: Bloomberg, Angel Research
Source: RBI, Angel Research
Market Outlook
November 5, 2015
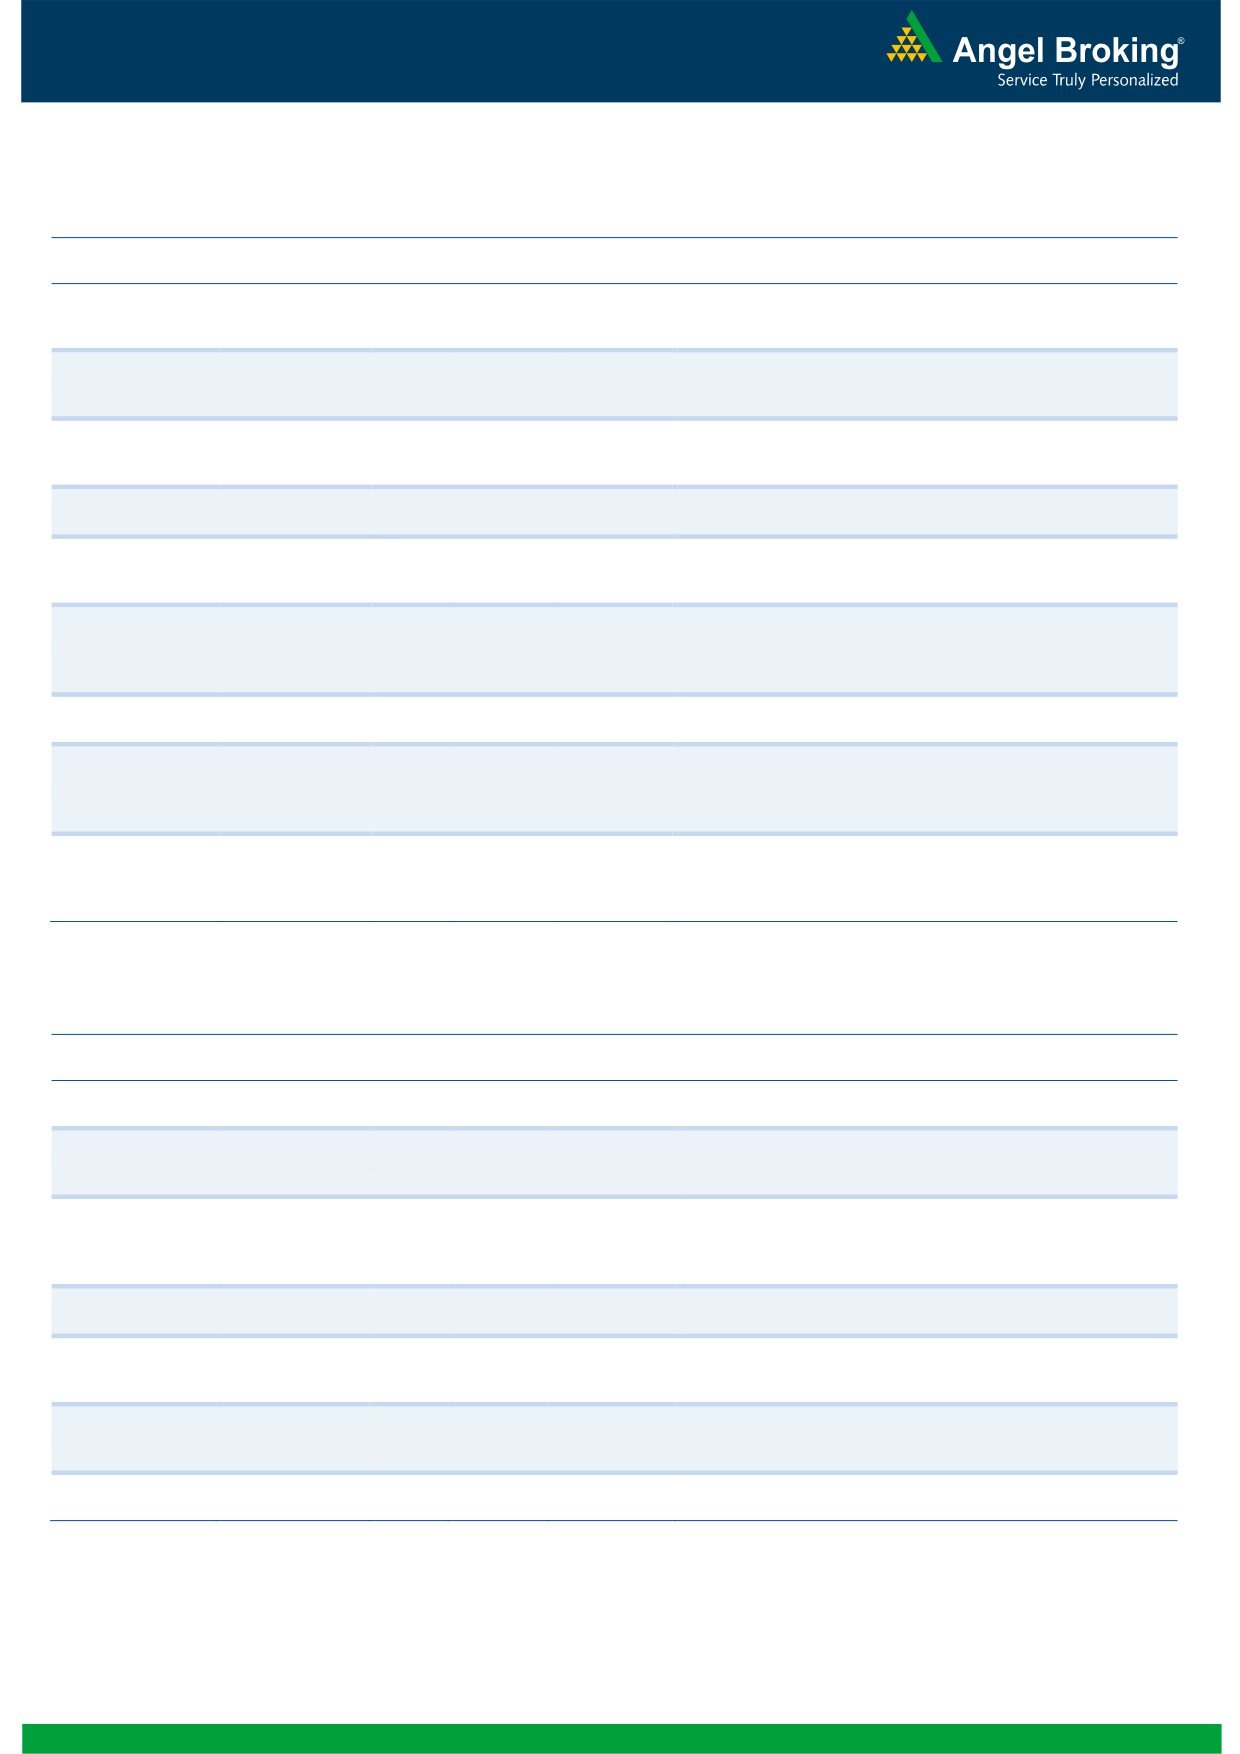
Global watch
Exhibit 1: Latest quarterly GDP Growth (%, yoy) across select developing and developed countries
(%)
8.0
6.9
5.3
6.0
4.9
4.7
4.0
2.8
2.3
2.0
1.6
2.0
1.2
1.1
0.8
(2.6)
-
(2.0)
(4.0)
(4.6)
(6.0)
Source: Bloomberg, Angel Research
Exhibit 2: 2015 GDP Growth projection by IMF (%, yoy) across select developing and developed countries
(%)
10.0
7.5
8.0
6.8
5.2
6.0
4.8
3.7
3.1
4.0
2.7
2.0
1.6
2.0
1.2
1.0
-
(2.0)
(4.0)
(1.0)
(3.8)
(6.0)
Source: IMF, Angel Research
Exhibit 3: One year forward P-E ratio across select developing and developed countries
(x)
20.0
18.0
16.0
14.0
12.0
10.0
8.0
6.0
4.0
2.0
-
Source: IMF, Angel Research
Market Outlook
November 5, 2015
Exhibit 4: Relative performance of indices across globe
Returns (%)
Country
Name of index
Closing price
1M
3M
1YR
Brazil
Bovespa
47,710
1.4
(5.1)
(12.2)
Russia
Micex
1,764
9.4
5.3
18.3
India
Nifty
8,184
1.2
(6.0)
(2.4)
China
Shanghai Composite
3,460
13.3
(4.1)
43.0
South Africa
Top 40
49,081
7.5
3.8
10.4
Mexico
Mexbol
45,373
4.1
1.0
0.7
Indonesia
LQ45
795
8.3
(7.8)
(8.0)
Malaysia
KLCI
1,686
2.3
(2.3)
(8.4)
Thailand
SET 50
921
4.5
(2.9)
(12.3)
USA
Dow Jones
17,868
8.5
1.9
2.8
UK
FTSE
6,413
4.6
(5.0)
(0.6)
Japan
Nikkei
18,927
5.1
(8.1)
11.8
Germany
DAX
10,845
13.5
(6.8)
18.3
France
CAC
4,948
10.9
(4.8)
19.8
Source: Bloomberg, Angel Research
Stock Watch
November 05, 2015
Company Name
Reco
CMP
Target
Mkt Cap
Sales ( Čcr )
OPM(%)
EPS (Č)
PER(x)
P/BV(x)
RoE(%)
EV/Sales(x)
(Č)
Price ( Č)
( Č cr )
FY16E FY17E
FY16E
FY17E
FY16E
FY17E
FY16E
FY17E
FY16E
FY17E
FY16E
FY17E
FY16E
FY17E
Agri / Agri Chemical
Rallis
Neutral
203
-
3,951
2,075
2,394
14.4
14.4
9.5
11.0
21.4
18.5
4.3
3.7
21.1
21.3
1.9
1.7
United Phosphorus
Accumulate
454
510
19,471
13,698
15,752
17.6
17.6
32.1
38.5
14.2
11.8
2.8
2.3
21.4
21.3
1.5
1.3
Auto & Auto Ancillary
Ashok Leyland
Buy
92
111
26,225
18,763
22,357
11.1
11.2
3.6
4.8
25.6
19.2
4.7
4.4
18.7
22.6
1.4
1.1
Bajaj Auto
Accumulate
2,449
2,672
70,859
24,115
27,600
21.3
21.0
136.8
157.2
17.9
15.6
5.8
4.9
32.2
31.5
2.5
2.2
Eicher Motors
Buy
17,805
22,900
48,328
11,809
15,609
15.5
17.0
362.9
567.0
49.1
31.4
14.9
11.1
30.1
35.0
4.0
3.0
Hero Motocorp
Neutral
2,614
-
52,206
28,561
31,559
14.7
14.7
151.1
163.2
17.3
16.0
6.7
5.7
38.7
35.6
1.7
1.5
L G Balakrishnan & Bros Neutral
456
-
716
1,254
1,394
11.6
11.8
35.9
41.7
12.7
11.0
1.7
1.5
13.5
13.8
0.7
0.6
Mahindra and Mahindra Neutral
1,254
-
77,879
37,231
41,710
12.4
12.8
48.8
58.3
25.7
21.5
3.6
3.2
14.0
14.9
1.7
1.5
Maruti
Accumulate
4,515
4,960
136,383
57,865
68,104
16.4
16.7
176.3
225.5
25.6
20.0
5.0
4.2
19.4
21.2
2.1
1.8
Minda Industries
Buy
697
809
1,105
2,567
2,965
8.0
8.3
46.1
57.8
15.1
12.1
2.5
2.1
16.7
17.3
0.5
0.4
Rane Brake Lining
Accumulate
330
366
261
454
511
11.1
11.4
23.8
28.1
13.9
11.8
2.0
1.8
14.2
15.3
0.7
0.6
Setco Automotive
Neutral
217
-
579
594
741
12.7
13.7
8.4
15.8
25.8
13.7
2.7
2.3
10.4
16.9
1.4
1.2
Tata Motors
Neutral
405
-
116,946
264,038
297,882
13.8
13.9
34.5
38.9
11.7
10.4
2.0
1.7
17.6
16.8
0.6
0.6
TVS Motor
Accumulate
286
313
13,568
11,845
14,040
7.2
9.0
10.4
17.4
27.5
16.4
6.9
5.3
25.1
32.0
1.1
0.9
Amara Raja Batteries
Buy
888
1,040
15,175
4,892
5,871
17.4
17.6
28.8
37.1
30.9
24.0
7.2
5.8
23.4
24.1
3.1
2.5
Exide Industries
Accumulate
147
162
12,521
6,950
7,784
14.4
14.8
6.6
7.3
22.3
20.2
2.8
2.6
12.6
12.8
1.5
1.4
Apollo Tyres
Neutral
162
-
8,256
12,576
12,978
16.8
16.1
22.3
19.9
7.3
8.2
1.3
1.1
17.2
13.4
0.7
0.8
Ceat
Neutral
1,068
-
4,321
6,041
6,597
14.1
13.7
99.5
111.9
10.7
9.6
2.1
1.8
19.6
18.5
0.9
0.7
JK Tyres
Neutral
98
-
2,230
7,446
7,669
15.2
14.0
19.6
18.4
5.0
5.3
1.3
1.0
25.2
19.5
0.7
0.6
Swaraj Engines
Neutral
945
-
1,174
552
630
14.2
14.7
44.6
54.1
21.2
17.5
4.9
4.5
23.2
25.6
2.0
1.7
Subros
Neutral
86
-
516
1,268
1,488
11.6
11.9
3.7
6.6
23.3
13.0
1.6
1.4
6.8
11.4
0.7
0.6
Indag Rubber
Neutral
202
-
531
283
329
17.0
17.2
13.0
15.4
15.6
13.1
3.4
2.8
21.8
21.6
1.6
1.3
Capital Goods
ACE
Neutral
44
-
436
660
839
4.7
8.2
1.0
3.9
44.1
11.3
1.4
1.2
3.2
11.3
0.8
0.6
BEML
Neutral
1,099
-
4,578
3,277
4,006
6.0
8.9
29.2
64.3
37.7
17.1
2.1
1.9
5.7
11.7
1.5
1.2
BGR Energy
Neutral
114
-
824
3,615
3,181
9.5
9.4
16.7
12.4
6.8
9.2
0.6
0.6
10.0
7.0
0.6
0.8
BHEL
Neutral
201
-
49,160
33,722
35,272
10.8
11.7
10.5
14.2
19.1
14.1
1.4
1.3
7.0
9.0
1.5
1.5
Blue Star
Accumulate
364
387
3,271
3,649
4,209
5.0
5.9
9.2
14.7
39.8
24.7
7.2
6.8
9.1
17.5
1.0
0.9
Crompton Greaves
Buy
173
204
10,818
13,484
14,687
4.9
6.2
4.5
7.1
38.4
24.3
2.7
2.5
7.2
10.8
0.9
0.8
Inox Wind
Buy
389
505
8,624
4,980
5,943
17.0
17.5
26.6
31.6
14.6
12.3
4.4
3.2
35.0
30.0
1.9
1.5
Stock Watch
November 05, 2015
Company Name
Reco
CMP
Target
Mkt Cap
Sales ( Čcr )
OPM(%)
EPS (Č)
PER(x)
P/BV(x)
RoE(%)
EV/Sales(x)
(Č)
Price ( Č)
( Č cr )
FY16E
FY17E
FY16E
FY17E
FY16E
FY17E
FY16E
FY17E
FY16E
FY17E
FY16E
FY17E
FY16E
FY17E
Capital Goods
KEC International
Neutral
136
-
3,484
8,791
9,716
6.1
6.8
5.4
8.2
25.1
16.5
2.5
2.3
10.0
14.0
0.6
0.6
Thermax
Neutral
859
-
10,234
6,413
7,525
7.4
8.5
30.5
39.3
28.2
21.9
4.3
3.8
15.0
17.0
1.6
1.3
Cement
ACC
Buy
1,407
1,630
26,417
13,151
14,757
16.4
18.3
63.9
83.4
22.0
16.9
2.8
2.6
13.3
16.1
1.8
1.6
Ambuja Cements
Accumulate
209
233
32,497
11,564
12,556
19.4
20.7
8.9
10.1
23.5
20.7
3.0
2.8
12.8
13.8
2.5
2.2
India Cements
Buy
82
112
2,507
4,716
5,133
15.9
16.9
3.7
7.5
22.1
10.9
0.8
0.8
3.8
7.3
0.8
0.7
JK Cement
Buy
647
767
4,522
4,056
4,748
14.5
17.0
22.6
41.1
28.6
15.7
2.6
2.3
9.3
15.3
1.5
1.3
J K Lakshmi Cement
Buy
367
430
4,319
2,947
3,616
16.7
19.9
11.5
27.2
31.9
13.5
3.0
2.6
9.8
20.8
1.9
1.5
Mangalam Cements
Neutral
218
-
581
1,053
1,347
10.5
13.3
8.4
26.0
25.9
8.4
1.1
1.0
4.3
12.5
0.9
0.7
Orient Cement
Accumulate
163
183
3,347
1,854
2,524
21.2
22.2
7.7
11.1
21.2
14.7
3.1
2.6
13.3
15.7
2.5
1.8
Ramco Cements
Neutral
372
-
8,859
4,036
4,545
20.8
21.3
15.1
18.8
24.6
19.8
3.0
2.7
12.9
14.3
2.7
2.3
Shree Cement^
Neutral
12,439
-
43,333
7,150
8,742
26.7
28.6
228.0
345.5
54.6
36.0
8.0
6.7
15.7
20.3
5.8
4.7
UltraTech Cement
Accumulate
2,894
3,282
79,421
25,021
30,023
19.1
21.6
89.0
132.0
32.5
21.9
3.8
3.3
12.2
15.9
3.2
2.7
Construction
ITNL
Neutral
90
-
2,974
7,360
8,825
34.0
35.9
1.0
5.0
90.4
18.1
0.4
0.4
0.3
1.4
3.8
3.7
KNR Constructions
Neutral
584
-
1,642
915
1,479
14.3
13.9
20.3
37.2
28.8
15.7
2.6
2.3
9.6
15.6
1.9
1.2
Larsen & Toubro
Buy
1,371
1,646
127,547
64,148
73,241
11.5
11.7
62.0
66.0
22.1
20.8
2.3
2.1
13.4
14.0
2.2
1.9
Gujarat Pipavav Port
Neutral
165
-
7,960
629
684
51.0
52.2
6.4
5.9
25.7
27.9
3.4
3.1
15.9
12.7
12.3
11.1
MBL Infrastructures
Buy
209
285
867
2,313
2,797
12.2
14.6
19.0
20.0
11.0
10.5
1.2
1.1
11.3
10.6
1.1
1.0
Nagarjuna Const.
Neutral
79
-
4,386
7,892
8,842
8.3
9.1
2.4
5.3
32.9
14.9
1.3
1.2
4.2
8.6
0.8
0.7
PNC Infratech
Neutral
527
-
2,704
1,798
2,132
13.2
13.5
22.0
30.0
24.0
17.6
2.2
1.9
11.5
11.4
1.6
1.4
Simplex Infra
Neutral
323
-
1,596
6,241
7,008
10.4
10.7
20.0
36.0
16.1
9.0
1.3
1.2
6.8
11.1
0.8
0.7
Financials
Allahabad Bank
Neutral
76
-
4,534
8,332
9,259
2.8
2.8
21.0
25.6
3.6
3.0
0.4
0.3
9.8
10.9
-
-
Axis Bank
Buy
473
630
112,532
26,473
31,527
3.5
3.6
35.7
43.5
13.2
10.9
2.6
2.2
17.9
18.9
-
-
Bank of Baroda
Neutral
163
-
37,662
19,105
21,474
2.0
2.0
19.1
24.8
8.5
6.6
0.9
0.8
10.2
12.1
-
-
Bank of India
Neutral
133
-
10,556
15,972
17,271
1.9
2.0
15.3
33.4
8.7
4.0
0.4
0.3
3.6
7.6
-
-
Canara Bank
Neutral
274
-
14,894
15,251
16,725
2.0
2.0
59.3
68.6
4.6
4.0
0.5
0.4
10.1
10.7
-
-
Dena Bank
Neutral
43
-
2,427
3,440
3,840
2.1
2.3
7.3
10.0
6.0
4.3
0.5
0.4
6.1
7.9
-
-
Federal Bank
Neutral
55
-
9,483
3,477
3,999
3.0
3.0
5.0
6.2
11.0
8.9
1.1
1.0
10.6
11.9
-
-
HDFC
Neutral
1,220
-
192,461
10,358
11,852
3.3
3.3
41.1
47.0
29.7
25.9
5.7
5.1
24.7
24.9
-
-
HDFC Bank
Buy
1,082
1,262
272,557
38,309
47,302
4.3
4.3
49.3
61.1
21.9
17.7
3.8
3.3
18.5
19.7
-
-
Stock Watch
November 05, 2015
Company Name
Reco
CMP
Target
Mkt Cap
Sales ( Čcr )
OPM(%)
EPS (Č)
PER(x)
P/BV(x)
RoE(%)
EV/Sales(x)
(Č)
Price ( Č)
( Č cr )
FY16E
FY17E
FY16E
FY17E
FY16E
FY17E
FY16E
FY17E
FY16E
FY17E
FY16E
FY17E
FY16E
FY17E
Financials
ICICI Bank
Buy
273
348
158,782
35,168
40,517
3.4
3.4
21.4
25.2
12.8
10.9
2.2
1.8
14.7
15.2
-
-
IDBI Bank
Neutral
85
-
13,602
9,625
10,455
1.8
1.8
8.5
14.2
10.0
6.0
0.6
0.6
5.9
9.3
-
-
Indian Bank
Neutral
127
-
6,109
6,160
6,858
2.5
2.5
24.5
29.8
5.2
4.3
0.4
0.4
7.7
8.6
-
-
LIC Housing Finance
Buy
481
571
24,284
3,101
3,745
2.5
2.5
33.0
40.2
14.6
12.0
2.7
2.3
19.7
20.5
-
-
Oriental Bank
Neutral
144
-
4,328
7,643
8,373
2.4
2.4
37.2
45.4
3.9
3.2
0.3
0.3
8.2
9.4
-
-
Punjab Natl.Bank
Neutral
131
-
25,772
23,638
26,557
2.8
2.8
17.9
27.2
7.3
4.8
0.7
0.6
8.5
12.0
-
-
South Ind.Bank
Neutral
21
-
2,829
1,965
2,185
2.5
2.5
2.5
3.3
8.4
6.3
0.8
0.8
9.5
11.7
-
-
St Bk of India
Buy
238
295
185,103
82,520
93,299
2.7
2.8
20.0
24.5
11.9
9.8
1.3
1.2
11.5
12.8
-
-
Union Bank
Neutral
163
-
11,226
12,646
14,129
2.3
2.4
31.0
39.1
5.3
4.2
0.6
0.5
9.8
11.4
-
-
Vijaya Bank
Neutral
35
-
3,007
3,536
3,827
1.9
1.9
5.5
6.7
6.3
5.3
0.5
0.5
7.8
8.8
-
-
Yes Bank
Buy
783
914
32,798
7,228
9,043
3.2
3.3
57.7
69.4
13.6
11.3
2.4
2.1
19.1
19.6
-
-
FMCG
Asian Paints
Neutral
804
-
77,096
16,553
19,160
16.0
16.2
17.7
21.5
45.5
37.4
12.1
10.9
29.4
31.2
4.5
3.9
Britannia
Neutral
3,181
-
38,159
8,065
9,395
9.6
10.2
47.2
65.5
67.4
48.6
22.4
21.2
38.3
41.2
4.6
3.9
Colgate
Neutral
941
-
25,597
4,836
5,490
19.5
19.7
48.5
53.2
19.4
17.7
14.2
12.4
99.8
97.5
5.2
4.6
Dabur India
Neutral
270
-
47,469
9,370
10,265
17.1
17.2
7.3
8.1
36.8
33.4
11.1
9.0
33.7
30.6
5.0
4.5
GlaxoSmith Con*
Neutral
6,003
-
25,247
4,919
5,742
17.2
17.4
168.3
191.2
35.7
31.4
10.1
8.6
28.8
28.9
4.7
4.0
Godrej Consumer
Neutral
1,282
-
43,672
10,168
12,886
16.1
16.1
32.1
38.4
40.0
33.4
8.1
7.5
19.7
21.0
4.4
3.5
HUL
Neutral
803
-
173,661
34,940
38,957
17.5
17.7
20.8
24.7
38.6
32.5
42.9
34.3
110.5
114.2
4.8
4.3
ITC
Buy
336
409
269,329
41,068
45,068
37.8
37.4
13.9
15.9
24.1
21.1
8.1
7.1
34.1
33.8
6.2
5.6
Marico
Neutral
399
-
25,755
6,551
7,766
15.7
16.0
10.4
12.5
38.5
31.9
11.2
9.3
33.2
32.4
3.9
3.3
Nestle*
Accumulate
6,247
6,646
60,232
11,291
12,847
22.2
22.3
158.9
184.6
39.3
33.8
20.6
18.5
55.0
57.3
5.2
4.5
Tata Global
Accumulate
132
144
8,305
8,635
9,072
9.8
9.9
6.5
7.6
20.3
17.3
2.0
1.9
6.8
7.4
0.9
0.9
IT
HCL Tech^
Buy
880
1,132
123,789
42,038
47,503
23.2
23.5
55.8
62.9
15.8
14.0
3.6
2.8
23.0
19.8
2.6
2.0
Infosys
Accumulate
1,137
1,306
261,174
60,250
66,999
28.0
28.0
58.3
63.7
19.5
17.9
4.1
3.5
20.9
19.7
3.7
3.1
TCS
Buy
2,529
3,165
498,410
111,274
126,852
28.4
28.7
125.4
143.9
20.2
17.6
8.0
7.4
39.9
42.2
4.1
3.5
Tech Mahindra
Buy
543
646
52,267
25,566
28,890
16.0
17.0
26.3
31.9
20.7
17.0
3.7
3.2
17.9
18.6
1.8
1.5
Wipro
Buy
573
719
141,611
52,414
58,704
23.7
23.8
38.4
42.3
14.9
13.6
2.9
2.6
19.5
18.0
2.3
1.9
Media
D B Corp
Accumulate
315
356
5,790
2,241
2,495
27.8
27.9
21.8
25.6
14.5
12.3
3.8
3.3
26.7
28.5
2.5
2.3
HT Media
Neutral
80
-
1,863
2,495
2,603
11.2
11.2
7.3
8.6
11.0
9.3
0.9
0.8
7.4
8.1
0.3
0.2
Stock Watch
November 05, 2015
Company Name
Reco
CMP
Target
Mkt Cap
Sales ( Čcr )
OPM(%)
EPS (Č)
PER(x)
P/BV(x)
RoE(%)
EV/Sales(x)
(Č)
Price ( Č)
( Č cr )
FY16E FY17E
FY16E
FY17E
FY16E
FY17E
FY16E
FY17E
FY16E
FY17E
FY16E
FY17E
FY16E
FY17E
Media
Jagran Prakashan
Buy
146
169
4,776
2,170
2,355
27.0
27.6
12.8
10.3
11.4
14.2
3.2
3.0
21.8
19.4
2.0
1.7
Sun TV Network
Neutral
384
-
15,119
2,779
3,196
70.2
70.5
22.8
27.3
16.8
14.1
4.2
3.8
26.7
28.3
5.2
4.5
Hindustan Media
Neutral
274
-
2,009
920
1,031
20.0
20.0
19.2
20.9
14.3
13.1
2.3
2.0
16.4
15.3
1.7
1.5
Ventures
Metals & Mining
Coal India
Buy
330
400
208,598
77,508
85,330
21.4
23.7
24.8
27.6
13.3
12.0
5.1
4.9
38.6
41.6
2.0
1.8
Hind. Zinc
Accumulate
157
175
66,253
14,641
14,026
50.4
50.4
17.7
16.0
8.9
9.8
1.4
1.2
16.2
13.2
2.1
2.0
Hindalco
Neutral
82
-
16,902
104,356
111,186
8.7
9.5
6.7
11.1
12.2
7.4
0.4
0.4
3.5
5.9
0.7
0.6
JSW Steel
Neutral
891
-
21,545
42,308
45,147
16.4
20.7
(10.3)
49.5
18.0
1.0
1.0
(1.0)
5.6
1.6
1.5
NMDC
Neutral
95
-
37,625
8,237
10,893
46.6
44.5
10.0
11.7
9.5
8.1
1.1
0.9
12.5
13.0
4.4
3.3
SAIL
Neutral
50
-
20,836
45,915
53,954
7.2
10.5
1.5
4.4
33.5
11.5
0.5
0.5
2.3
4.1
1.1
1.0
Vedanta
Neutral
99
-
29,262
71,445
81,910
26.2
26.3
12.9
19.2
7.7
5.1
0.5
0.5
7.2
8.9
0.9
0.7
Tata Steel
Neutral
236
-
22,901
126,760
137,307
8.9
11.3
6.4
23.1
37.1
10.2
0.7
0.7
2.0
7.1
0.8
0.7
Oil & Gas
Cairn India
Neutral
153
-
28,704
11,323
12,490
49.4
51.0
20.7
20.7
7.4
7.4
0.5
0.5
6.4
6.1
1.6
0.9
GAIL
Neutral
302
-
38,251
64,856
70,933
9.1
9.6
24.0
28.9
12.6
10.4
1.1
1.0
8.8
9.6
0.8
0.7
ONGC
Neutral
252
-
215,556
154,564
167,321
36.8
37.4
28.6
32.5
8.8
7.8
1.1
1.0
12.7
13.5
1.6
1.5
Petronet LNG
Neutral
205
-
15,409
29,691
31,188
5.8
6.2
12.8
13.4
16.1
15.3
2.4
2.1
15.8
14.8
0.6
0.6
Indian Oil Corp
Accumulate
410
455
99,607
359,607
402,760
5.9
6.1
42.5
48.7
9.7
8.4
1.3
1.1
14.1
14.4
0.4
0.3
Reliance Industries
Accumulate
952
1,050
308,331
304,775
344,392
12.6
13.4
91.3
102.6
10.4
9.3
1.2
1.1
11.8
12.0
0.9
0.8
Pharmaceuticals
Alembic Pharma
Neutral
680
-
12,810
2,601
3,115
21.2
20.2
20.8
23.9
32.7
28.4
10.5
7.9
37.2
31.8
5.0
4.1
Aurobindo Pharma
Accumulate
820
872
47,885
14,923
17,162
23.0
23.0
38.2
43.6
21.5
18.8
6.6
5.0
36.0
30.2
3.6
3.0
Aventis*
Neutral
4,310
-
9,925
2,082
2,371
17.4
20.8
118.2
151.5
36.5
28.5
5.3
4.3
19.9
25.5
4.4
3.7
Cadila Healthcare
Neutral
431
-
44,128
10,224
11,840
21.0
22.0
14.6
17.6
29.5
24.5
8.1
6.3
30.8
29.0
4.4
3.7
Cipla
Neutral
671
-
53,880
14,359
16,884
21.3
19.7
28.4
30.5
23.6
22.0
4.2
3.6
19.3
17.5
3.7
3.1
Dr Reddy's
Neutral
4,314
-
73,567
18,213
21,214
22.6
22.7
163.0
192.5
26.5
22.4
5.4
4.5
22.5
20.0
4.0
3.4
Dishman Pharma
Neutral
399
-
3,221
1,716
1,888
20.2
20.2
16.3
21.6
24.5
18.5
2.3
2.1
9.7
11.7
2.1
1.7
GSK Pharma*
Neutral
3,222
-
27,293
2,870
3,158
20.0
22.1
59.5
68.3
54.2
47.2
16.0
16.4
28.5
34.3
9.0
8.2
Indoco Remedies
Neutral
319
-
2,941
1,088
1,262
18.2
18.2
13.1
15.5
24.4
20.6
4.8
4.0
21.2
21.1
2.8
2.4
Ipca labs
Buy
749
900
9,448
3,363
3,909
12.9
18.6
13.4
28.0
55.9
26.7
7.3
5.8
7.4
14.0
3.1
2.7
Lupin
Neutral
1,859
-
83,709
14,864
17,244
26.9
26.9
62.1
71.1
29.9
26.2
7.3
5.8
27.4
24.6
5.4
4.5
Sun Pharma
Accumulate
852
950
205,113
28,163
32,610
25.8
30.7
17.4
26.9
49.0
31.7
4.6
4.0
13.0
16.6
6.8
5.6
Stock Watch
November 05, 2015
Company Name
Reco
CMP
Target
Mkt Cap
Sales ( Čcr )
OPM(%)
EPS (Č)
PER(x)
P/BV(x)
RoE(%)
EV/Sales(x)
(Č)
Price ( Č)
( Č cr )
FY16E FY17E
FY16E
FY17E
FY16E
FY17E
FY16E
FY17E
FY16E
FY17E
FY16E
FY17E
FY16E
FY17E
Power
Tata Power
Neutral
69
-
18,567
35,923
37,402
22.6
22.8
4.1
5.2
16.9
13.3
1.3
1.2
7.5
9.3
1.5
1.4
NTPC
Buy
135
157
111,066
87,064
98,846
23.5
23.5
11.7
13.2
11.5
10.2
1.3
1.2
11.4
12.1
2.3
2.1
Power Grid
Buy
131
170
68,638
20,702
23,361
86.7
86.4
12.1
13.2
10.9
9.9
1.6
1.4
15.6
15.1
8.2
7.7
Telecom
Bharti Airtel
Neutral
346
-
138,170
101,748
109,191
32.1
31.7
12.0
12.5
28.8
27.7
2.0
1.9
6.9
6.7
2.0
1.8
Idea Cellular
Neutral
141
-
50,755
34,282
36,941
32.0
31.5
5.9
6.2
23.9
22.7
2.2
2.0
9.9
9.3
2.1
1.9
zOthers
Abbott India
Neutral
5,497
-
11,680
2,715
3,153
14.5
14.1
134.3
152.2
40.9
36.1
10.2
8.4
27.4
25.6
4.0
3.4
Bajaj Electricals
Buy
254
341
2,565
4,719
5,287
5.2
5.8
8.6
12.7
29.7
20.1
3.4
3.0
11.4
14.8
0.5
0.5
Finolex Cables
Neutral
245
-
3,751
2,728
3,036
10.8
11.0
14.4
16.8
17.0
14.6
2.6
2.3
15.2
15.3
1.1
1.0
Goodyear India*
Accumulate
580
655
1,337
1,953
1,766
12.4
12.0
67.4
59.6
8.6
9.7
2.1
1.8
27.7
20.2
0.5
0.4
Hitachi
Neutral
1,335
-
3,629
1,779
2,081
7.8
8.8
21.8
33.4
61.2
39.9
9.9
8.0
17.4
22.1
2.1
1.8
Jyothy Laboratories
Neutral
304
-
5,508
1,620
1,847
11.5
11.5
7.3
8.5
41.7
35.9
5.4
5.0
13.3
14.4
3.3
2.8
MRF
Buy
38,963
45,575
16,525
20,316
14,488
21.4
21.1
5,488.0
3,798.0
7.1
10.3
2.4
2.0
41.1
21.2
0.8
1.0
Page Industries
Neutral
13,727
-
15,310
1,929
2,450
19.8
20.1
229.9
299.0
59.7
45.9
26.3
18.3
52.1
47.1
8.0
6.3
Relaxo Footwears
Neutral
524
-
6,293
1,767
2,152
12.3
12.5
19.3
25.1
27.3
20.9
6.7
5.1
27.7
27.8
3.6
2.9
Siyaram Silk Mills
Buy
957
1,145
897
1,636
1,815
11.5
11.5
89.9
104.1
10.6
9.2
1.8
1.5
17.9
17.8
0.7
0.6
Styrolution ABS India*
Neutral
801
-
1,408
1,271
1,440
8.6
9.2
32.0
41.1
25.0
19.5
2.6
2.3
10.7
12.4
1.1
0.9
Tree House
Buy
274
347
1,158
259
324
56.8
56.8
17.0
21.7
16.1
12.6
1.6
1.5
10.1
11.5
4.4
3.7
TVS Srichakra
Accumulate
2,806
3,210
2,148
2,127
2,388
15.2
14.9
237.7
267.5
11.8
10.5
5.0
3.6
51.7
39.8
1.1
0.9
HSIL
Accumulate
287
302
2,075
2,182
2,404
16.3
16.5
15.8
18.9
18.2
15.2
1.5
1.4
8.4
9.4
1.3
1.2
Kirloskar Engines India
Neutral
262
-
3,793
2,634
3,252
10.1
12.0
10.9
17.4
24.1
15.0
2.7
2.4
11.4
16.8
1.1
0.8
Ltd
M M Forgings
Buy
530
670
640
541
634
21.7
21.4
47.8
55.9
11.1
9.5
2.2
1.8
21.8
20.9
1.3
1.1
Banco Products (India)
Neutral
132
-
945
1,208
1,353
11.0
12.3
10.8
14.5
12.3
9.1
1.4
1.3
11.9
14.5
0.7
0.7
Competent Automobiles Neutral
142
-
87
1,007
1,114
3.1
3.1
23.7
28.2
6.0
5.0
0.8
0.7
13.9
14.6
0.1
0.1
Nilkamal
Neutral
1,077
-
1,607
1,948
2,147
10.6
10.3
60.0
67.0
18.0
16.1
2.8
2.4
16.8
16.1
0.9
0.8
Visaka Industries
Buy
131
166
207
1,158
1,272
8.6
9.5
23.7
32.7
5.5
4.0
0.6
0.5
10.1
12.5
0.3
0.3
Transport Corporation of
Neutral
276
-
2,096
2,830
3,350
8.8
9.0
14.4
18.3
19.2
15.1
3.0
2.6
15.4
17.1
0.9
0.7
India
Elecon Engineering
Neutral
79
-
858
1,452
1,596
14.0
14.7
4.4
6.2
17.8
12.7
1.5
1.4
8.6
11.2
0.9
0.8
Surya Roshni
Buy
133
183
584
2,992
3,223
8.3
8.5
14.7
18.3
9.1
7.3
0.9
0.8
9.7
11.0
0.5
0.4
MT Educare
Buy
139
169
554
286
366
18.3
17.7
7.7
9.4
18.0
14.8
3.8
3.3
20.2
21.1
1.8
1.4
Stock Watch
November 05, 2015
Company Name
Reco
CMP
Target Mkt Cap
Sales ( Čcr )
OPM(%)
EPS (Č)
PER(x)
P/BV(x)
RoE(%)
EV/Sales(x)
(Č)
Price ( Č)
( Č cr )
FY16E FY17E FY16E FY17E FY16E FY17E FY16E FY17E FY16E FY17E FY16E FY17E FY16E FY17E
zOthers
Radico Khaitan
Accumulate
108
119
1,441
1,565
1,687
11.9
12.4
5.4
6.6
20.0
16.5
1.6
1.5
8.0
9.0
1.4
1.4
Garware Wall Ropes
Accumulate
370
390
811
875
983
10.4
10.6
23.1
27.8
16.1
13.3
2.3
2.0
14.1
14.8
0.9
0.8
Wonderla Holidays
Neutral
329
-
1,860
206
308
44.0
43.6
9.0
12.9
36.6
25.5
5.0
4.5
13.7
17.8
8.9
5.9
Linc Pen & Plastics
Accumulate
165
185
244
340
371
8.3
8.9
10.8
13.2
15.3
12.5
2.4
2.1
16.0
17.1
0.8
0.7
The Byke Hospitality
Buy
157
181
631
222
287
20.5
20.5
5.6
7.6
27.9
20.8
5.3
4.3
18.9
20.8
2.9
2.2
Source: Company, Angel Research; Note: *December year end; #September year end; &October year end; Price as on November 04, 2015
Market Outlook
November 05, 2015
Research Team Tel: 022 - 39357800
DISCLAIMER
Angel Broking Private Limited (hereinafter referred to as “Angel”) is a registered Member of National Stock Exchange of India Limited,
Bombay Stock Exchange Limited and Metropolitian Stock Exchange of India Limited. It is also registered as a Depository Participant with
CDSL and Portfolio Manager with SEBI. It also has registration with AMFI as a Mutual Fund Distributor. Angel Broking Private Limited is a
registered entity with SEBI for Research Analyst in terms of SEBI (Research Analyst) Regulations, 2014 vide registration number
INH000000164. Angel or its associates has not been debarred/ suspended by SEBI or any other regulatory authority for accessing
/dealing in securities Market. Angel or its associates including its relatives/analyst do not hold any financial interest/beneficial ownership
of more than 1% in the company covered by Analyst. Angel or its associates/analyst has not received any compensation / managed or co
-managed public offering of securities of the company covered by Analyst during the past twelve months. Angel/analyst has not served as
an officer, director or employee of company covered by Analyst and has not been engaged in market making activity of the company
covered by Analyst.
This document is solely for the personal information of the recipient, and must not be singularly used as the basis of any investment
decision. Nothing in this document should be construed as investment or financial advice. Each recipient of this document should make
such investigations as they deem necessary to arrive at an independent evaluation of an investment in the securities of the companies
referred to in this document (including the merits and risks involved), and should consult their own advisors to determine the merits and
risks of such an investment.
Reports based on technical and derivative analysis center on studying charts of a stock's price movement, outstanding positions and
trading volume, as opposed to focusing on a company's fundamentals and, as such, may not match with a report on a company's
fundamentals.
The information in this document has been printed on the basis of publicly available information, internal data and other reliable sources
believed to be true, but we do not represent that it is accurate or complete and it should not be relied on as such, as this document is for
general guidance only. Angel Broking Pvt. Limited or any of its affiliates/ group companies shall not be in any way responsible for any
loss or damage that may arise to any person from any inadvertent error in the information contained in this report. Angel Broking Pvt.
Limited has not independently verified all the information contained within this document. Accordingly, we cannot testify, nor make any
representation or warranty, express or implied, to the accuracy, contents or data contained within this document. While Angel Broking
Pvt. Limited endeavors to update on a reasonable basis the information discussed in this material, there may be regulatory, compliance,
or other reasons that prevent us from doing so.
This document is being supplied to you solely for your information, and its contents, information or data may not be reproduced,
redistributed or passed on, directly or indirectly.
Neither Angel Broking Pvt. Limited, nor its directors, employees or affiliates shall be liable for any loss or damage that may arise from or
in connection with the use of this information.
Note: Please refer to the important ‘Stock Holding Disclosure' report on the Angel website (Research Section). Also, please refer to the
latest update on respective stocks for the disclosure status in respect of those stocks. Angel Broking Pvt. Limited and its affiliates may have
investment positions in the stocks recommended in this report.