Market Outlook
May 5, 2016
Market Cues
Domestic Indices
Chg (%)
(Pts)
(Close)
BSE Sensex
(0.5)
(128)
25,102
Indian markets are expected to open on a flat to positive note tracking the SGX
Nifty
(0.5)
(40)
7,707
Nifty.
Mid Cap
(1.2)
(135)
10,934
US Stocks ended in red, adding to the losses posted in the previous session. The
Small Cap
(1.0)
(108)
10,924
tech-heavy Nasdaq ended the session at its lowest closing level in almost two
months. The weakness on Wall Street was partly due to the release of some
Bankex
(0.9)
(160)
18,505
disappointing economic data, with a report from payroll processor ADP showing
weaker than expected private sector job growth. The report raised some concerns
Global Indices
Chg (%)
(Pts)
(Close)
ahead of the release of the Labor Department's more closely watched monthly jobs
Dow Jones
(0.6)
(100)
17,651
report on Friday.
Nasdaq
(0.8)
(38)
4,726
The European markets ended in the red, extending its losses from the previous
FTSE
(1.2)
(74)
6,112
session. Investor sentiment was impacted by some disappointing regional economic
Nikkei
(3.1)
(519)
16,147
data and some weaker than expected corporate earnings results.
Hang Seng
(0.7)
(151)
20,526
Indian shares extend losses for the third consecutive day as worries about global
Shanghai Com
(0.0)
(1)
2,991
growth and deflation weighted on dollar and pushed commodities lower. European
stocks gave up early gains on the back of mixed earnings and data releases; Indian
markets also followed suit to end modestly lower at the end of the day. Adani Ports
Advances / Declines
BSE
NSE
and Special Economic Zone slumped 12 percent after posting lower than expected
Advances
779
367
quarterly earnings and unveiling plans to raise funds up to `10,000cr.
Declines
1,806
1,193
News & Result Analysis
Unchanged
115
71
L&T says Hyderabad Metro Rail to be completed in Dec 2018
Sun Pharma says phase-3 trials in skin disorder drug show positive results
Volumes (` Cr)
Result Review: Dewan Housing Finance
BSE
2,487
Detailed analysis on Pg2
NSE
16,019
Investor’s Ready Reckoner
Key Domestic & Global Indicators
Net Inflows (` Cr)
Net
Mtd
Ytd
Stock Watch: Latest investment recommendations on 150+ stocks
FII
(748)
(399)
11,391
Refer Pg6 onwards
MFs
15
15
2,611
Top Picks
Top Gainers
Price (`)
Chg (%)
CMP
Target
Upside
Company
Sector
Rating
(`)
(`)
(%)
Federalbnk
49
4.1
Amara Raja
Auto & Auto Ancillary Accumulate
944
1,076
14.0
Prestige
184
3.8
HCL Tech
IT
Buy
737
1,038
40.9
Cholafin
875
3.4
LIC Housing
Financials
Buy
451
592
31.1
Hdfc
1,131
2.9
Bharat Electronics
Capital Goods
Buy
1,147
1,414
23.3
Balkrisind
687
2.6
Navkar Corporation Others
Buy
178
265
48.5
More Top Picks on Pg5
Top Losers
Price (`)
Chg (%)
Key Upcoming Events
Adaniports
208
(12.0)
Previous
Consensus
Date
Region
Event Description
Reading
Expectations
Sail
42
(8.5)
May 6 US
Change in Nonfarm payrolls (thousands)
215
200
Adanient
79
(7.7)
May 8 China
Exports YoY%
11.5
1.3
Nationalum
44
(6.8)
May 10 India
Exports YoY%
(5.47)
--
Unitech
5
(6.8)
May 10 India
Imports YoY%
(21.56)
--
As on May 4, 2016
6.(
More Events on Pg6
Market Outlook
May 5, 2016
L&T says Hyderabad Metro Rail to be completed in Dec 2018
L&T Limited, the concessionaire of the `16,000cr Hyderabad Metro Rail, indicated
that project was likely to be completed in December 2018, much beyond the five-
year deadline that expires in July 2017.
Despite faster progress achieved on the ground during the last three-and-a-half
years, L&T Metro Rail (Hyderabad) Limited has been facing time and cost overruns
owing to delays that it has attributed to the grant of right of ways among other
things. The company so far has spent about `10,000cr on the project, including
`2,800cr from its equity and about `600cr from the Viability Gap Fund (VGF)
being provided by Government of India. About 60 per cent of the work has been
completed, according to the officials.
Besides seeking to address the 18-month delay expected to arise in project
completion, the company is also expecting a solution for the problem of cost
overrun, estimated to be around `3,000cr, from the state government as well as
the Centre. We maintain our Accumulate rating on the stock.
Sun Pharma says phase-3 trials in skin disorder drug show
positive results
Sun Pharmaceutical Industries stated that two pivotal phase-3 clinical trials for
plaque psoriasis drug have shown positive results.
The drug, Tildrakizumab, is being developed by Sun Pharmaceutical under license
from multinational drug major MSD. The trials focused on evaluating the efficacy
and safety of the under trial drug in patients with moderate-to-severe plaque
psoriasis, a skin disorder. Sun Pharma acquired worldwide rights to tildrakizumab
for use in all human indications from MSD in exchange for an upfront payment of
$80 million. We maintain our Buy rating on the stock.
Result Review
Dewan Housing Finance (CMP: `198/ TP: `270/Upside:36.4%)
Dewan Housing reported results for the quarter ended March 31, 2016 which
were marginally lower than our expectations; however the dividend payout is a key
positive. The company’s total income for the quarter stood at `1,965cr, up 24.3%
yoy. The company reported a PAT growth of 16.9% yoy to `189.7cr. On the asset
quality front, it is maintaining Gross NPA consistently below one per cent.
Currently, Gross NPA has been reported at 0.93%.
The board of directors of DHFL has recommended a final dividend of `2 per
equity share for 2015-16. The total dividend for this financial year including the
interim dividend is `8 per equity share as against `6 per equity share for the
previous year.
We believe Housing Finance Companies like LIC Housing are expected to see
improvement in operating parameters as demand for housing loans is expected to
pick up in the years to come, backed by lower interest rate in the economy. At the
CMP of `198, the stock is trading at 0.9x its FY17 Book Value. We maintain our
BUY rating on the stock with a target price of `270.
Market Outlook
May 5, 2016
Economic and Political News
Excise duty on jewellery: NDA allies seek rollback in Parliament
Government may offer bluechip PSU shares to FIIs, domestic buyers
Banks now go the extra mile with the clean-up act
Bank credit grows at 9.7 per cent in December quarter
Corporate News
L&T Infotech signs a multi-year contract with Elkjøp Nordic
HDFC Ltd to raise `1,135cr via debentures
Srei Equipment Finance launches equipment exchange scheme
Parag Milk IPO gets subscribed 10% on Day 1
Market Outlook
May 5, 2016
Quarterly Bloomberg Brokers Consensus Estimate
Hero MotoCorp Ltd - May 5, 2016
Particulars (` cr)
4QFY16E
4QFY15
y-o-y (%)
3QFY15
q-o-q (%)
Net sales
7,445
6,695
11.2
3,398
3.8
EBITDA
1,161
838
38.5
1,224
(5.1)
EBITDA margin (%)
15.6
12.5
17.1
Net profit
809
477
69.8
796
1.7
Eicher Motors Ltd - May 5, 2016
Particulars (` cr)
1QCY16E
1QCY15
y-o-y (%)
4QCY15
q-o-q (%)
Net sales
3,905
2,776
40.7
3,248
20.2
EBITDA
622
400
55.5
548
13.5
EBITDA margin (%)
15.9
14.4
16.9
Net profit
338
195
72.9
271
24.7
Reliance Capital Ltd. - May 6, 2016
Particulars (` cr)
4QFY16E
4QFY15
y-o-y (%)
3QFY15
q-o-q (%)
Net sales
1,940
2,469
(21.4)
2,315
(16.2)
EBITDA
243
1,125
(78.4)
1,091
(77.7)
EBITDA margin (%)
12.5
45.6
47.1
Net profit
360
407
(11.5)
235
53.2
Siemens Ltd. - May 6, 2016
Particulars (` cr)
2QSY15E
2QSY14
y-o-y (%)
1QSY15
q-o-q (%)
Net sales
2,793
2589
7.9
2265
23.3
EBITDA
260
294
(11.4)
235
10.6
EBITDA margin (%)
9.3
11.3
10.4
Net profit
159
162
(1.8)
114
39.5
Titan company Ltd. - May 6, 2016
Particulars (` cr)
4QFY16E
4QFY15
y-o-y (%)
3QFY15
q-o-q (%)
Net sales
2,823
2,474
14.1
3,398
(16.9)
EBITDA
294
270
8.8
324
(9.2)
EBITDA margin (%)
10.4
10.9
9.5
Net profit
215
215
0.0
225
(4.5)
Grasim Industries Ltd. - May 7, 2016
Particulars (` cr)
4QFY16E
4QFY15
y-o-y (%)
3QFY15
q-o-q (%)
Net sales
9,452
8,706
8.6
8,924
5.9
EBITDA
1,676
1,549
8.2
1,718
(2.4)
EBITDA margin (%)
17.7
17.8
19.2
Net profit
640
507
26.3
650
(1.5)
Market Outlook
May 5, 2016
Top Picks ★★★★★
Large Cap
Market Cap
CMP
Target
Upside
Company
Rationale
(` Cr)
(`)
(`)
(%)
To outpace battery industry growth due to better technological
Amara Raja Batteries
16,122
944
1,076
14.0
products leading to market share gains in both the automotive
OEM and replacement segments.
Uptick in defense capex by government when coupled with
Bharat Electronics
27,523
1,147
1,414
23.3
BELs strong market positioning, indicate that good times are
ahead for BEL.
The stock is trading at attractive valuations and is factoring all
HCL Tech
1,03,923
737
1,038
40.9
the bad news.
Strong visibility for a robust 20% earnings trajectory, coupled
HDFC Bank
2,85,146
1,127
1,262
12.0
with high quality of earnings on account of high quality retail
business and strategic focus on highly rated corporates.
Back on the growth trend, expect a long term growth of 14%
Infosys
2,74,125
1,190
1,374
15.5
to be a US$20bn in FY2020.
LICHF continues to grow its retail loan book at a healthy pace
with improvement in asset quality. We expect the company to
LIC Housing Finance
22,780
451
592
31.1
post a healthy loan book which is likely to reflect in a strong
earnings growth.
Huge bid pipeline of re-development works at Delhi and other
NBCC
11,872
989
1,089
10.1
State Governments and opportunity from Smart City, positions
NBCC to report strong growth, going forward.
Source: Company, Angel Research
Mid Cap
Market Cap
CMP
Target
Upside
Company
Rationale
(` Cr)
(`)
(`)
(%)
Favorable outlook for the AC industry to augur well for
Cooling products business which is out pacing the market
Blue Star
3,786
421
481
14.3
growth. EMPPAC division's profitability to improve once
operating environment turns around.
With a focus on the low and medium income (LMI) consumer
Dewan Housing
5,778
198
270
36.4
segment, the company has increased its presence in tier-II &
III cities where the growth opportunity is immense.
Commencement of new projects, downtrend in the interest
IL&FS Transport
2,447
74
93
25.0
rate cycle, to lead to stock re-rating
Economic recovery to have favourable impact on advertising
& circulation revenue growth. Further, the acquisition of a
Jagran Prakashan
5,441
166
205
23.2
radio business (Radio City) would also boost the company's
revenue growth.
Speedier execution and speedier sales, strong revenue visibilty
Mahindra Lifespace
1,760
429
554
29.2
in short-to-long run, attractive valuations
Massive capacity expansion along with rail advantage at ICD
Navkar Corporation
2,544
178
265
48.5
as well CFS augurs well for the company
Earnings boost on back of stable material prices and
Radico Khaitan
1,174
88
156
76.8
favourable pricing environment. Valuation discount to peers
provides additional comfort
Strong brands and distribution network would boost growth
Siyaram Silk Mills
988
1,054
1,354
28.4
going ahead. Stock currently trades at an inexpensive
valuation.
Source: Company, Angel Research
Market Outlook
May 05, 2016
Key Upcoming Events
Result Calendar
Date
Company
May 5, 2016
Hero Motocorp
May 6, 2016
Siemens, Reliance Capital
May 7, 2016
Andhra Bank
May 9, 2016
HUL, MM Forging
May 10, 2016
Automotive Axle, NIIT, Visaka Industries, Radico Khaitan
May 11, 2016
Apollo Tyres, Kotak Mah. Bank, Indian Bank, South Ind.Bank, Asian Paints, TVS Srichakra, Quick Heal
May 12, 2016
Bank of Maharashtra, Nestle, ITD Cementation, Dr Reddy's, Glenmark Pharma.
May 13, 2016
Central Bank, Cadila Healthcare
May 14, 2016
Electrosteel Castings, Relaxo
Source: Bloomberg, Angel Research
Global economic events release calendar
Date
Time
Country
Event Description
Unit
Period
Bloomberg Data
Last Reported Estimated
May 5,, 2016 6:00PM US
Initial Jobless claims
Thousands
Apr 30
257.00
260.00
May 6,, 2016 6:00PM US
Unnemployment rate
%
Apr
5.00
4.90
6:00PM US
Change in Nonfarm payrolls
Thousands
Apr
215.00
200.00
May 8,, 2016
China
Exports YoY%
% Change
Apr
11.50
1.20
May 10, 2016 7:00AM China
Consumer Price Index (YoY)
% Change
Apr
2.30
2.30
India
Imports YoY%
% Change
Apr
(21.56)
--
India
Exports YoY%
% Change
Apr
(5.47)
--
May 11, 2016 2:00PM UK
Industrial Production (YoY)
% Change
Mar
(0.50)
--
May 12, 2016 5:30PM India
Industrial Production YoY
% Change
Mar
2.00
--
4:30PM UK
BOE Announces rates
% Ratio
May 12
0.50
0.50
May 13, 2016 2:30PM Euro Zone
Euro-Zone GDP s.a. (QoQ)
% Change
1Q P
0.60
0.55
US
Producer Price Index (mom)
% Change
Apr
0.20
--
11:30AM Germany
GDP nsa (YoY)
% Change
1Q P
2.10
--
May 14, 201611:00AM China
Industrial Production (YoY)
% Change
Apr
6.80
6.60
May 16, 201612:00PM India
Monthly Wholesale Prices YoY%
% Change
Apr
(0.85)
--
Source: Bloomberg, Angel Research
Market Outlook
May 5, 2016
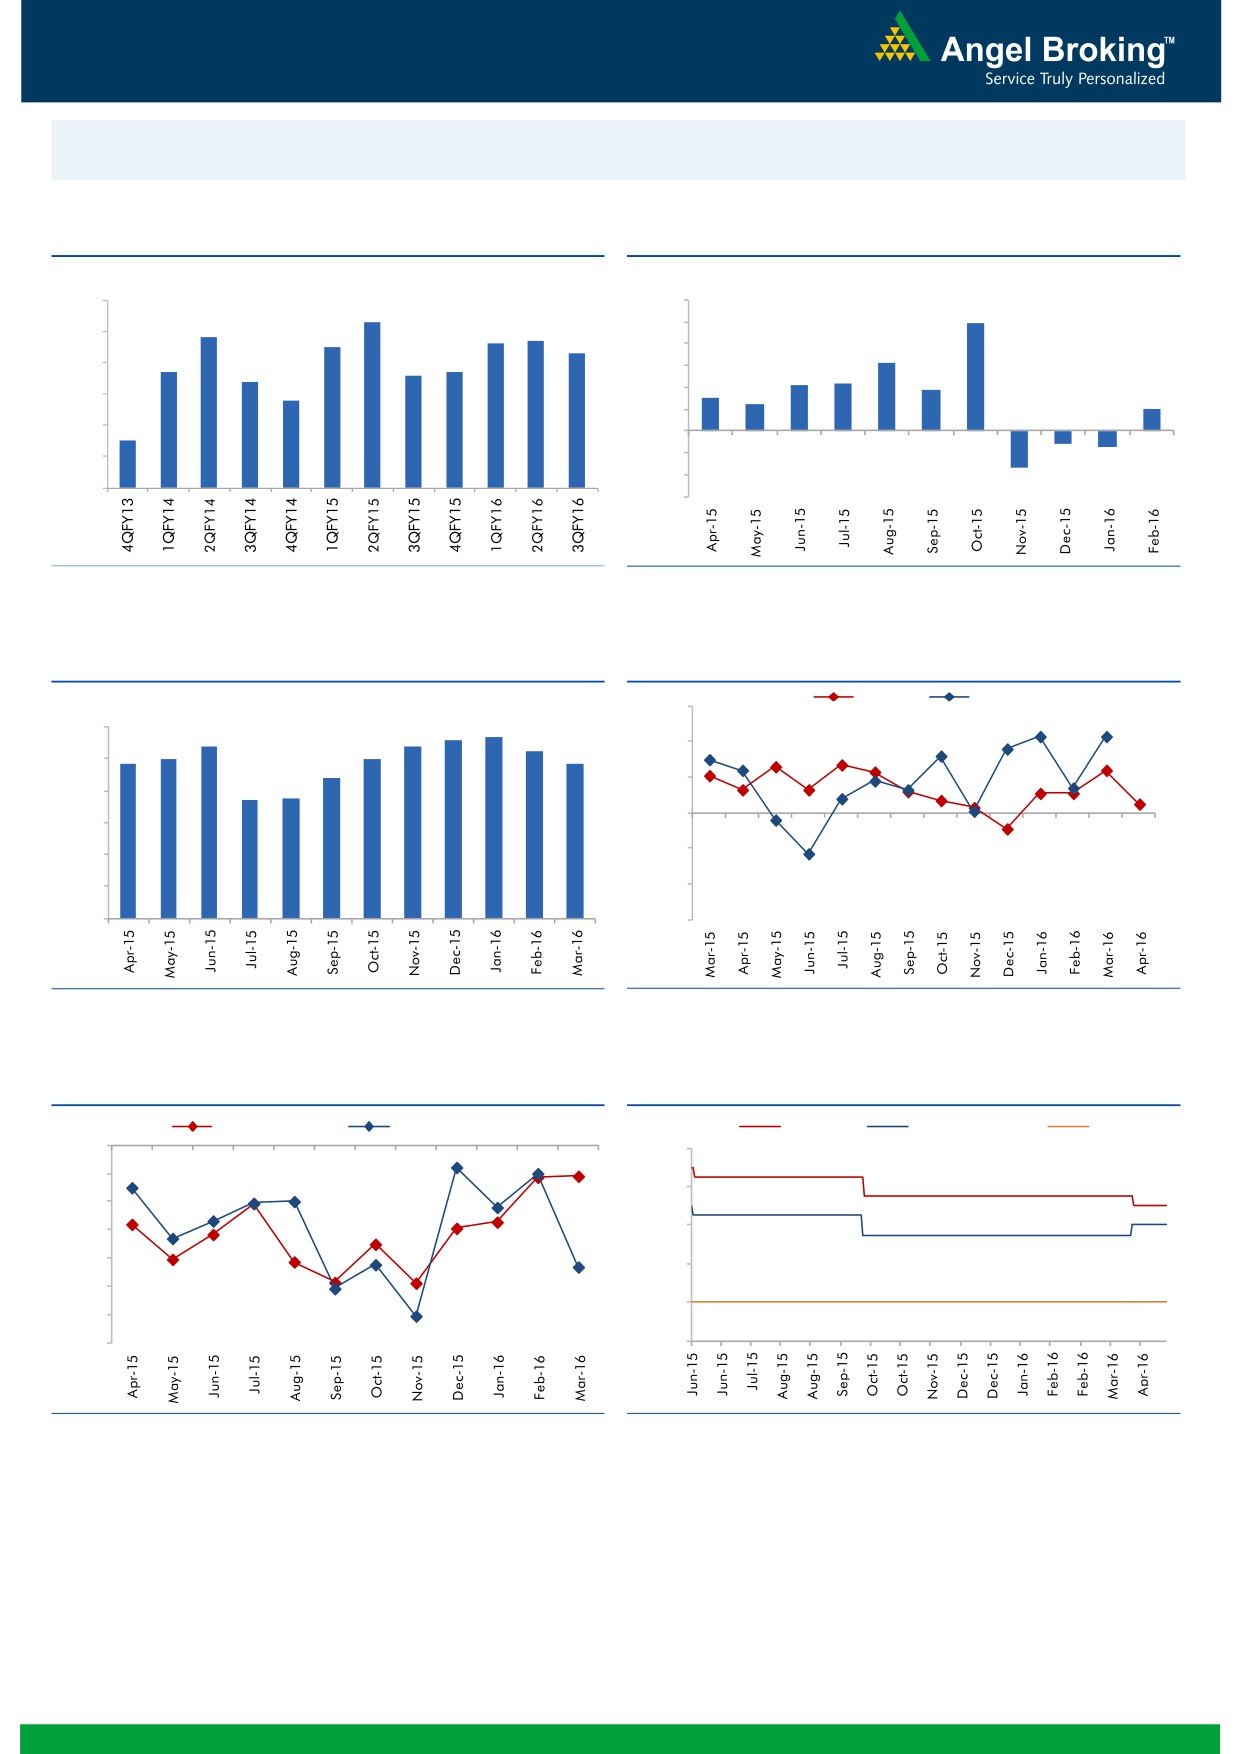
Macro watch
Exhibit 1: Quarterly GDP trends
Exhibit 2: IIP trends
(%)
(%)
9.0
8.3
12.0
9.9
7.8
7.7
10.0
8.0
7.5
7.6
7.3
8.0
6.3
6.7
6.6
6.7
7.0
6.4
6.0
4.2
4.3
3.7
5.8
3.0
2.5
6.0
4.0
2.0
2.0
5.0
4.5
-
4.0
(2.0)
(1.2)
(1.5)
(4.0)
3.0
(3.4)
(6.0)
Source: CSO, Angel Research
Source: MOSPI, Angel Research
Exhibit 3: Monthly CPI inflation trends
Exhibit 4: Manufacturing and services PMI
Mfg. PMI
Services PMI
(%)
56.0
5.6
5.7
6.0
5.4
5.4
5.3
4.9
5.0
5.0
4.8
54.0
5.0
4.4
3.7
3.7
52.0
4.0
50.0
3.0
48.0
2.0
1.0
46.0
-
44.0
Source: MOSPI, Angel Research
Source: Market, Angel Research; Note: Level above 50 indicates expansion
Exhibit 5: Exports and imports growth trends
Exhibit 6: Key policy rates
(%)
Exports yoy growth
Imports yoy growth
(%)
Repo rate
Reverse Repo rate
CRR
0.0
8.00
(5.0)
7.00
(10.0)
(15.0)
6.00
(20.0)
5.00
(25.0)
4.00
(30.0)
(35.0)
3.00
Source: Bloomberg, Angel Research
Source: RBI, Angel Research
Market Outlook
May 5, 2016
Global watch
Exhibit 1: Relative performance of indices across globe
Returns (%)
Country
Name of index
Closing price
1M
3M
1YR
Brazil
Bovespa
52,553
3.9
30.1
(5.4)
Russia
Micex
1,926
2.9
7.9
14.1
India
Nifty
7,707
(0.4)
3.6
(7.0)
China
Shanghai Composite
2,991
(0.7)
9.3
(34.0)
South Africa
Top 40
45,559
(1.3)
4.1
(6.0)
Mexico
Mexbol
45,349
(0.7)
3.9
1.1
Indonesia
LQ45
831
(1.4)
3.5
(12.4)
Malaysia
KLCI
1,658
(3.1)
(0.6)
(10.9)
Thailand
SET 50
882
(1.2)
9.9
(13.5)
USA
Dow Jones
17,651
(0.5)
9.3
(1.1)
UK
FTSE
6,112
(0.6)
0.9
(11.3)
Japan
Nikkei
16,147
(4.3)
(5.2)
(18.9)
Germany
DAX
9,828
0.1
2.6
(16.1)
France
CAC
4,324
(0.5)
0.9
(12.9)
Source: Bloomberg, Angel Research
Stock Watch
May 05, 2016
Company Name
Reco
CMP
Target
Mkt Cap
Sales ( Čcr )
OPM(%)
EPS (Č)
PER(x)
P/BV(x)
RoE(%)
EV/Sales(x)
(Č)
Price ( Č)
( Č cr )
FY16E FY17E
FY16E
FY17E
FY16E
FY17E
FY16E
FY17E
FY16E
FY17E
FY16E
FY17E
FY16E
FY17E
Agri / Agri Chemical
Rallis
Neutral
194
-
3,763
1,612
1,911
13.3
13.3
7.4
9.5
26.2
20.4
4.2
3.7
16.7
18.4
2.4
2.0
United Phosphorus
Buy
579
684
24,825
13,083
15,176
18.5
18.5
31.5
37.4
18.4
15.5
3.7
3.0
21.4
21.4
2.1
1.7
Auto & Auto Ancillary
Ashok Leyland
Accumulate
102
111
29,014
17,995
21,544
11.4
11.6
3.4
4.7
30.0
21.7
5.3
4.8
17.7
22.2
1.6
1.3
Bajaj Auto
Accumulate
2,459
2,585
71,161
22,709
25,860
20.9
20.1
129.0
143.6
19.1
17.1
5.8
5.0
30.7
29.4
2.7
2.3
Bharat Forge
Accumulate
778
875
18,100
7,351
8,318
19.9
19.7
31.2
36.5
24.9
21.3
4.5
3.8
19.3
19.2
2.6
2.3
Eicher Motors
Neutral
19,761
-
53,673
15,556
16,747
15.5
17.3
464.8
597.5
42.5
33.1
15.5
11.4
36.2
34.3
3.4
3.1
Gabriel India
Accumulate
90
101
1,291
1,415
1,544
8.7
9.0
4.6
5.4
19.5
16.6
3.5
3.1
18.1
18.9
0.9
0.8
Hero Motocorp
Neutral
2,898
-
57,863
28,244
30,532
15.5
15.9
156.7
168.5
18.5
17.2
7.4
6.3
39.9
36.4
1.9
1.7
Jamna Auto Industries Accumulate
140
160
1,121
1,281
1,473
11.2
11.5
7.6
9.2
18.5
15.3
4.7
3.8
25.4
25.2
0.9
0.8
L G Balakrishnan & Bros Neutral
452
-
710
1,254
1,394
11.6
11.8
35.9
41.7
12.6
10.9
1.7
1.5
13.5
13.8
0.7
0.6
Mahindra and Mahindra Neutral
1,318
-
81,888
38,416
42,904
13.7
13.9
54.8
63.4
24.1
20.8
3.7
3.3
15.4
15.8
1.8
1.5
Maruti
Neutral
3,809
-
115,068
57,865
68,104
16.4
16.7
176.3
225.5
21.6
16.9
4.2
3.6
19.4
21.2
1.8
1.4
Minda Industries
Accumulate
996
1,047
1,580
2,523
2,890
8.7
9.0
55.0
65.4
18.1
15.2
3.5
2.8
19.3
18.7
0.7
0.6
Motherson Sumi
Buy
254
313
33,604
39,343
45,100
8.8
9.1
10.1
12.5
25.2
20.3
8.0
6.2
35.3
34.4
0.9
0.8
Rane Brake Lining
Buy
371
465
293
454
511
11.5
12.0
25.2
31.0
14.7
12.0
2.2
2.0
14.9
16.6
0.8
0.7
Setco Automotive
Neutral
32
-
422
594
741
12.7
13.7
1.7
3.2
18.6
9.9
2.0
1.7
10.4
16.9
1.2
1.0
Tata Motors
Neutral
382
-
110,233
259,686
273,957
13.0
13.4
25.9
29.5
14.7
12.9
1.9
1.7
8.0
9.0
0.6
0.6
TVS Motor
Accumulate
290
330
13,770
11,263
13,122
6.9
8.5
9.2
15.0
31.5
19.3
7.2
5.7
22.7
29.6
1.2
1.0
Amara Raja Batteries
Accumulate
944
1,076
16,122
4,892
5,871
17.4
17.6
28.8
37.1
32.8
25.4
7.7
6.1
23.4
24.1
3.3
2.7
Exide Industries
Buy
139
162
11,845
6,950
7,784
14.4
14.8
6.6
7.3
21.1
19.1
2.7
2.4
12.6
12.8
1.4
1.3
Apollo Tyres
Buy
155
183
7,872
12,056
12,714
17.2
16.4
23.0
20.3
6.7
7.6
1.2
1.0
17.7
13.6
0.7
0.7
Ceat
Accumulate
1,060
1,119
4,286
6,041
6,597
14.1
13.7
99.5
111.9
10.7
9.5
2.1
1.8
19.6
18.5
0.9
0.7
JK Tyres
Neutral
81
-
1,841
7,446
7,669
15.2
14.0
19.6
18.4
4.1
4.4
1.0
0.9
25.2
19.5
0.6
0.6
Swaraj Engines
Neutral
1,113
-
1,383
552
630
14.2
14.7
44.6
54.1
25.0
20.6
5.8
5.3
23.2
25.6
2.4
2.0
Subros
Neutral
89
-
533
1,293
1,527
11.8
11.9
4.2
6.7
21.1
13.3
1.6
1.5
7.7
11.5
0.7
0.6
Indag Rubber
Neutral
183
-
481
283
329
17.0
17.2
13.0
15.4
14.2
11.9
3.1
2.6
21.8
21.6
1.4
1.2
Capital Goods
ACE
Neutral
40
-
393
660
839
4.7
8.2
1.0
3.9
39.7
10.2
1.2
1.1
3.2
11.3
0.7
0.6
BEML
Buy
896
1,157
3,733
3,277
4,006
6.0
8.9
36.2
64.3
24.8
13.9
1.7
1.6
5.7
11.7
1.2
1.0
Bharat Electronics
Buy
1,147
1,414
27,523
7,737
8,634
16.8
17.2
54.0
61.5
21.2
18.7
3.0
2.7
39.3
45.6
2.7
2.3
Stock Watch
May 05, 2016
Company Name
Reco
CMP
Target
Mkt Cap
Sales ( Čcr )
OPM(%)
EPS (Č)
PER(x)
P/BV(x)
RoE(%)
EV/Sales(x)
(Č)
Price ( Č)
( Č cr )
FY16E
FY17E
FY16E
FY17E
FY16E
FY17E
FY16E
FY17E
FY16E
FY17E
FY16E
FY17E
FY16E
FY17E
Capital Goods
Voltas
Buy
291
353
9,640
5,363
5,963
8.0
9.1
11.0
13.8
26.5
21.1
4.1
3.6
16.2
17.9
1.7
1.6
BGR Energy
Neutral
112
-
805
3,615
3,181
9.5
9.4
16.7
12.4
6.7
9.0
0.6
0.6
10.0
7.0
0.6
0.8
BHEL
Neutral
120
-
29,322
33,722
35,272
10.8
11.7
10.5
14.2
11.4
8.4
0.8
0.8
7.0
9.0
0.9
0.9
Blue Star
Accumulate
421
481
3,786
3,548
3,977
6.3
6.9
13.7
17.2
30.7
24.5
7.7
5.0
26.1
25.4
1.2
1.0
Crompton Greaves
Neutral
57
-
3,563
13,484
14,687
4.9
6.2
4.5
7.1
12.6
8.0
0.9
0.8
7.2
10.8
0.4
0.4
Greaves Cotton
Neutral
133
-
3,247
1,655
1,755
16.6
16.8
7.4
7.8
18.0
17.0
3.6
3.4
21.1
20.6
1.9
1.8
Inox Wind
Buy
285
458
6,314
4,980
5,943
17.0
17.5
26.6
31.6
10.7
9.0
3.2
2.4
35.0
30.0
1.4
1.1
KEC International
Neutral
126
-
3,246
8,791
9,716
6.1
6.8
5.4
8.2
23.4
15.4
2.3
2.1
10.0
14.0
0.6
0.5
Thermax
Neutral
734
-
8,745
6,413
7,525
7.4
8.5
30.5
39.3
24.1
18.7
3.7
3.2
15.0
17.0
1.3
1.1
VATech Wabag
Neutral
585
-
3,186
2,722
3,336
7.9
8.1
19.5
24.6
30.0
23.8
3.1
2.8
11.1
12.4
1.3
1.0
Cement
ACC
Neutral
1,403
-
26,336
13,151
14,757
16.4
18.3
63.9
83.4
22.0
16.8
2.8
2.6
13.3
16.1
1.8
1.6
Ambuja Cements
Neutral
215
-
33,374
11,564
12,556
19.4
20.7
8.9
10.1
24.2
21.3
3.0
2.9
12.8
13.8
2.5
2.3
HeidelbergCement
Neutral
94
-
2,134
1,772
1,926
13.3
15.4
1.0
3.0
94.2
31.4
2.4
2.2
2.6
7.9
1.8
1.5
India Cements
Neutral
90
-
2,758
4,216
4,840
18.0
19.5
4.0
9.9
22.5
9.1
0.9
0.8
4.0
9.5
1.0
0.8
JK Cement
Neutral
585
-
4,087
3,661
4,742
10.1
15.8
7.5
28.5
77.9
20.5
2.3
2.1
7.5
22.9
1.6
1.2
J K Lakshmi Cement
Neutral
341
-
4,007
2,947
3,616
16.7
19.9
11.5
27.2
29.6
12.5
2.8
2.4
9.8
20.8
1.8
1.4
Mangalam Cements
Neutral
274
-
732
1,053
1,347
10.5
13.3
8.4
26.0
32.7
10.6
1.4
1.3
4.3
12.5
1.1
0.8
Orient Cement
Neutral
145
-
2,968
1,854
2,524
21.2
22.2
7.7
11.1
18.8
13.1
2.7
2.3
13.3
15.7
2.3
1.6
Ramco Cements
Neutral
482
-
11,469
4,036
4,545
20.8
21.3
15.1
18.8
31.9
25.6
3.9
3.5
12.9
14.3
3.4
2.9
Shree Cement^
Neutral
12,424
-
43,281
7,150
8,742
26.7
28.6
228.0
345.5
54.5
36.0
8.0
6.7
15.7
20.3
5.8
4.7
UltraTech Cement
Neutral
3,184
-
87,368
24,669
29,265
18.2
20.6
82.0
120.0
38.8
26.5
4.2
3.7
11.3
14.7
3.6
3.1
Construction
ITNL
Buy
74
93
2,447
7,360
8,825
34.0
35.9
7.0
9.0
10.6
8.3
0.4
0.3
3.2
3.7
3.7
3.6
KNR Constructions
Buy
523
603
1,472
937
1,470
14.3
14.0
44.2
38.6
11.8
13.6
2.4
2.0
15.4
15.4
1.7
1.1
Larsen & Toubro
Accumulate
1,246
1,310
116,111
58,870
65,708
8.3
10.3
42.0
53.0
29.7
23.5
2.1
1.9
8.8
11.2
2.2
2.0
Gujarat Pipavav Port
Neutral
169
-
8,153
629
684
51.0
52.2
6.4
5.9
26.4
28.6
3.5
3.2
15.9
12.7
12.6
11.4
MBL Infrastructures
Buy
143
285
594
2,313
2,797
12.2
14.6
19.0
20.0
7.6
7.2
0.8
0.7
11.3
10.6
1.0
0.9
Nagarjuna Const.
Neutral
76
-
4,222
7,892
8,842
8.8
9.1
3.0
5.3
25.3
14.3
1.3
1.2
5.0
8.5
0.8
0.7
PNC Infratech
Accumulate
524
558
2,689
1,873
2,288
13.2
13.5
24.0
32.0
21.8
16.4
2.1
1.9
12.1
12.3
1.5
1.3
Simplex Infra
Neutral
269
-
1,330
5,955
6,829
10.3
10.5
16.0
31.0
16.8
8.7
0.9
0.8
5.3
9.9
0.7
0.6
Stock Watch
May 05, 2016
Company Name
Reco
CMP
Target
Mkt Cap
Sales ( Čcr )
OPM(%)
EPS (Č)
PER(x)
P/BV(x)
RoE(%)
EV/Sales(x)
(Č)
Price ( Č)
( Č cr )
FY16E
FY17E
FY16E
FY17E
FY16E
FY17E
FY16E
FY17E
FY16E
FY17E
FY16E
FY17E
FY16E
FY17E
Construction
Power Mech Projects
Neutral
581
-
855
1,539
1,801
12.8
12.7
59.0
72.1
9.9
8.1
1.5
1.3
18.6
16.8
0.6
0.5
Sadbhav Engineering
Accumulate
254
289
4,355
3,481
4,219
10.7
10.8
8.2
11.7
31.0
21.7
3.0
2.6
10.3
13.5
1.5
1.3
NBCC
Accumulate
989
1,089
11,872
5,816
7,382
6.9
7.7
29.6
39.8
33.4
24.9
6.0
4.7
24.1
26.7
1.8
1.4
MEP Infra
Neutral
42
-
680
1,956
1,876
28.1
30.5
1.3
3.0
32.2
14.0
6.8
4.6
21.2
32.8
1.8
1.7
SIPL
Neutral
100
-
3,522
675
1,042
62.4
64.7
-
-
3.8
4.3
-
-
16.9
11.4
Engineers India
Neutral
172
-
5,795
1,667
1,725
13.5
16.0
9.7
11.4
17.7
15.1
2.1
2.0
11.7
13.4
2.3
2.3
Financials
Allahabad Bank
Neutral
54
-
3,287
8,569
9,392
2.8
2.9
16.3
27.5
3.3
2.0
0.3
0.2
7.6
11.9
-
-
Axis Bank
Accumulate
462
494
110,210
26,473
31,527
3.5
3.6
35.7
43.5
12.9
10.6
2.2
1.9
17.9
18.9
-
-
Bank of Baroda
Neutral
149
-
34,263
18,485
21,025
1.9
2.0
13.5
21.1
11.1
7.0
0.9
0.8
7.3
10.6
-
-
Bank of India
Neutral
86
-
6,998
15,972
17,271
1.9
2.0
15.3
33.4
5.6
2.6
0.3
0.2
3.6
7.6
-
-
Canara Bank
Neutral
189
-
10,279
15,441
16,945
2.0
2.1
46.6
70.4
4.1
2.7
0.4
0.3
8.0
11.2
-
-
Dena Bank
Neutral
29
-
1,931
3,440
3,840
2.1
2.3
7.3
10.0
4.0
2.9
0.3
0.3
6.1
7.9
-
-
Dewan Housing Finance Buy
198
270
5,778
1,892
2,277
2.9
2.9
25.9
30.8
7.6
6.4
1.2
1.0
15.3
15.9
-
-
Federal Bank
Neutral
49
-
8,392
3,477
3,999
3.0
3.0
5.0
6.2
9.7
7.8
1.0
0.9
10.6
11.9
-
-
HDFC
Neutral
1,131
-
178,680
10,358
11,852
3.3
3.3
41.1
47.0
27.5
24.1
5.2
4.8
24.7
24.9
-
-
HDFC Bank
Accumulate
1,127
1,262
285,146
38,309
47,302
4.3
4.3
49.3
61.1
22.9
18.5
4.0
3.4
18.5
19.7
-
-
ICICI Bank
Buy
215
254
124,880
34,279
39,262
3.3
3.3
21.0
24.4
10.2
8.8
1.7
1.5
14.4
14.7
-
-
IDBI Bank
Neutral
67
-
13,753
9,625
10,455
1.8
1.8
8.5
14.2
7.8
4.7
0.5
0.4
5.9
9.3
-
-
Indian Bank
Neutral
95
-
4,556
6,160
6,858
2.5
2.5
24.5
29.8
3.9
3.2
0.3
0.3
7.7
8.6
-
-
LIC Housing Finance
Buy
451
592
22,780
3,101
3,745
2.5
2.5
33.0
40.2
13.7
11.2
2.6
2.2
19.7
20.5
-
-
Oriental Bank
Neutral
84
-
2,709
7,643
8,373
2.4
2.4
37.2
45.4
2.3
1.9
0.2
0.2
8.2
9.4
-
-
Punjab Natl.Bank
Neutral
81
-
15,954
23,638
26,557
2.8
2.8
17.9
27.2
4.5
3.0
0.5
0.4
8.5
12.0
-
-
South Ind.Bank
Neutral
18
-
2,390
1,965
2,185
2.5
2.5
2.5
3.3
7.1
5.4
0.7
0.6
9.5
11.7
-
-
St Bk of India
Neutral
180
-
139,808
79,958
86,061
2.6
2.6
13.4
20.7
13.5
8.7
1.1
1.0
11.5
12.8
-
-
Union Bank
Neutral
118
-
8,105
12,646
14,129
2.3
2.4
31.0
39.1
3.8
3.0
0.4
0.4
9.8
11.4
-
-
Vijaya Bank
Neutral
31
-
2,928
3,536
3,827
1.9
1.9
5.5
6.7
5.7
4.7
0.5
0.4
7.8
8.8
-
-
Yes Bank
Neutral
918
-
38,613
7,190
9,011
3.2
3.3
58.2
69.7
15.8
13.2
2.8
2.4
19.2
19.6
-
-
FMCG
Asian Paints
Neutral
873
-
83,752
16,553
19,160
16.0
16.2
17.7
21.5
49.4
40.6
13.1
11.8
29.4
31.2
4.9
4.2
Britannia
Neutral
2,818
-
33,812
8,481
9,795
14.0
14.1
65.5
78.3
43.0
36.0
20.4
16.7
38.3
41.2
3.9
3.4
Stock Watch
May 05, 2016
Company Name
Reco
CMP
Target
Mkt Cap
Sales ( Čcr )
OPM(%)
EPS (Č)
PER(x)
P/BV(x)
RoE(%)
EV/Sales(x)
(Č)
Price ( Č)
( Č cr )
FY16E FY17E
FY16E
FY17E
FY16E
FY17E
FY16E
FY17E
FY16E
FY17E
FY16E
FY17E
FY16E
FY17E
FMCG
Colgate
Neutral
844
-
22,954
4,136
4,632
22.5
23.3
22.2
25.3
38.0
33.4
23.1
20.6
68.6
67.5
5.4
4.8
Dabur India
Neutral
282
-
49,634
9,370
10,265
17.6
17.3
7.3
8.1
38.5
34.8
10.0
9.1
31.7
30.6
5.1
4.7
GlaxoSmith Con*
Neutral
5,869
-
24,681
4,519
5,142
19.6
19.8
164.3
191.2
35.7
30.7
9.9
8.4
30.8
29.9
4.9
4.3
Godrej Consumer
Neutral
1,336
-
45,487
9,003
10,335
18.1
18.7
34.1
41.8
39.2
32.0
8.5
7.3
23.9
24.8
5.2
4.5
HUL
Neutral
854
-
184,714
33,299
35,497
17.1
17.1
18.9
20.0
45.2
42.7
22.9
26.3
87.6
80.8
5.4
5.0
ITC
Accumulate
313
359
251,717
36,804
38,776
37.9
37.9
12.2
12.9
25.6
24.3
7.1
6.3
27.7
25.8
6.4
6.1
Marico
Neutral
251
-
32,357
6,151
6,966
17.2
17.3
5.4
6.4
46.4
39.2
14.6
11.5
33.2
32.4
5.1
4.5
Nestle*
Neutral
5,554
-
53,554
9,393
10,507
22.2
22.3
106.8
121.8
52.0
45.6
18.3
16.4
34.8
36.7
5.5
4.9
Tata Global
Buy
117
137
7,381
8,635
9,072
9.8
9.9
5.8
7.2
20.2
16.2
1.8
1.7
6.8
7.4
0.9
0.8
Procter & Gamble
Buy
6,385
7,369
20,726
2,588
2,939
23.3
23.2
130.2
146.2
49.0
43.7
97.8
93.8
27.6
25.3
7.6
6.6
Hygiene
IT
HCL Tech^
Buy
737
1,038
103,923
42,038
47,503
21.2
21.5
51.5
57.7
14.3
12.8
3.1
2.4
21.5
18.8
2.1
1.6
Infosys
Buy
1,190
1,374
274,125
62,441
70,558
27.5
27.5
59.0
65.3
20.2
18.2
4.1
3.7
22.2
22.4
3.8
3.3
TCS
Buy
2,478
3,004
488,321
108,646
122,770
28.3
28.3
123.7
141.0
20.0
17.6
6.6
6.1
33.1
34.6
4.0
3.5
Tech Mahindra
Accumulate
467
530
45,284
26,524
29,177
16.2
17.0
28.8
33.6
16.2
13.9
3.1
2.7
19.3
19.1
1.5
1.3
Wipro
Buy
540
680
133,369
50,808
56,189
23.7
23.8
37.3
40.7
14.5
13.3
2.8
2.5
19.2
17.7
2.1
1.7
Media
D B Corp
Accumulate
331
356
6,084
2,025
2,187
27.4
27.4
17.4
18.9
19.0
17.6
4.3
3.9
22.9
23.7
3.0
2.8
HT Media
Neutral
87
-
2,019
2,495
2,673
12.9
13.2
6.8
7.2
12.8
12.1
1.0
0.9
7.5
7.8
0.4
0.3
Jagran Prakashan
Buy
166
205
5,441
2,170
2,355
27.2
26.2
8.9
9.9
18.7
16.8
3.9
3.4
20.9
20.5
2.4
2.2
Sun TV Network
Neutral
351
-
13,848
2,510
2,763
71.8
71.5
21.9
24.8
16.1
14.2
3.8
3.4
22.8
24.3
5.0
4.5
Hindustan Media
Neutral
267
-
1,959
914
1,016
21.7
21.5
21.9
23.3
12.2
11.5
2.2
1.9
18.0
16.2
1.6
1.3
Ventures
Metals & Mining
Coal India
Buy
280
380
176,763
76,167
84,130
19.9
22.3
22.4
25.8
12.5
10.8
4.5
4.4
35.5
41.0
1.7
1.5
Hind. Zinc
Accumulate
166
175
69,971
14,641
14,026
50.4
50.4
17.7
16.0
9.4
10.4
1.4
1.3
16.2
13.2
2.4
2.3
Hindalco
Neutral
91
-
18,853
104,356
111,186
8.7
9.5
6.7
11.1
13.6
8.3
0.5
0.5
3.5
5.9
0.7
0.6
JSW Steel
Neutral
1,319
-
31,889
42,308
45,147
16.4
20.7
(10.3)
49.5
26.7
1.5
1.4
(1.0)
5.6
1.8
1.7
NMDC
Neutral
93
-
37,030
8,237
10,893
46.6
44.5
10.0
11.7
9.4
8.0
1.0
0.9
12.5
13.0
4.3
3.3
SAIL
Neutral
42
-
17,429
45,915
53,954
7.2
10.5
1.5
4.4
28.0
9.6
0.4
0.4
2.3
4.1
1.0
0.9
Vedanta
Neutral
105
-
31,026
71,445
81,910
26.2
26.3
12.9
19.2
8.1
5.5
0.6
0.5
7.2
8.9
0.9
0.7
Tata Steel
Neutral
329
-
31,948
126,760
137,307
8.9
11.3
6.4
23.1
51.7
14.3
1.0
1.0
2.0
7.1
0.8
0.8
Oil & Gas
Cairn India
Neutral
138
-
25,779
11,323
12,490
49.4
51.0
20.7
20.7
6.6
6.7
0.4
0.4
6.4
6.1
1.3
0.7
Stock Watch
May 05, 2016
Company Name
Reco
CMP
Target
Mkt Cap
Sales ( Čcr )
OPM(%)
EPS (Č)
PER(x)
P/BV(x)
RoE(%)
EV/Sales(x)
(Č)
Price ( Č)
( Č cr )
FY16E FY17E
FY16E
FY17E
FY16E
FY17E
FY16E
FY17E
FY16E
FY17E
FY16E
FY17E
FY16E
FY17E
Oil & Gas
GAIL
Neutral
365
-
46,268
64,856
70,933
9.1
9.6
24.0
28.9
15.2
12.6
1.3
1.2
8.8
9.6
0.9
0.8
ONGC
Neutral
211
-
180,179
154,564
145,998
36.8
37.4
20.8
22.6
10.1
9.3
1.0
0.9
10.1
9.7
1.4
1.5
Petronet LNG
Neutral
279
-
20,929
29,691
31,188
5.8
6.2
12.8
13.4
21.8
20.8
3.3
2.9
15.8
14.8
0.8
0.7
Indian Oil Corp
Accumulate
413
455
100,214
359,607
402,760
5.9
6.1
42.5
48.7
9.7
8.5
1.3
1.2
14.1
14.4
0.4
0.3
Reliance Industries
Buy
978
1,150
316,747
304,775
344,392
12.6
13.4
91.3
102.6
10.7
9.5
1.2
1.1
11.8
12.0
1.0
0.8
Pharmaceuticals
Alembic Pharma
Neutral
600
-
11,302
3,274
3,802
26.9
19.4
35.0
28.7
17.1
20.9
7.6
5.7
55.6
31.2
3.4
2.9
Aurobindo Pharma
Accumulate
812
856
47,542
14,923
17,162
22.0
23.0
35.7
42.8
22.8
19.0
6.7
5.0
34.0
30.2
3.6
3.0
Aventis*
Neutral
4,410
-
10,156
2,082
2,371
17.4
20.8
118.2
151.5
37.3
29.1
5.5
4.4
19.9
25.5
4.6
3.8
Cadila Healthcare
Accumulate
322
352
32,990
10,224
11,840
21.0
22.0
14.6
17.6
22.1
18.3
6.1
4.7
30.8
29.0
3.3
2.8
Cipla
Accumulate
533
605
42,849
13,979
16,447
20.2
18.6
25.7
27.5
20.8
19.4
3.4
2.9
17.6
16.1
3.1
2.5
Dr Reddy's
Buy
2,933
3,933
50,017
16,838
19,575
25.0
23.1
167.5
178.8
17.5
16.4
3.7
3.1
23.1
20.4
2.9
2.4
Dishman Pharma
Neutral
165
-
2,666
1,733
1,906
21.5
21.5
17.0
19.9
9.7
8.3
1.0
0.9
10.5
11.2
2.1
1.8
GSK Pharma*
Neutral
3,623
-
30,690
2,870
3,158
20.0
22.1
59.5
68.3
60.9
53.1
18.0
18.5
28.5
34.3
10.2
9.3
Indoco Remedies
Neutral
271
-
2,495
1,033
1,199
15.9
18.2
9.4
13.6
28.8
19.9
4.3
3.6
15.7
19.7
2.5
2.2
Ipca labs
Buy
487
900
6,138
3,363
3,909
12.9
18.6
13.4
28.0
36.3
17.4
2.6
2.3
7.4
14.0
2.1
1.8
Lupin
Neutral
1,578
-
71,136
13,092
16,561
25.0
27.0
50.4
68.3
31.3
23.1
6.5
5.1
22.8
24.7
5.2
4.0
Sun Pharma
Buy
803
950
193,195
28,163
32,610
25.8
30.7
17.4
26.9
46.1
29.8
4.4
3.8
13.0
16.6
6.3
5.3
Power
Tata Power
Neutral
70
-
19,041
35,923
37,402
22.6
22.8
4.1
5.2
17.4
13.7
1.3
1.2
7.5
9.3
1.5
1.4
NTPC
Accumulate
139
146
114,200
87,271
99,297
23.5
23.5
11.8
13.3
11.8
10.4
1.3
1.2
11.5
12.2
2.3
2.1
Power Grid
Buy
143
170
74,759
20,702
23,361
86.7
86.4
12.1
13.2
11.8
10.8
1.7
1.6
15.6
15.1
8.5
7.9
Real Estate
MLIFE
Buy
429
554
1,760
697
1,011
14.9
19.3
13.8
20.1
31.1
21.3
1.2
1.1
3.8
5.3
3.8
2.6
Telecom
Bharti Airtel
Neutral
361
-
144,226
101,748
109,191
32.1
31.7
12.0
12.5
30.1
28.9
2.1
1.9
6.9
6.7
2.1
1.9
Idea Cellular
Neutral
120
-
43,062
34,282
36,941
32.0
31.5
5.9
6.2
20.3
19.3
1.9
1.7
9.9
9.3
1.8
1.7
zOthers
Abbott India
Neutral
4,706
-
9,999
2,715
3,153
14.5
14.1
134.3
152.2
35.1
30.9
8.7
7.2
27.4
25.6
3.4
2.9
Bajaj Electricals
Neutral
228
-
2,297
4,719
5,287
5.2
5.8
8.6
12.7
26.6
18.0
3.0
2.7
11.4
14.8
0.5
0.4
Finolex Cables
Neutral
279
-
4,266
2,520
2,883
12.2
12.0
12.7
14.2
22.0
19.7
3.0
2.7
13.6
13.5
1.4
1.2
Goodyear India*
Buy
496
582
1,144
1,800
1,600
11.7
11.5
58.7
52.9
8.5
9.4
1.9
1.6
24.6
18.7
0.4
0.4
Hitachi
Neutral
1,358
-
3,693
1,779
2,081
7.8
8.8
21.8
33.4
62.3
40.6
10.1
8.1
17.4
22.1
2.1
1.8
Jyothy Laboratories
Neutral
293
-
5,309
1,620
1,847
11.5
11.5
7.3
8.5
40.2
34.6
5.2
4.8
13.3
14.4
3.1
2.7
Stock Watch
May 05, 2016
Company Name
Reco
CMP
Target
Mkt Cap
Sales ( Čcr )
OPM(%)
EPS (Č)
PER(x)
P/BV(x)
RoE(%)
EV/Sales(x)
(Č)
Price ( Č)
( Č cr )
FY16E
FY17E
FY16E
FY17E
FY16E
FY17E
FY16E
FY17E
FY16E
FY17E
FY16E
FY17E
FY16E
FY17E
zOthers
MRF
Buy
33,680
45,575
14,284
20,316
14,488
21.4
21.1
5,488.0
3,798.0
6.1
8.9
2.1
1.7
41.1
21.2
0.7
0.9
Page Industries
Neutral
12,650
-
14,109
1,929
2,450
19.8
20.1
229.9
299.0
55.0
42.3
24.3
16.9
52.1
47.1
7.3
5.8
Relaxo Footwears
Neutral
491
-
5,889
1,767
2,152
12.3
12.5
19.3
25.1
25.5
19.6
6.3
4.8
27.7
27.8
3.4
2.8
Siyaram Silk Mills
Buy
1,054
1,354
988
1,636
1,815
11.5
11.5
89.9
104.1
11.7
10.1
1.9
1.7
17.9
17.8
0.8
0.7
Styrolution ABS India* Neutral
620
-
1,090
1,271
1,440
8.6
9.2
32.0
41.1
19.4
15.1
2.0
1.8
10.7
12.4
0.8
0.7
TVS Srichakra
Buy
2,336
3,217
1,788
2,035
2,252
15.9
15.3
248.6
268.1
9.4
8.7
4.1
3.0
43.6
33.9
0.9
0.8
HSIL
Neutral
302
-
2,181
2,123
2,384
16.1
16.5
15.0
18.9
20.1
16.0
1.6
1.5
8.0
9.4
1.4
1.2
Kirloskar Engines India
Neutral
228
-
3,297
2,403
2,554
8.6
9.9
9.2
10.5
24.8
21.7
2.4
2.3
9.7
10.7
1.0
0.9
Ltd
M M Forgings
Buy
479
614
578
511
615
21.7
21.6
43.1
55.8
11.1
8.6
2.0
1.7
19.9
21.2
1.3
1.0
Banco Products (India) Neutral
129
-
925
1,208
1,353
11.0
12.3
10.8
14.5
12.0
8.9
1.4
1.2
11.9
14.5
0.7
0.6
Competent Automobiles Neutral
152
-
93
1,040
1,137
3.2
3.1
25.7
28.0
5.9
5.4
0.9
0.8
15.0
14.3
0.1
0.1
Nilkamal
Neutral
1,245
-
1,857
1,871
2,031
10.7
10.5
63.2
69.8
19.7
17.8
3.2
2.8
17.6
16.6
1.0
0.9
Visaka Industries
Buy
119
143
189
1,020
1,120
8.7
9.1
13.9
20.1
8.6
5.9
0.6
0.5
6.4
8.7
0.4
0.4
Transport Corporation of
Neutral
262
-
1,992
2,830
3,350
8.8
9.0
14.4
18.3
18.2
14.3
2.8
2.4
15.4
17.1
0.8
0.7
India
Elecon Engineering
Neutral
62
-
673
1,359
1,482
10.3
13.7
0.8
3.9
77.0
15.9
1.3
1.2
1.6
7.8
0.9
0.8
Surya Roshni
Buy
146
201
640
2,992
3,223
8.1
8.4
14.7
18.3
9.9
8.0
0.9
0.8
9.7
11.0
0.5
0.5
MT Educare
Neutral
160
-
639
286
366
18.3
17.7
7.7
9.4
20.8
17.1
4.4
3.8
20.2
21.1
2.1
1.6
Radico Khaitan
Buy
88
156
1,174
1,517
1,635
12.7
13.4
5.8
7.1
15.2
12.4
1.3
1.2
8.6
9.6
1.3
1.1
Garware Wall Ropes
Buy
338
473
739
862
974
11.2
11.2
24.9
29.6
13.6
11.4
2.1
1.8
15.1
15.4
0.9
0.7
Wonderla Holidays
Neutral
384
-
2,168
206
308
44.0
43.6
9.0
12.9
42.6
29.7
5.8
5.3
13.7
17.8
10.4
6.9
Linc Pen & Plastics
Neutral
189
-
280
340
371
8.3
8.9
10.8
13.2
17.5
14.4
2.8
2.5
16.0
17.1
0.9
0.8
The Byke Hospitality
Neutral
152
-
608
222
287
20.5
20.5
5.6
7.6
26.9
20.1
5.1
4.2
18.9
20.8
2.8
2.1
Interglobe Aviation
Neutral
1,068
-
38,472
17,022
21,122
20.7
14.5
63.9
53.7
16.7
19.9
25.0
20.5
149.9
103.2
2.3
1.8
Coffee Day Enterprises
Neutral
254
-
5,237
2,692
2,964
17.0
18.6
-
4.7
-
53.6
3.1
2.9
0.2
5.5
2.3
2.2
Ltd
Navneet Education
Neutral
88
-
2,088
998
1,062
24.1
24.0
5.8
6.1
15.2
14.4
3.4
3.0
22.0
20.6
2.2
2.0
Navkar Corporation
Buy
178
265
2,544
365
436
38.3
37.5
5.6
5.9
31.6
30.4
2.0
1.9
6.3
6.1
7.8
6.7
UFO Moviez
Neutral
515
-
1,416
558
619
32.0
33.2
22.5
30.0
22.9
17.2
2.8
2.4
12.0
13.8
2.4
2.0
VRL Logistics
Neutral
389
-
3,546
1,725
1,902
16.5
16.7
12.2
14.6
31.9
26.7
6.6
5.8
20.8
21.9
2.2
2.0
Team Lease Serv.
Neutral
931
-
1,591
2,565
3,229
1.3
1.5
15.2
22.8
61.3
40.9
4.9
4.4
8.0
10.7
0.5
0.4
Stock Watch
May 05, 2016
Company Name
Reco
CMP
Target Mkt Cap
Sales ( Čcr )
OPM(%)
EPS (Č)
PER(x)
P/BV(x)
RoE(%)
EV/Sales(x)
(Č)
Price ( Č)
( Č cr )
FY16E FY17E FY16E FY17E FY16E FY17E FY16E FY17E FY16E FY17E FY16E FY17E FY16E FY17E
zOthers
S H Kelkar & Co.
Neutral
225
-
3,254
928
1,036
15.3
15.1
4.9
6.1
45.6
36.9
4.3
3.9
9.4
10.7
3.4
3.0
Quick Heal
Neutral
262
-
1,835
339
408
27.8
27.3
7.1
7.7
37.1
33.8
3.1
3.1
8.5
9.3
4.3
3.6
Narayana Hrudaya
Neutral
289
-
5,915
1,603
1,873
10.9
11.5
1.0
2.6
303.8
109.4
7.3
6.7
2.4
6.1
3.8
3.3
Manpasand Bever.
Neutral
530
-
2,653
540
836
19.9
19.6
10.2
16.9
51.7
31.4
4.2
3.8
8.1
12.0
4.6
2.9
Source: Company, Angel Research; Note: *December year end; #September year end; &October year end; Price as on May 04, 2016
Market Outlook
May 05, 2016
Research Team Tel: 022 - 39357800
DISCLAIMER
Angel Broking Private Limited (hereinafter referred to as “Angel”) is a registered Member of National Stock Exchange of India Limited,
Bombay Stock Exchange Limited and Metropolitian Stock Exchange of India Limited. It is also registered as a Depository Participant with
CDSL and Portfolio Manager with SEBI. It also has registration with AMFI as a Mutual Fund Distributor. Angel Broking Private Limited is a
registered entity with SEBI for Research Analyst in terms of SEBI (Research Analyst) Regulations, 2014 vide registration number
INH000000164. Angel or its associates has not been debarred/ suspended by SEBI or any other regulatory authority for accessing
/dealing in securities Market. Angel or its associates including its relatives/analyst do not hold any financial interest/beneficial ownership
of more than 1% in the company covered by Analyst. Angel or its associates/analyst has not received any compensation / managed or co
-managed public offering of securities of the company covered by Analyst during the past twelve months. Angel/analyst has not served as
an officer, director or employee of company covered by Analyst and has not been engaged in market making activity of the company
covered by Analyst.
This document is solely for the personal information of the recipient, and must not be singularly used as the basis of any investment
decision. Nothing in this document should be construed as investment or financial advice. Each recipient of this document should make
such investigations as they deem necessary to arrive at an independent evaluation of an investment in the securities of the companies
referred to in this document (including the merits and risks involved), and should consult their own advisors to determine the merits and
risks of such an investment.
Reports based on technical and derivative analysis center on studying charts of a stock's price movement, outstanding positions and
trading volume, as opposed to focusing on a company's fundamentals and, as such, may not match with a report on a company's
fundamentals.
The information in this document has been printed on the basis of publicly available information, internal data and other reliable sources
believed to be true, but we do not represent that it is accurate or complete and it should not be relied on as such, as this document is for
general guidance only. Angel Broking Pvt. Limited or any of its affiliates/ group companies shall not be in any way responsible for any
loss or damage that may arise to any person from any inadvertent error in the information contained in this report. Angel Broking Pvt.
Limited has not independently verified all the information contained within this document. Accordingly, we cannot testify, nor make any
representation or warranty, express or implied, to the accuracy, contents or data contained within this document. While Angel Broking
Pvt. Limited endeavors to update on a reasonable basis the information discussed in this material, there may be regulatory, compliance,
or other reasons that prevent us from doing so.
This document is being supplied to you solely for your information, and its contents, information or data may not be reproduced,
redistributed or passed on, directly or indirectly.
Neither Angel Broking Pvt. Limited, nor its directors, employees or affiliates shall be liable for any loss or damage that may arise from or
in connection with the use of this information.
Note: Please refer to the important ‘Stock Holding Disclosure' report on the Angel website (Research Section). Also, please refer to the
latest update on respective stocks for the disclosure status in respect of those stocks. Angel Broking Pvt. Limited and its affiliates may have
investment positions in the stocks recommended in this report.