Market Outlook
April 5, 2016
Market Cues
Domestic Indices
Chg (%)
(Pts)
(Close)
Indian markets are expected to open on a negative note tracking the SGX Nifty and
BSE Sensex
0.5
130
25,400
Asian markets.
Nifty
0.6
46
7,759
U.S. markets fell Monday amid mounting speculation the Federal Reserve will raise
Mid Cap
0.2
26
10,668
interest rates before summer.
Small Cap
0.5
55
10,695
Bankex
0.0
5
18,450
European stock markets bounced back yesterday as positive eurozone data and
expectations of low US interest rates for some time helped offset renewed concerns
over a weak Japanese economy.
Global Indices
Chg (%)
(Pts)
(Close)
Indian markets posted modest gains on Monday on the back of positive global cues
Dow Jones
(0.3)
(56)
17,737
and renewed capital inflows from foreign investors. RBI is set to announce its first bi-
Nasdaq
(0.5)
(23)
4,892
monthly monetary policy statement today at 11am. RBI is widely expected to cut
FTSE
0.3
19
6,165
interest rates by at least a quarter of a percentage point on the back of the Union
Nikkei
(0.3)
(41)
16,123
Budget's fiscal prudence measures and low inflation.
Hang Seng
(1.3)
(278)
20,499
News & Result Analysis
Shanghai Com
0.2
6
3,010
L&T Hydrocarbon Engineering bags `650cr contract
NTPC JV takes over Patratu power plant
Advances / Declines
BSE
NSE
Detailed analysis on Pg2
Advances
1,638
990
Investor’s Ready Reckoner
Declines
983
572
Key Domestic & Global Indicators
Unchanged
137
63
Stock Watch: Latest investment recommendations on 150+ stocks
Refer Pg5 onwards
Volumes (` Cr)
BSE
2,060
Top Picks
CMP
Target
Upside
NSE
14,032
Company
Sector
Rating
(`)
(`)
(%)
Amara Raja
Auto & Auto Ancillary
Buy
904
1,040
15.1
Net Inflows (` Cr)
Net
Mtd
Ytd
HCL Tech
IT
Buy
840
1,038
23.6
FII
4,509
27,358
(12,082)
LIC Housing
Financials
Buy
487
592
21.6
MFs
(92)
(8,054)
66,893
Bharat Electronics
Capital Goods
Buy
1,206
1,414
17.3
Navkar Corporation Others
Buy
185
265
43.6
More Top Picks on Pg3
Top Gainers
Price (`)
Chg (%)
Idea
113
6.0
Key Upcoming Events
Gppl
184
5.9
Previous
Consensus
Date
Region
Event Description
Reading
Expectations
Adanient
80
5.9
Apr 5 India
RBI Repo Rate%
6.75
6.50
Gsfc
70
5.8
Apr 7 US
Initial Jobless claims
276.00
270.00
Dbcorp
327
5.8
Apr 8 India
Import (yoy %)
5.00
-
Apr 8 India
Export (yoy %)
5.66
-
6.(6.(
Top Losers
Price (`)
Chg (%)
More Events on Pg4
Hexaware
253
(6.6)
Den
93
(5.7)
Federalbnk
45
(3.9)
Mphasis
454
(2.8)
Bayercrop
3,675
(2.5)
As on April 04, 2016
Market Outlook
April 5, 2016
L&T Hydrocarbon Engineering bags `650cr contract
L&T Hydrocarbon Engineering (LTHE), a subsidiary of Larsen & Toubro, has
bagged an onshore EPC contract of over `650cr from Gujarat State Fertilisers and
Chemicals (GSFC).
The contract is for setting up 40,000-mtpa Melamine Plant at Fertiliser Nagar,
Vadodara. Under the contract, LTHE will carry out extended-basis engineering,
detailed engineering, procurement, supply, transportation, storage, fabrication,
inspection, construction, installation, testing, mechanical completion, pre-
commissioning and commissioning of the unit. GSFC has appointed Casale SA as
technology licensor, who is providing the process technology for the plant.
NTPC JV takes over Patratu power plant
Jharkhand handed over assets of Patratu Thermal Power Station (PTPS) to a joint
venture company of NTPCBSE and the state government.
Terming it a big step in the direction of power generation in Jharkhand to attain
self sufficiency, Jharkhand Bijli Vitran Nigam MD Rahul Purwar said the resources,
including the PTPS plant, were handed over to the JV for setting up 8,000 MW new
thermal power unit in two phases.
NTPC in October last incorporated Patratu Vidyut Utpadan Nigam in a joint
venture with Jharkhand Bijli Vitran Nigam Ltd for operating the PTPS plant in the
state. NTPC holds 74% stake in the JV while the rest is with the state government.
The JV will renovate and modernise the performing existing units and further
capacity expansion of PTPS Jharkhand would get 85% power from the JV as per
the MoU. Patratu plant at present has a power generation capacity of 800 MW.
Economic and Political News
GDP growth to remain flat at 7.4% in FY17: HSBC
Telecom Min to approach Cabinet for reducing spectrum charges
FM Arun Jaitley wants focus on irrigation projects for immediate results
Corporate News
Fitch Ratings downgrades Sajjan Jindal-led JSW Steel
Cox & Kings sells 2 entities to Malvern; will hold 49% in it
ICICI Bank tweaks corporate lending norms to trim NPAs
Market Outlook
April 5, 2016
Top Picks ★★★★★
Large Cap
Market Cap
CMP
Target
Upside
Company
Rationale
(` Cr)
(`)
(`)
(%)
To outpace battery industry growth due to better technological
Amara Raja Batteries
15,433
904
1,040
15.1
products leading to market share gains in both the automotive
OEM and replacement segments.
Uptick in defense capex by government when coupled with
Bharat Electronics
28,942
1,206
1,414
17.3
BELs strong market positioning, indicate that good times are
ahead for BEL.
The stock is trading at attractive valuations and is factoring all
HCL Tech
1,18,444
840
1,038
23.6
the bad news.
Strong visibility for a robust 20% earnings trajectory, coupled
HDFC Bank
2,70,339
1,069
1,262
18.0
with high quality of earnings on account of high quality retail
business and strategic focus on highly rated corporates.
Back on the growth trend, expect a long term growth of 14%
Infosys
2,86,569
1,244
1,347
8.3
to be a US$20bn in FY2020.
LICHF continues to grow its retail loan book at a healthy pace
with improvement in asset quality. We expect the company to
LIC Housing Finance
24,564
487
592
21.6
post a healthy loan book which is likely to reflect in a strong
earnings growth.
Huge bid pipeline of re-development works at Delhi and other
NBCC
11,456
955
1,089
14.1
State Governments and opportunity from Smart City, positions
NBCC to report strong growth, going forward.
Source: Company, Angel Research
Mid Cap
Market Cap
CMP
Target
Upside
Company
Rationale
(` Cr)
(`)
(`)
(%)
Favorable outlook for the AC industry to augur well for
Cooling products business which is out pacing the market
Blue Star
3,544
394
439
11.4
growth. EMPPAC division's profitability to improve once
operating environment turns around.
Commencement of new projects, downtrend in the interest rate
IL&FS Transport
2,477
75
93
23.5
cycle, to lead to stock re-rating
Economic recovery to have favourable impact on advertising &
circulation revenue growth. Further, the acquisition of a radio
Jagran Prakashan
5,188
159
189
19.1
business (Radio City) would also boost the company's revenue
growth.
Speedier execution and speedier sales, strong revenue visibilty
Mahindra Lifespace
1,768
431
554
28.6
in short-to-long run, attractive valuations
Massive capacity expansion along with rail advantage at ICD
Navkar Corporation
2,631
185
265
43.6
as well CFS augurs well for the company
Earnings boost on back of stable material prices and
Radico Khaitan
1,294
97
156
60.4
favourable pricing environment. Valuation discount to peers
provides additional comfort
Strong brands and distribution network would boost growth
Siyaram Silk Mills
943
1,006
1,354
34.6
going ahead. Stock currently trades at an inexpensive
valuation.
Source: Company, Angel Research
Market Outlook
April 05, 2016
Key Upcoming Events
Global economic events release calendar
Date
Time
Country
Event Description
Unit
Period
Bloomberg Data
Last Reported Estimated
Apr 5, 2016
1:25PM
Germany
PMI Services
Value
Mar F
55.50
55.50
11:00AM
India
RBI Reverse Repo rate
%
Apr 5
5.75
5.50
11:00AM
India
RBI Repo rate
%
Apr 5
6.75
6.50
11:00AM
India
RBI Cash Reserve ratio
%
Apr 5
4.00
4.00
Apr 7, 2016
6:00PM
US
Initial Jobless claims
Thousands
Apr 2
276.00
270.00
Apr 8, 2016
India
Imports YoY%
% Change
Mar
(5.00)
--
India
Exports YoY%
% Change
Mar
(5.66)
--
2:00PM
UK
Industrial Production (YoY)
% Change
Feb
0.20
--
Apr 11, 2016
7:00AM
China
Consumer Price Index (YoY)
% Change
Mar
2.30
2.50
Apr 12, 2016
2:00PM
UK
CPI (YoY)
% Change
Mar
0.30
--
5:30PM
India
Industrial Production YoY
% Change
Feb
(1.50)
--
Apr 13, 2016
US
Producer Price Index (mom)
% Change
Mar
(0.60)
--
China
Exports YoY%
% Change
Mar
(25.40)
3.30
Apr 14, 2016
12:00PM
India
Monthly Wholesale Prices YoY%
% Change
Mar
(0.91)
--
6:00PM
US
Consumer price index (mom)
% Change
Mar
(0.20)
0.20
2:30PM
Euro Zone
Euro-Zone CPI (YoY)
%
Mar F
(0.10)
--
4:30PM
UK
BOE Announces rates
% Ratio
Apr 14
0.50
0.50
Apr 15, 2016
6:45PM
US
Industrial Production
%
Mar
(0.52)
(0.05)
7:30AM
China
Industrial Production (YoY)
% Change
Mar
5.90
--
7:30AM
China
Real GDP (YoY)
% Change
1Q
6.80
--
Apr 19, 2016
6:00PM
US
Housing Starts
Thousands
Mar
1,178.00
--
6:00PM
US
Building permits
Thousands
Mar
1,177.00
--
Apr 20, 2016
7:30PM
US
Existing home sales
Million
Mar
5.08
--
2:00PM
UK
Jobless claims change
% Change
Mar
(18.00)
--
Apr 21, 2016
7:30PM
Euro Zone
Euro-Zone Consumer Confidence
Value
Apr A
(9.70)
--
5:15PM
Euro Zone
ECB announces interest rates
%
Apr 21
--
--
Apr 22, 2016
1:00PM
Germany
PMI Manufacturing
Value
Apr P
50.70
--
Apr 25, 2016
7:30PM
US
New home sales
Thousands
Mar
512.00
--
Apr 26, 2016
7:30PM
US
Consumer Confidence
S.A./ 1985=100
Apr
96.20
--
Apr 27, 2016
2:00PM
UK
GDP (YoY)
% Change
1Q A
2.10
--
11:30PM
US
FOMC rate decision
%
Apr 27
0.50
0.50
Source: Bloomberg, Angel Research
Market Outlook
April 5, 2016
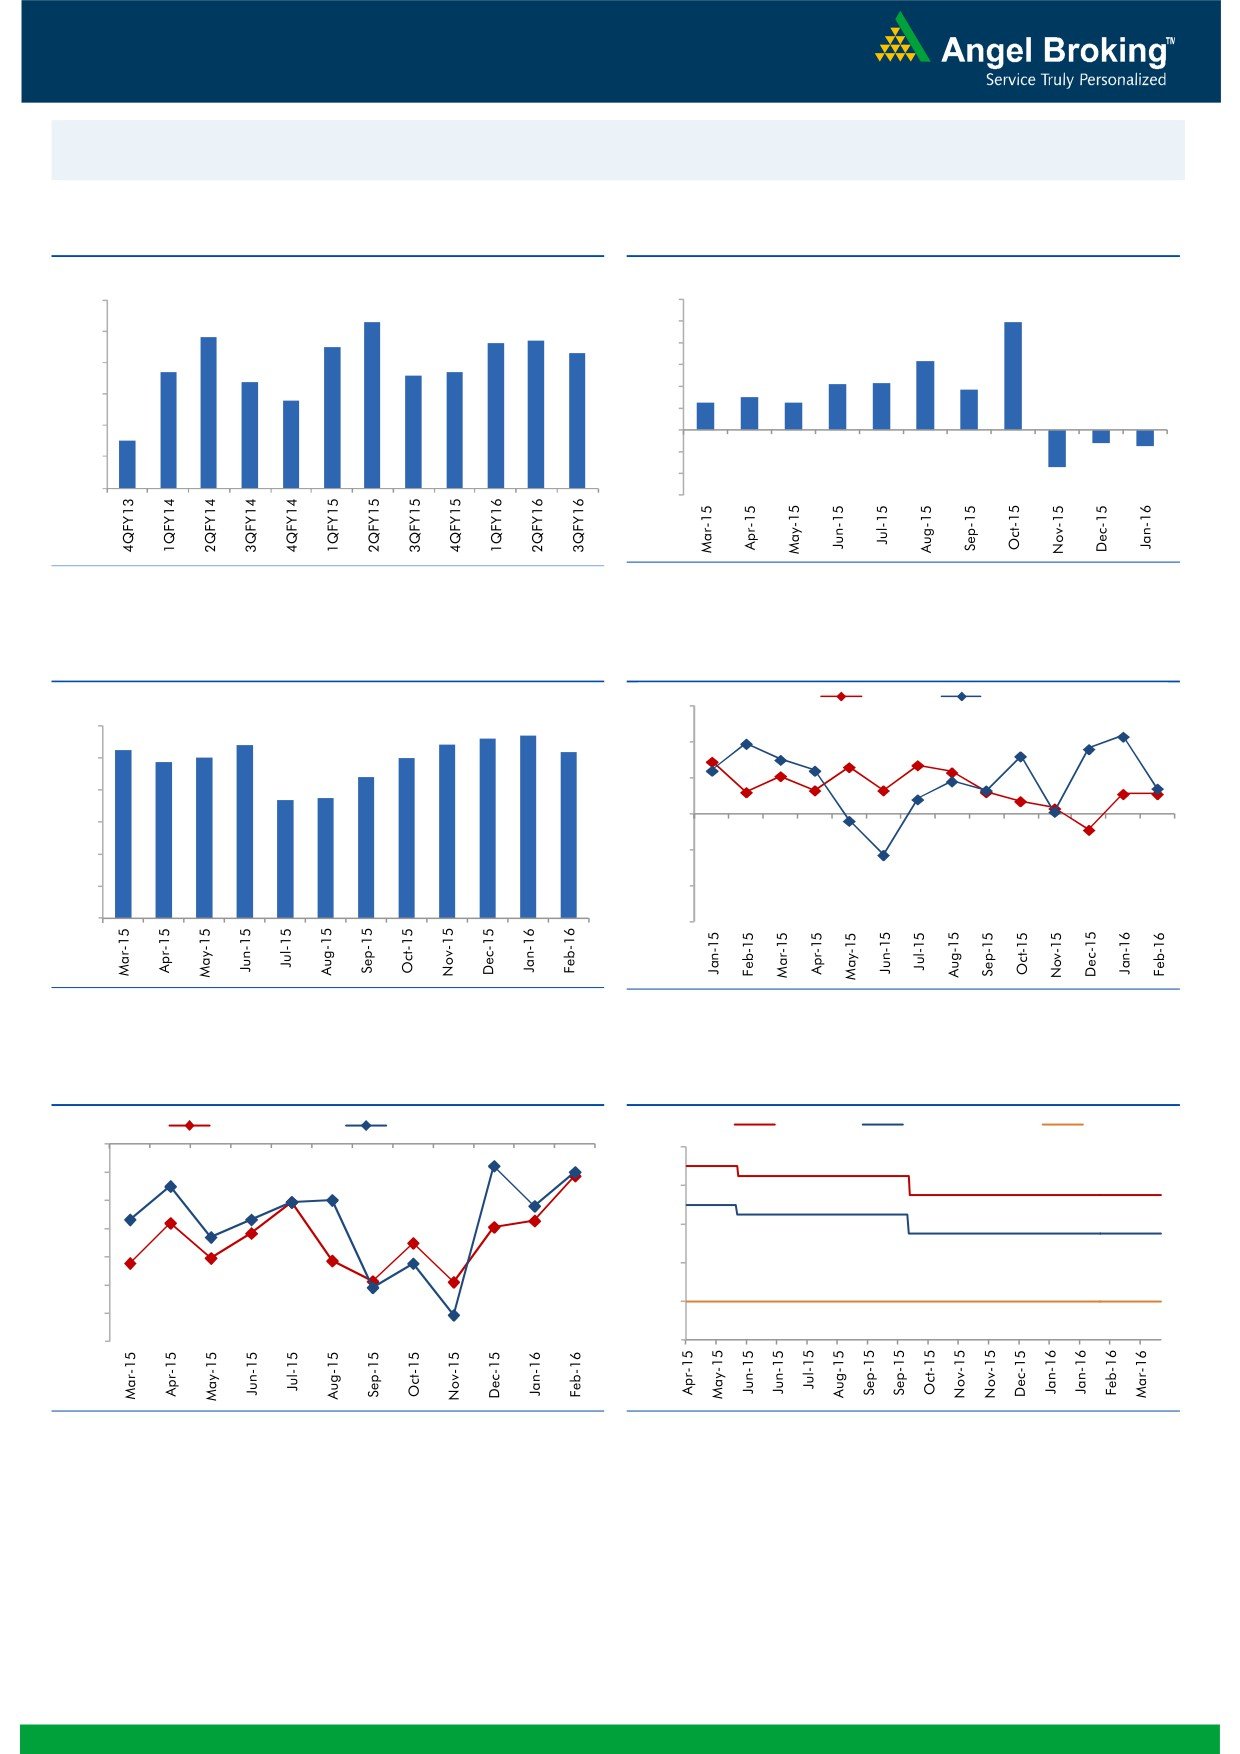
Macro watch
Exhibit 1: Quarterly GDP trends
Exhibit 2: IIP trends
(%)
(%)
9.0
8.3
12.0
9.9
7.8
7.7
10.0
8.0
7.5
7.6
7.3
8.0
6.3
6.7
6.6
6.7
7.0
6.4
6.0
4.2
4.3
3.7
5.8
4.0
2.5
3.0
2.5
6.0
2.0
5.0
4.5
-
4.0
(2.0)
(1.2)
(1.5)
(4.0)
3.0
(3.4)
(6.0)
Source: CSO, Angel Research
Source: MOSPI, Angel Research
Exhibit 3: Monthly CPI inflation trends
Exhibit 4: Manufacturing and services PMI
Mfg. PMI
Services PMI
(%)
56.0
5.6
5.7
6.0
5.4
5.4
5.3
5.2
4.9
5.0
5.0
54.0
5.0
4.4
3.7
3.7
52.0
4.0
50.0
3.0
2.0
48.0
1.0
46.0
-
44.0
Source: MOSPI, Angel Research
Source: Market, Angel Research; Note: Level above 50 indicates expansion
Exhibit 5: Exports and imports growth trends
Exhibit 6: Key policy rates
(%)
Exports yoy growth
Imports yoy growth
(%)
Repo rate
Reverse Repo rate
CRR
0.0
8.00
(5.0)
7.00
(10.0)
(15.0)
6.00
(20.0)
5.00
(25.0)
4.00
(30.0)
(35.0)
3.00
Source: Bloomberg, Angel Research
Source: RBI, Angel Research
Market Outlook
April 5, 2016
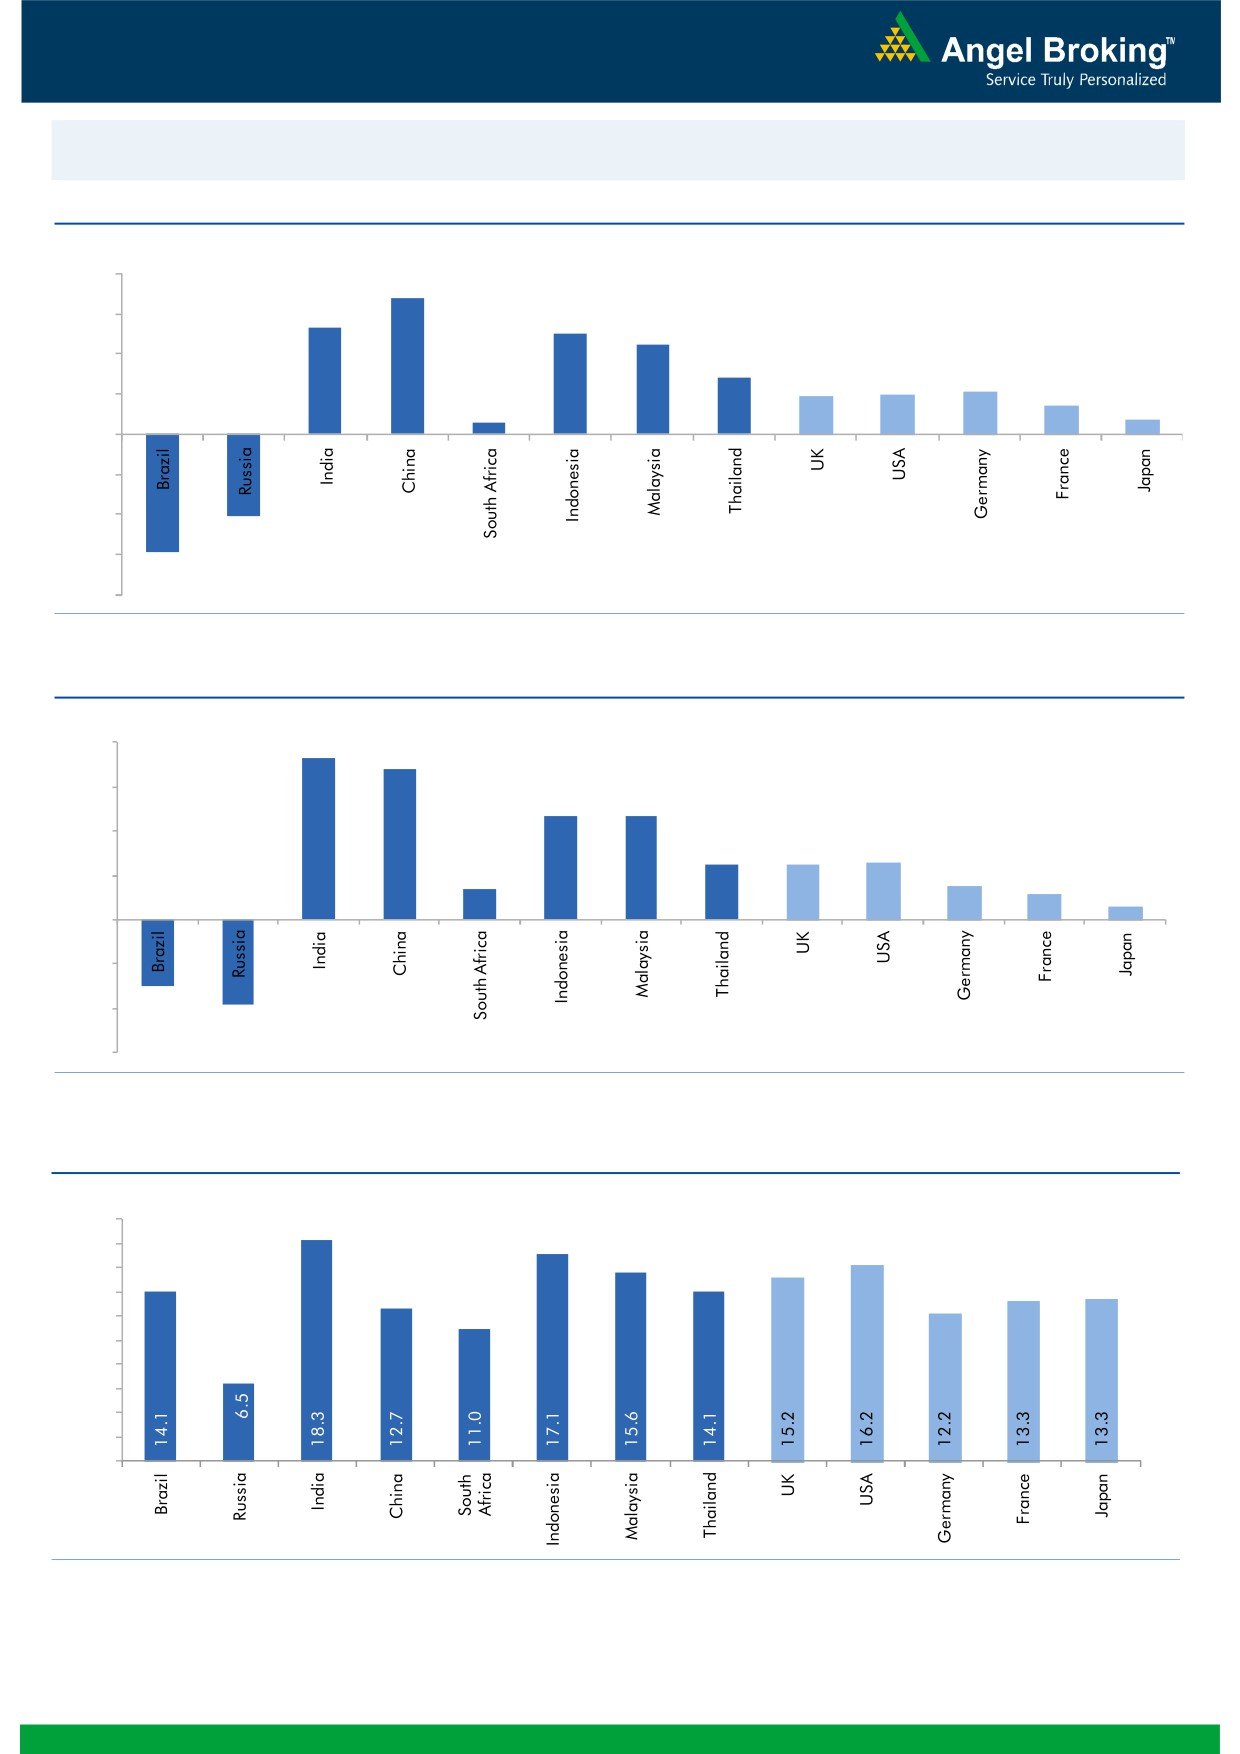
Global watch
Exhibit 1: Latest quarterly GDP Growth (%, yoy) across select developing and developed countries
(%)
8.0
6.8
6.0
5.3
5.0
4.5
4.0
2.8
1.9
2.0
2.1
1.4
2.0
0.6
0.7
-
(2.0)
(4.0)
(4.1)
(6.0)
(5.9)
(8.0)
Source: Bloomberg, Angel Research
Exhibit 2: 2015 GDP Growth projection by IMF (%, yoy) across select developing and developed countries
(%)
8.0
7.3
6.8
6.0
4.7
4.7
4.0
2.5
2.5
2.6
1.4
1.5
2.0
1.2
0.6
-
(2.0)
(3.0)
(4.0)
(3.8)
(6.0)
Source: IMF, Angel Research
Exhibit 3: One year forward P-E ratio across select developing and developed countries
(x)
20.0
18.0
16.0
14.0
12.0
10.0
8.0
6.0
4.0
2.0
-
Source: IMF, Angel Research
Market Outlook
April 5, 2016
Exhibit 4: Relative performance of indices across globe
Returns (%)
Country
Name of index
Closing price
1M
3M
1YR
Brazil
Bovespa
48,780
8.7
11.5
(5.9)
Russia
Micex
1,867
1.8
7.8
11.2
India
Nifty
7,759
11.0
(1.7)
(7.0)
China
Shanghai Composite
3,010
5.3
(14.8)
(18.2)
South Africa
Top 40
45,772
4.5
(0.3)
(0.5)
Mexico
Mexbol
45,678
4.5
5.3
3.3
Indonesia
LQ45
843
0.7
7.0
(11.0)
Malaysia
KLCI
1,725
2.2
2.4
(4.9)
Thailand
SET 50
897
0.7
12.9
(10.5)
USA
Dow Jones
17,737
5.0
0.8
(0.8)
UK
FTSE
6,165
0.2
(1.2)
(11.4)
Japan
Nikkei
16,123
(3.7)
(15.1)
(18.3)
Germany
DAX
9,822
1.1
(8.6)
(19.0)
France
CAC
4,345
(1.4)
(6.3)
(17.1)
Source: Bloomberg, Angel Research
Stock Watch
April 05, 2016
Company Name
Reco
CMP
Target
Mkt Cap
Sales ( Čcr )
OPM(%)
EPS (Č)
PER(x)
P/BV(x)
RoE(%)
EV/Sales(x)
(Č)
Price ( Č)
( Č cr )
FY16E FY17E
FY16E
FY17E
FY16E
FY17E
FY16E
FY17E
FY16E
FY17E
FY16E
FY17E
FY16E
FY17E
Agri / Agri Chemical
Rallis
Neutral
168
-
3,258
2,097
2,415
14.4
14.4
9.5
11.0
17.6
15.2
3.5
3.0
21.1
21.3
1.6
1.4
United Phosphorus
Neutral
469
-
20,091
12,500
14,375
18.3
18.3
29.8
35.9
15.7
13.1
2.9
2.4
20.0
20.3
1.7
1.4
Auto & Auto Ancillary
Ashok Leyland
Neutral
110
-
31,290
17,995
21,544
11.4
11.6
3.4
4.7
32.3
23.4
5.7
5.2
17.7
22.2
1.7
1.4
Bajaj Auto
Accumulate
2,450
2,585
70,886
22,709
25,860
20.9
20.1
129.0
143.6
19.0
17.1
5.8
5.0
30.7
29.4
2.7
2.3
Bharat Forge
Neutral
846
-
19,696
7,351
8,318
19.9
19.7
31.2
36.5
27.1
23.2
4.9
4.1
19.3
19.2
2.8
2.5
Eicher Motors
Neutral
19,450
-
52,829
15,556
16,747
15.5
17.3
464.8
597.5
41.9
32.6
15.3
11.2
36.2
34.3
3.3
3.0
Gabriel India
Accumulate
91
101
1,314
1,415
1,544
8.7
9.0
4.6
5.4
19.9
16.9
3.6
3.2
18.1
18.9
0.9
0.8
Hero Motocorp
Neutral
2,979
-
59,495
28,244
30,532
15.5
15.9
156.7
168.5
19.0
17.7
7.6
6.4
39.9
36.4
1.9
1.8
Jamna Auto Industries Accumulate
144
160
1,153
1,281
1,473
11.2
11.5
7.6
9.2
19.0
15.7
4.8
3.9
25.4
25.2
1.0
0.8
L G Balakrishnan & Bros Neutral
455
-
714
1,254
1,394
11.6
11.8
35.9
41.7
12.7
10.9
1.7
1.5
13.5
13.8
0.7
0.6
Mahindra and Mahindra Accumulate
1,246
1,364
77,373
38,416
42,904
13.7
13.9
54.8
63.4
22.7
19.7
3.5
3.1
15.4
15.8
1.7
1.4
Maruti
Neutral
3,681
-
111,205
57,865
68,104
16.4
16.7
176.3
225.5
20.9
16.3
4.1
3.5
19.4
21.2
1.7
1.4
Minda Industries
Neutral
1,009
-
1,601
2,523
2,890
8.7
9.0
55.0
65.4
18.3
15.4
3.5
2.9
19.3
18.7
0.7
0.6
Motherson Sumi
Buy
261
313
34,477
39,343
45,100
8.8
9.1
10.1
12.5
25.8
20.9
8.2
6.4
35.3
34.4
1.0
0.8
Rane Brake Lining
Buy
373
465
295
454
511
11.5
12.0
25.2
31.0
14.8
12.0
2.2
2.0
14.9
16.6
0.8
0.7
Setco Automotive
Neutral
31
-
409
594
741
12.7
13.7
1.7
3.2
18.0
9.6
1.9
1.6
10.4
16.9
1.1
0.9
Tata Motors
Neutral
388
-
112,038
259,686
273,957
13.0
13.4
25.9
29.5
15.0
13.2
2.0
1.7
8.0
9.0
0.6
0.6
TVS Motor
Neutral
324
-
15,407
11,263
13,122
6.9
8.5
9.2
15.0
35.3
21.6
8.1
6.4
22.7
29.6
1.4
1.1
Amara Raja Batteries
Buy
904
1,040
15,433
4,892
5,871
17.4
17.6
28.8
37.1
31.4
24.4
7.3
5.9
23.4
24.1
3.1
2.5
Exide Industries
Accumulate
141
162
12,015
6,950
7,784
14.4
14.8
6.6
7.3
21.4
19.4
2.7
2.5
12.6
12.8
1.4
1.3
Apollo Tyres
Accumulate
171
183
8,717
12,056
12,714
17.2
16.4
23.0
20.3
7.5
8.4
1.3
1.1
17.7
13.6
0.8
0.8
Ceat
Accumulate
1,059
1,119
4,285
6,041
6,597
14.1
13.7
99.5
111.9
10.7
9.5
2.1
1.8
19.6
18.5
0.9
0.7
JK Tyres
Neutral
84
-
1,902
7,446
7,669
15.2
14.0
19.6
18.4
4.3
4.6
1.1
0.9
25.2
19.5
0.7
0.6
Swaraj Engines
Neutral
890
-
1,106
552
630
14.2
14.7
44.6
54.1
20.0
16.5
4.6
4.2
23.2
25.6
1.9
1.6
Subros
Neutral
90
-
540
1,293
1,527
11.8
11.9
4.2
6.7
21.4
13.4
1.6
1.5
7.7
11.5
0.7
0.6
Indag Rubber
Neutral
173
-
455
283
329
17.0
17.2
13.0
15.4
13.4
11.2
2.9
2.4
21.8
21.6
1.3
1.1
Capital Goods
ACE
Neutral
38
-
379
660
839
4.7
8.2
1.0
3.9
38.4
9.8
1.2
1.1
3.2
11.3
0.7
0.6
BEML
Accumulate
1,016
1,157
4,231
3,277
4,006
6.0
8.9
36.2
64.3
28.1
15.8
1.9
1.8
5.7
11.7
1.4
1.1
Bharat Electronics
Buy
1,206
1,414
28,942
7,737
8,634
16.8
17.2
54.0
61.5
22.3
19.6
3.2
2.8
39.3
45.6
2.9
2.4
Stock Watch
April 05, 2016
Company Name
Reco
CMP
Target
Mkt Cap
Sales ( Čcr )
OPM(%)
EPS (Č)
PER(x)
P/BV(x)
RoE(%)
EV/Sales(x)
(Č)
Price ( Č)
( Č cr )
FY16E
FY17E
FY16E
FY17E
FY16E
FY17E
FY16E
FY17E
FY16E
FY17E
FY16E
FY17E
FY16E
FY17E
Capital Goods
Voltas
Buy
282
353
9,339
5,363
5,963
8.0
9.1
11.0
13.8
25.7
20.5
3.9
3.5
16.2
17.9
1.7
1.5
BGR Energy
Neutral
108
-
781
3,615
3,181
9.5
9.4
16.7
12.4
6.5
8.7
0.6
0.6
10.0
7.0
0.6
0.8
BHEL
Neutral
117
-
28,661
33,722
35,272
10.8
11.7
10.5
14.2
11.2
8.3
0.8
0.8
7.0
9.0
0.9
0.9
Blue Star
Accumulate
394
439
3,544
3,548
3,977
6.3
6.9
13.7
17.2
28.8
23.0
7.2
4.7
26.1
25.4
1.1
0.9
Crompton Greaves
Neutral
50
-
3,124
13,484
14,687
4.9
6.2
4.5
7.1
11.1
7.0
0.8
0.7
7.2
10.8
0.4
0.3
Greaves Cotton
Neutral
128
-
3,120
1,655
1,755
16.6
16.8
7.4
7.8
17.3
16.4
3.5
3.3
21.1
20.6
1.8
1.7
Inox Wind
Buy
260
458
5,761
4,980
5,943
17.0
17.5
26.6
31.6
9.8
8.2
2.9
2.2
35.0
30.0
1.3
1.0
KEC International
Neutral
127
-
3,270
8,791
9,716
6.1
6.8
5.4
8.2
23.6
15.5
2.4
2.2
10.0
14.0
0.6
0.5
Thermax
Neutral
774
-
9,217
6,413
7,525
7.4
8.5
30.5
39.3
25.4
19.7
3.9
3.4
15.0
17.0
1.4
1.2
VATech Wabag
Neutral
519
-
2,831
2,722
3,336
7.9
8.1
19.5
24.6
26.6
21.1
2.8
2.5
11.1
12.4
1.1
0.9
Cement
ACC
Neutral
1,409
-
26,461
13,151
14,757
16.4
18.3
63.9
83.4
22.1
16.9
2.8
2.6
13.3
16.1
1.9
1.6
Ambuja Cements
Neutral
231
-
35,880
11,564
12,556
19.4
20.7
8.9
10.1
26.0
22.9
3.3
3.1
12.8
13.8
2.7
2.5
HeidelbergCement
Neutral
89
-
2,024
1,772
1,926
13.3
15.4
1.0
3.0
89.3
29.8
2.3
2.1
2.6
7.9
1.7
1.5
India Cements
Neutral
88
-
2,697
4,216
4,840
18.0
19.5
4.0
9.9
22.0
8.9
0.9
0.8
4.0
9.5
1.0
0.8
JK Cement
Neutral
660
-
4,615
3,661
4,742
10.1
15.8
7.5
28.5
88.0
23.2
2.7
2.3
7.5
22.9
1.7
1.3
J K Lakshmi Cement
Neutral
334
-
3,925
2,947
3,616
16.7
19.9
11.5
27.2
29.0
12.3
2.8
2.4
9.8
20.8
1.7
1.4
Mangalam Cements
Neutral
226
-
604
1,053
1,347
10.5
13.3
8.4
26.0
26.9
8.7
1.1
1.1
4.3
12.5
1.0
0.7
Orient Cement
Neutral
151
-
3,083
1,854
2,524
21.2
22.2
7.7
11.1
19.6
13.6
2.8
2.4
13.3
15.7
2.4
1.7
Ramco Cements
Neutral
407
-
9,698
4,036
4,545
20.8
21.3
15.1
18.8
27.0
21.7
3.3
2.9
12.9
14.3
2.9
2.5
Shree Cement^
Neutral
12,469
-
43,438
7,150
8,742
26.7
28.6
228.0
345.5
54.7
36.1
8.1
6.8
15.7
20.3
5.8
4.7
UltraTech Cement
Neutral
3,173
-
87,081
24,669
29,265
18.2
20.6
82.0
120.0
38.7
26.4
4.2
3.7
11.3
14.7
3.6
3.0
Construction
ITNL
Buy
75
93
2,477
7,360
8,825
34.0
35.9
7.0
9.0
10.8
8.4
0.4
0.3
3.2
3.7
3.7
3.6
KNR Constructions
Buy
521
603
1,465
937
1,470
14.3
14.0
44.2
38.6
11.8
13.5
2.4
2.0
15.4
15.4
1.6
1.1
Larsen & Toubro
Accumulate
1,236
1,310
115,107
58,870
65,708
8.3
10.3
42.0
53.0
29.4
23.3
2.0
1.9
8.8
11.2
2.2
2.0
Gujarat Pipavav Port
Neutral
184
-
8,876
629
684
51.0
52.2
6.4
5.9
28.7
31.1
3.8
3.5
15.9
12.7
13.8
12.5
MBL Infrastructures
Buy
158
285
654
2,313
2,797
12.2
14.6
19.0
20.0
8.3
7.9
0.9
0.8
11.3
10.6
1.0
0.9
Nagarjuna Const.
Neutral
75
-
4,158
7,892
8,842
8.8
9.1
3.0
5.3
24.9
14.1
1.3
1.2
5.0
8.5
0.8
0.6
PNC Infratech
Accumulate
518
558
2,656
1,873
2,288
13.2
13.5
24.0
32.0
21.6
16.2
2.1
1.9
12.1
12.3
1.5
1.3
Simplex Infra
Neutral
248
-
1,225
5,955
6,829
10.3
10.5
16.0
31.0
15.5
8.0
0.8
0.8
5.3
9.9
0.7
0.6
Stock Watch
April 05, 2016
Company Name
Reco
CMP
Target
Mkt Cap
Sales ( Čcr )
OPM(%)
EPS (Č)
PER(x)
P/BV(x)
RoE(%)
EV/Sales(x)
(Č)
Price ( Č)
( Č cr )
FY16E
FY17E
FY16E
FY17E
FY16E
FY17E
FY16E
FY17E
FY16E
FY17E
FY16E
FY17E
FY16E
FY17E
Construction
Power Mech Projects
Neutral
590
-
868
1,539
1,801
12.8
12.7
59.0
72.1
10.0
8.2
1.5
1.3
18.6
16.8
0.6
0.5
Sadbhav Engineering
Neutral
297
-
5,086
3,481
4,219
10.7
10.8
8.2
11.7
36.2
25.3
3.5
3.0
10.3
13.5
1.7
1.4
NBCC
Accumulate
955
1,089
11,456
5,816
7,382
6.9
7.7
29.6
39.8
32.3
24.0
5.8
4.6
24.1
26.7
1.7
1.3
MEP Infra
Neutral
39
-
628
1,956
1,876
28.1
30.5
1.3
3.0
29.7
12.9
6.2
4.2
21.2
32.8
1.7
1.7
SIPL
Neutral
100
-
3,510
675
1,042
62.4
64.7
-
-
3.7
4.3
-
-
16.9
11.4
Engineers India
Neutral
172
-
5,792
1,667
1,725
13.5
16.0
9.7
11.4
17.7
15.1
2.1
2.0
11.7
13.4
2.3
2.3
Financials
Allahabad Bank
Neutral
57
-
3,423
8,569
9,392
2.8
2.9
16.3
27.5
3.5
2.1
0.3
0.3
7.6
11.9
-
-
Axis Bank
Accumulate
445
494
106,039
26,473
31,527
3.5
3.6
35.7
43.5
12.5
10.2
2.1
1.8
17.9
18.9
-
-
Bank of Baroda
Neutral
151
-
34,850
18,485
21,025
1.9
2.0
13.5
21.1
11.2
7.2
0.9
0.8
7.3
10.6
-
-
Bank of India
Neutral
100
-
8,095
15,972
17,271
1.9
2.0
15.3
33.4
6.5
3.0
0.3
0.3
3.6
7.6
-
-
Canara Bank
Neutral
198
-
10,776
15,441
16,945
2.0
2.1
46.6
70.4
4.3
2.8
0.4
0.3
8.0
11.2
-
-
Dena Bank
Neutral
30
-
1,955
3,440
3,840
2.1
2.3
7.3
10.0
4.2
3.0
0.3
0.3
6.1
7.9
-
-
Federal Bank
Neutral
45
-
7,722
3,477
3,999
3.0
3.0
5.0
6.2
9.0
7.2
0.9
0.8
10.6
11.9
-
-
HDFC
Neutral
1,104
-
174,438
10,358
11,852
3.3
3.3
41.1
47.0
26.9
23.5
5.1
4.7
24.7
24.9
-
-
HDFC Bank
Buy
1,069
1,262
270,339
38,309
47,302
4.3
4.3
49.3
61.1
21.7
17.5
3.8
3.2
18.5
19.7
-
-
ICICI Bank
Accumulate
239
254
138,670
34,279
39,262
3.3
3.3
21.0
24.4
11.4
9.8
1.9
1.6
14.4
14.7
-
-
IDBI Bank
Neutral
71
-
13,528
9,625
10,455
1.8
1.8
8.5
14.2
8.4
5.0
0.5
0.5
5.9
9.3
-
-
Indian Bank
Neutral
105
-
5,055
6,160
6,858
2.5
2.5
24.5
29.8
4.3
3.5
0.3
0.3
7.7
8.6
-
-
LIC Housing Finance
Buy
487
592
24,564
3,101
3,745
2.5
2.5
33.0
40.2
14.8
12.1
2.8
2.3
19.7
20.5
-
-
Oriental Bank
Neutral
95
-
2,862
7,643
8,373
2.4
2.4
37.2
45.4
2.6
2.1
0.2
0.2
8.2
9.4
-
-
Punjab Natl.Bank
Neutral
87
-
17,054
23,638
26,557
2.8
2.8
17.9
27.2
4.9
3.2
0.5
0.4
8.5
12.0
-
-
South Ind.Bank
Neutral
18
-
2,458
1,965
2,185
2.5
2.5
2.5
3.3
7.3
5.5
0.7
0.7
9.5
11.7
-
-
St Bk of India
Neutral
195
-
151,374
79,958
86,061
2.6
2.6
13.4
20.7
14.6
9.4
1.2
1.1
11.5
12.8
-
-
Union Bank
Neutral
137
-
9,445
12,646
14,129
2.3
2.4
31.0
39.1
4.4
3.5
0.5
0.4
9.8
11.4
-
-
Vijaya Bank
Neutral
32
-
2,775
3,536
3,827
1.9
1.9
5.5
6.7
5.8
4.9
0.5
0.4
7.8
8.8
-
-
Yes Bank
Neutral
868
-
36,488
7,190
9,011
3.2
3.3
58.2
69.7
14.9
12.5
2.7
2.3
19.2
19.6
-
-
FMCG
Asian Paints
Neutral
886
-
84,947
16,553
19,160
16.0
16.2
17.7
21.5
50.1
41.2
13.3
12.0
29.4
31.2
5.0
4.3
Britannia
Neutral
2,659
-
31,900
8,481
9,795
14.0
14.1
65.5
78.3
40.6
34.0
19.2
15.8
38.3
41.2
3.7
3.1
Colgate
Neutral
839
-
22,814
4,836
5,490
19.5
19.7
48.5
53.2
17.3
15.8
12.7
11.0
99.8
97.5
4.6
4.1
Stock Watch
April 05, 2016
Company Name
Reco
CMP
Target
Mkt Cap
Sales ( Čcr )
OPM(%)
EPS (Č)
PER(x)
P/BV(x)
RoE(%)
EV/Sales(x)
(Č)
Price ( Č)
( Č cr )
FY16E FY17E
FY16E
FY17E
FY16E
FY17E
FY16E
FY17E
FY16E
FY17E
FY16E
FY17E
FY16E
FY17E
FMCG
Dabur India
Accumulate
249
267
43,794
9,370
10,265
17.1
17.2
7.3
8.1
33.9
30.7
10.2
8.3
33.7
30.6
4.6
4.2
GlaxoSmith Con*
Neutral
5,991
-
25,194
4,919
5,742
17.2
17.4
168.3
191.2
35.6
31.3
10.1
8.6
28.8
28.9
4.7
4.0
Godrej Consumer
Neutral
1,421
-
48,375
10,168
12,886
16.1
16.1
32.1
38.4
44.3
37.0
9.0
8.3
19.7
21.0
4.9
3.8
HUL
Neutral
872
-
188,690
34,940
38,957
17.5
17.7
20.8
24.7
41.9
35.3
46.6
37.3
110.5
114.2
5.2
4.6
ITC
Accumulate
331
359
266,322
36,804
38,776
37.9
37.9
12.2
12.9
27.1
25.7
7.5
6.6
27.7
25.8
6.8
6.5
Marico
Neutral
243
-
31,358
6,551
7,766
15.7
16.0
10.4
12.5
23.4
19.4
6.8
5.7
33.2
32.4
4.7
4.0
Nestle*
Buy
5,675
6,646
54,714
11,291
12,847
22.2
22.3
158.9
184.6
35.7
30.7
18.7
16.8
55.0
57.3
4.7
4.1
Tata Global
Buy
121
144
7,649
8,635
9,072
9.8
9.9
6.5
7.6
18.7
16.0
1.9
1.8
6.8
7.4
0.8
0.8
IT
HCL Tech^
Buy
840
1,038
118,444
42,038
47,503
21.2
21.5
51.5
57.7
16.3
14.6
3.5
2.7
21.5
18.8
2.4
2.0
Infosys
Accumulate
1,244
1,347
286,569
61,850
69,981
27.5
27.5
59.4
65.7
20.9
18.9
4.4
3.8
21.2
20.1
3.9
3.3
TCS
Buy
2,471
2,854
486,834
108,487
122,590
28.3
28.5
122.8
138.4
20.1
17.9
7.7
6.9
38.0
38.9
4.1
3.6
Tech Mahindra
Accumulate
471
530
45,550
26,524
29,177
16.2
17.0
28.8
33.6
16.3
14.0
3.2
2.7
19.3
19.1
1.5
1.3
Wipro
Buy
566
680
139,852
50,808
56,189
23.7
23.8
37.3
40.7
15.2
13.9
2.9
2.6
19.2
17.7
2.2
1.9
Media
D B Corp
Accumulate
324
356
5,955
2,241
2,495
27.8
27.9
21.8
25.6
14.9
12.7
3.9
3.4
26.7
28.5
2.6
2.3
HT Media
Neutral
77
-
1,797
2,495
2,603
11.2
11.2
7.3
8.6
10.6
9.0
0.8
0.8
7.4
8.1
0.2
0.2
Jagran Prakashan
Buy
159
189
5,188
2,170
2,355
27.2
26.2
8.9
9.9
17.8
16.0
3.7
3.3
20.9
20.5
2.3
2.1
Sun TV Network
Neutral
375
-
14,762
2,779
3,196
70.2
70.5
22.8
27.3
16.4
13.7
4.1
3.7
26.7
28.3
5.1
4.4
Hindustan Media
Neutral
251
-
1,841
920
1,031
20.0
20.0
19.2
20.9
13.1
12.0
2.1
1.8
16.4
15.3
1.5
1.4
Ventures
Metals & Mining
Coal India
Buy
285
380
180,269
76,167
84,130
19.9
22.3
22.4
25.8
12.7
11.1
4.6
4.5
35.5
41.0
1.7
1.5
Hind. Zinc
Neutral
188
-
79,542
14,641
14,026
50.4
50.4
17.7
16.0
10.7
11.8
1.6
1.5
16.2
13.2
3.1
2.9
Hindalco
Neutral
89
-
18,399
104,356
111,186
8.7
9.5
6.7
11.1
13.3
8.1
0.5
0.5
3.5
5.9
0.7
0.6
JSW Steel
Neutral
1,260
-
30,449
42,308
45,147
16.4
20.7
(10.3)
49.5
25.5
1.4
1.4
(1.0)
5.6
1.8
1.7
NMDC
Neutral
98
-
39,013
8,237
10,893
46.6
44.5
10.0
11.7
9.9
8.4
1.1
1.0
12.5
13.0
4.5
3.5
SAIL
Neutral
44
-
18,049
45,915
53,954
7.2
10.5
1.5
4.4
29.0
10.0
0.4
0.4
2.3
4.1
1.0
0.9
Vedanta
Neutral
91
-
26,875
71,445
81,910
26.2
26.3
12.9
19.2
7.0
4.7
0.5
0.4
7.2
8.9
0.8
0.6
Tata Steel
Neutral
320
-
31,098
126,760
137,307
8.9
11.3
6.4
23.1
50.3
13.9
1.0
1.0
2.0
7.1
0.8
0.8
Oil & Gas
Cairn India
Neutral
152
-
28,451
11,323
12,490
49.4
51.0
20.7
20.7
7.3
7.4
0.5
0.5
6.4
6.1
1.6
0.9
GAIL
Neutral
348
-
44,143
64,856
70,933
9.1
9.6
24.0
28.9
14.5
12.1
1.2
1.2
8.8
9.6
0.9
0.8
ONGC
Neutral
207
-
177,441
154,564
167,321
36.8
37.4
28.6
32.5
7.3
6.4
0.9
0.9
12.7
13.5
1.4
1.3
Stock Watch
April 05, 2016
Company Name
Reco
CMP
Target
Mkt Cap
Sales ( Čcr )
OPM(%)
EPS (Č)
PER(x)
P/BV(x)
RoE(%)
EV/Sales(x)
(Č)
Price ( Č)
( Č cr )
FY16E FY17E
FY16E
FY17E
FY16E
FY17E
FY16E
FY17E
FY16E
FY17E
FY16E
FY17E
FY16E
FY17E
Oil & Gas
Petronet LNG
Neutral
248
-
18,570
29,691
31,188
5.8
6.2
12.8
13.4
19.4
18.4
2.9
2.6
15.8
14.8
0.7
0.7
Indian Oil Corp
Accumulate
402
455
97,494
359,607
402,760
5.9
6.1
42.5
48.7
9.5
8.2
1.3
1.1
14.1
14.4
0.4
0.3
Reliance Industries
Accumulate
1,035
1,150
335,427
304,775
344,392
12.6
13.4
91.3
102.6
11.3
10.1
1.3
1.2
11.8
12.0
1.0
0.9
Pharmaceuticals
Alembic Pharma
Neutral
594
-
11,203
3,274
3,802
26.9
19.4
35.0
28.7
17.0
20.7
7.5
5.7
55.6
31.2
3.4
2.9
Aurobindo Pharma
Accumulate
753
856
44,072
14,923
17,162
22.0
23.0
35.7
42.8
21.1
17.6
6.2
4.7
34.0
30.2
3.3
2.8
Aventis*
Neutral
4,092
-
9,424
2,082
2,371
17.4
20.8
118.2
151.5
34.6
27.0
5.1
4.1
19.9
25.5
4.2
3.5
Cadila Healthcare
Accumulate
315
352
32,227
10,224
11,840
21.0
22.0
14.6
17.6
21.6
17.9
5.9
4.6
30.8
29.0
3.2
2.7
Cipla
Buy
514
605
41,286
13,979
16,447
20.2
18.6
25.7
27.5
20.0
18.7
3.3
2.8
17.6
16.1
2.9
2.4
Dr Reddy's
Buy
3,015
3,933
51,417
16,838
19,575
25.0
23.1
167.5
178.8
18.0
16.9
3.8
3.2
23.1
20.4
3.0
2.5
Dishman Pharma
Neutral
334
-
2,695
1,733
1,906
21.5
21.5
17.0
19.9
19.6
16.8
2.0
1.8
10.5
11.2
2.1
1.8
GSK Pharma*
Neutral
3,752
-
31,779
2,870
3,158
20.0
22.1
59.5
68.3
63.1
54.9
18.6
19.1
28.5
34.3
10.6
9.7
Indoco Remedies
Neutral
276
-
2,539
1,033
1,199
15.9
18.2
9.4
13.6
29.3
20.3
4.4
3.7
15.7
19.7
2.5
2.2
Ipca labs
Buy
570
900
7,190
3,363
3,909
12.9
18.6
13.4
28.0
42.5
20.4
3.0
2.7
7.4
14.0
2.4
2.1
Lupin
Accumulate
1,461
1,560
65,844
13,092
16,561
25.0
27.0
50.4
68.3
29.0
21.4
6.0
4.7
22.8
24.7
4.7
3.6
Sun Pharma
Buy
816
950
196,372
28,163
32,610
25.8
30.7
17.4
26.9
46.9
30.3
4.5
3.9
13.0
16.6
6.4
5.4
Power
Tata Power
Neutral
68
-
18,473
35,923
37,402
22.6
22.8
4.1
5.2
16.9
13.3
1.3
1.2
7.5
9.3
1.5
1.3
NTPC
Accumulate
131
146
108,057
87,271
99,297
23.5
23.5
11.8
13.3
11.2
9.9
1.3
1.2
11.5
12.2
2.3
2.0
Power Grid
Buy
139
170
72,510
20,702
23,361
86.7
86.4
12.1
13.2
11.5
10.5
1.7
1.5
15.6
15.1
8.4
7.8
Real Estate
MLIFE
Buy
431
554
1,768
697
1,011
14.9
19.3
13.8
20.1
31.2
21.4
1.2
1.1
3.8
5.3
3.8
2.6
Telecom
Bharti Airtel
Neutral
348
-
139,050
101,748
109,191
32.1
31.7
12.0
12.5
29.0
27.8
2.0
1.9
6.9
6.7
2.0
1.8
Idea Cellular
Neutral
113
-
40,794
34,282
36,941
32.0
31.5
5.9
6.2
19.2
18.3
1.8
1.6
9.9
9.3
1.8
1.7
zOthers
Abbott India
Neutral
4,587
-
9,748
2,715
3,153
14.5
14.1
134.3
152.2
34.2
30.1
8.5
7.0
27.4
25.6
3.3
2.8
Bajaj Electricals
Accumulate
207
237
2,090
4,719
5,287
5.2
5.8
8.6
12.7
24.2
16.4
2.8
2.4
11.4
14.8
0.4
0.4
Finolex Cables
Neutral
288
-
4,398
2,520
2,883
12.2
12.0
12.7
14.2
22.7
20.3
3.1
2.7
13.6
13.5
1.5
1.3
Goodyear India*
Accumulate
510
582
1,176
1,800
1,600
11.7
11.5
58.7
52.9
8.7
9.6
1.9
1.7
24.6
18.7
0.4
0.4
Hitachi
Neutral
1,211
-
3,294
1,779
2,081
7.8
8.8
21.8
33.4
55.6
36.2
9.0
7.3
17.4
22.1
1.9
1.6
Jyothy Laboratories
Neutral
300
-
5,433
1,620
1,847
11.5
11.5
7.3
8.5
41.2
35.4
5.3
4.9
13.3
14.4
3.2
2.7
MRF
Buy
36,826
45,575
15,618
20,316
14,488
21.4
21.1
5,488.0
3,798.0
6.7
9.7
2.3
1.9
41.1
21.2
0.7
1.0
Page Industries
Neutral
12,053
-
13,444
1,929
2,450
19.8
20.1
229.9
299.0
52.4
40.3
23.1
16.1
52.1
47.1
7.0
5.5
Stock Watch
April 05, 2016
Company Name
Reco
CMP
Target
Mkt Cap
Sales ( Čcr )
OPM(%)
EPS (Č)
PER(x)
P/BV(x)
RoE(%)
EV/Sales(x)
(Č)
Price ( Č)
( Č cr )
FY16E
FY17E
FY16E
FY17E
FY16E
FY17E
FY16E
FY17E
FY16E
FY17E
FY16E
FY17E
FY16E
FY17E
zOthers
Relaxo Footwears
Neutral
442
-
5,307
1,767
2,152
12.3
12.5
19.3
25.1
23.0
17.6
5.6
4.3
27.7
27.8
3.1
2.5
Siyaram Silk Mills
Buy
1,006
1,354
943
1,636
1,815
11.5
11.5
89.9
104.1
11.2
9.7
1.9
1.6
17.9
17.8
0.7
0.7
Styrolution ABS India* #VALUE!
1,271
1,440
8.6
9.2
32.0
41.1
10.7
12.4
TVS Srichakra
Buy
2,338
3,217
1,790
2,035
2,252
15.9
15.3
248.6
268.1
9.4
8.7
4.1
3.0
43.6
33.9
0.9
0.8
HSIL
Neutral
297
-
2,149
2,123
2,384
16.1
16.5
15.0
18.9
19.8
15.8
1.5
1.4
8.0
9.4
1.4
1.2
Kirloskar Engines India
Neutral
216
-
3,124
2,403
2,554
8.6
9.9
9.2
10.5
23.5
20.6
2.3
2.2
9.7
10.7
0.9
0.9
Ltd
M M Forgings
Buy
463
614
559
511
615
21.7
21.6
43.1
55.8
10.7
8.3
2.0
1.6
19.9
21.2
1.3
1.0
Banco Products (India) Neutral
114
-
819
1,208
1,353
11.0
12.3
10.8
14.5
10.6
7.9
1.2
1.1
11.9
14.5
0.6
0.6
Competent Automobiles Neutral
139
-
85
1,040
1,137
3.2
3.1
25.7
28.0
5.4
5.0
0.8
0.7
15.0
14.3
0.1
0.1
Nilkamal
Neutral
1,113
-
1,660
1,871
2,031
10.7
10.5
63.2
69.8
17.6
16.0
2.9
2.5
17.6
16.6
0.9
0.8
Visaka Industries
Buy
111
144
177
1,086
1,197
9.9
10.3
21.5
28.8
5.2
3.9
0.5
0.5
9.6
11.6
0.4
0.3
Transport Corporation of
Neutral
277
-
2,110
2,830
3,350
8.8
9.0
14.4
18.3
19.3
15.2
3.0
2.6
15.4
17.1
0.9
0.8
India
Elecon Engineering
Neutral
58
-
629
1,359
1,482
10.3
13.7
0.8
3.9
71.9
14.8
1.2
1.1
1.6
7.8
0.8
0.7
Surya Roshni
Buy
148
201
647
2,992
3,223
8.1
8.4
14.7
18.3
10.1
8.1
0.9
0.9
9.7
11.0
0.5
0.5
MT Educare
Neutral
170
-
675
286
366
18.3
17.7
7.7
9.4
22.0
18.1
4.6
4.1
20.2
21.1
2.3
1.7
Radico Khaitan
Buy
97
156
1,294
1,517
1,635
12.7
13.4
5.8
7.1
16.7
13.7
1.4
1.3
8.6
9.6
1.3
1.2
Garware Wall Ropes
Buy
339
473
743
862
974
11.2
11.2
24.9
29.6
13.6
11.5
2.1
1.8
15.1
15.4
0.9
0.7
Wonderla Holidays
Neutral
388
-
2,192
206
308
44.0
43.6
9.0
12.9
43.1
30.1
5.9
5.3
13.7
17.8
10.5
7.0
Linc Pen & Plastics
Neutral
193
-
285
340
371
8.3
8.9
10.8
13.2
17.9
14.6
2.9
2.5
16.0
17.1
0.9
0.8
The Byke Hospitality
Neutral
156
-
624
222
287
20.5
20.5
5.6
7.6
27.6
20.6
5.2
4.3
18.9
20.8
2.8
2.2
Interglobe Aviation
Neutral
967
-
34,848
17,022
21,122
20.7
14.5
63.9
53.7
15.1
18.0
22.7
18.6
149.9
103.2
2.1
1.7
Coffee Day Enterprises
Neutral
227
-
4,678
2,692
2,964
17.0
18.6
-
4.7
-
47.9
2.8
2.6
0.2
5.5
2.1
2.0
Ltd
Navneet Education
Neutral
84
-
2,006
998
1,062
24.1
24.0
5.8
6.1
14.6
13.8
3.2
2.8
22.0
20.6
2.1
2.0
Navkar Corporation
Buy
185
265
2,631
365
436
38.3
37.5
5.6
5.9
32.7
31.4
2.1
1.9
6.3
6.1
8.0
6.9
UFO Moviez
Neutral
480
-
1,320
558
619
32.0
33.2
22.5
30.0
21.3
16.0
2.6
2.2
12.0
13.8
2.2
1.8
VRL Logistics
Neutral
376
-
3,430
1,725
1,902
16.5
16.7
12.2
14.6
30.9
25.8
6.4
5.7
20.8
21.9
2.1
1.9
Team Lease Serv.
Neutral
900
-
1,538
2,565
3,229
1.3
1.5
15.2
22.8
59.3
39.5
4.7
4.2
8.0
10.7
0.5
0.4
S H Kelkar & Co.
Neutral
226
-
3,275
928
1,036
15.3
15.1
4.9
6.1
45.9
37.1
4.3
4.0
9.4
10.7
3.4
3.0
Quick Heal
Neutral
225
-
1,576
339
408
27.8
27.3
7.1
7.7
31.8
29.1
2.7
2.7
8.5
9.3
3.6
3.0
Stock Watch
April 05, 2016
Company Name
Reco
CMP
Target Mkt Cap
Sales ( Čcr )
OPM(%)
EPS (Č)
PER(x)
P/BV(x)
RoE(%)
EV/Sales(x)
(Č)
Price ( Č)
( Č cr )
FY16E FY17E FY16E FY17E FY16E FY17E FY16E FY17E FY16E FY17E FY16E FY17E FY16E FY17E
zOthers
Narayana Hrudaya
Neutral
290
-
5,919
1,603
1,873
10.9
11.5
1.0
2.6
304.1
109.5
7.3
6.7
2.4
6.1
3.8
3.3
Manpasand Bever.
Neutral
460
-
2,302
540
836
19.9
19.6
10.2
16.9
44.9
27.2
3.6
3.3
8.1
12.0
3.9
2.5
Source: Company, Angel Research; Note: *December year end; #September year end; &October year end; Price as on April 04, 2016
Market Outlook
April 05, 2016
Research Team Tel: 022 - 39357800
DISCLAIMER
Angel Broking Private Limited (hereinafter referred to as “Angel”) is a registered Member of National Stock Exchange of India Limited,
Bombay Stock Exchange Limited and Metropolitian Stock Exchange of India Limited. It is also registered as a Depository Participant with
CDSL and Portfolio Manager with SEBI. It also has registration with AMFI as a Mutual Fund Distributor. Angel Broking Private Limited is a
registered entity with SEBI for Research Analyst in terms of SEBI (Research Analyst) Regulations, 2014 vide registration number
INH000000164. Angel or its associates has not been debarred/ suspended by SEBI or any other regulatory authority for accessing
/dealing in securities Market. Angel or its associates including its relatives/analyst do not hold any financial interest/beneficial ownership
of more than 1% in the company covered by Analyst. Angel or its associates/analyst has not received any compensation / managed or co
-managed public offering of securities of the company covered by Analyst during the past twelve months. Angel/analyst has not served as
an officer, director or employee of company covered by Analyst and has not been engaged in market making activity of the company
covered by Analyst.
This document is solely for the personal information of the recipient, and must not be singularly used as the basis of any investment
decision. Nothing in this document should be construed as investment or financial advice. Each recipient of this document should make
such investigations as they deem necessary to arrive at an independent evaluation of an investment in the securities of the companies
referred to in this document (including the merits and risks involved), and should consult their own advisors to determine the merits and
risks of such an investment.
Reports based on technical and derivative analysis center on studying charts of a stock's price movement, outstanding positions and
trading volume, as opposed to focusing on a company's fundamentals and, as such, may not match with a report on a company's
fundamentals.
The information in this document has been printed on the basis of publicly available information, internal data and other reliable sources
believed to be true, but we do not represent that it is accurate or complete and it should not be relied on as such, as this document is for
general guidance only. Angel Broking Pvt. Limited or any of its affiliates/ group companies shall not be in any way responsible for any
loss or damage that may arise to any person from any inadvertent error in the information contained in this report. Angel Broking Pvt.
Limited has not independently verified all the information contained within this document. Accordingly, we cannot testify, nor make any
representation or warranty, express or implied, to the accuracy, contents or data contained within this document. While Angel Broking
Pvt. Limited endeavors to update on a reasonable basis the information discussed in this material, there may be regulatory, compliance,
or other reasons that prevent us from doing so.
This document is being supplied to you solely for your information, and its contents, information or data may not be reproduced,
redistributed or passed on, directly or indirectly.
Neither Angel Broking Pvt. Limited, nor its directors, employees or affiliates shall be liable for any loss or damage that may arise from or
in connection with the use of this information.
Note: Please refer to the important ‘Stock Holding Disclosure' report on the Angel website (Research Section). Also, please refer to the
latest update on respective stocks for the disclosure status in respect of those stocks. Angel Broking Pvt. Limited and its affiliates may have
investment positions in the stocks recommended in this report.