Market Outlook
February 5, 2016
Market Cues
Domestic Indices
Chg (%)
(Pts)
(Close)
Indian markets are expected to open flat to positive tracking the SGX Nifty and its
BSE Sensex
0.5
115
24,338
asian peers.
Nifty
0.6
42
7,404
US markets ended in positive after a relatively lackluster performance. The lack of
Mid Cap
(0.2)
(19)
10,142
direction seen for much of the day came as traders kept a close eye on the price of
Small Cap
(0.8)
(79)
10,443
crude oil. Traders may also have been reluctant to make any significant moves
Bankex
0.2
30
16,818
ahead of the release of the Labor Department's monthly jobs report today.
The European markets ended mixed. A rebound in commodity prices provided a
Global Indices
Chg (%)
(Pts)
(Close)
boost to the markets which aided Mining and energy stocks. However, mixed
Dow Jones
0.5
80
16,417
corporate earnings results and an EC growth downgrade limited gains.
Nasdaq
0.1
5
4,510
Indian shares snapped a three-day losing streak on Thursday as a rebound in oil
FTSE
1.1
62
5,899
prices helped to revive global sentiment and the rupee edged higher on sluggish
U.S. data and dovish comments from a top Federal Reserve official suggesting the
Nikkei
(0.9)
(146)
17,045
Federal Reserve will not raise rates again anytime soon.
Hang Seng
1.0
191
19,183
Shanghai Com
1.5
42
2,781
News & Result Analysis
Nasscom - projects the IT export growth at 10-12% CC for FY2017
Advances / Declines
BSE
NSE
Result Preview: Visaka Industries, Tata Steel, Sanofi India
Result Review: Lupin, Cadila Healthcare, Ipca labs
Advances
1,000
211
Detailed analysis on Pg2
Declines
1,665
1,359
Unchanged
120
32
Investor’s Ready Reckoner
Key Domestic & Global Indicators
Volumes (` Cr)
Stock Watch: Latest investment recommendations on 150+ stocks
BSE
2,742
Refer P7 onwards
NSE
16,899
Top Picks
CMP
Target
Upside
Company
Sector
Rating
(`)
(`)
(%)
Net Inflows (` Cr)
Net
Mtd
Ytd
Amara Raja Batteries Auto & Auto Ancillary
Buy
853
1,040
21.9
FII
(317)
21
(10,009)
HCL Tech
IT
Buy
867
1,038
19.7
MFs
(407)
(787)
81,139
Larsen & Toubro
Construction
Buy
1,136
1,310
15.3
LIC Housing Finance Financials
Buy
438
592
35.2
Top Gainers
Price (`)
Chg (%)
Navkar Corporation Others
Buy
188
265
41.1
Abb
1,148
14.2
More Top Picks on Pg6
Vedl
68
9.9
Key Upcoming Events
Mothersumi
263
5.8
Previous
Consensus
Date
Region
Event Description
Cairn
123
5.7
Reading
Expectations
Feb 05 US
Change in Nonfarm payrolls (thousands)
292
190
Hexaware
235
5.2
Feb 10 India
Exports YoY% (% Change)
(14.70)
--
Feb 10 India
Imports YoY% (% Change)
(3.90)
--
Top Losers
Price (`)
Chg (%)
Feb 12 India
Industrial Production YoY (% Change)
(3.20)
--
Wockpharma
1,022
(10.9)
6.(
Balramchin
83
(6.7)
Religare
283
(5.9)
Relinfra
410
(5.9)
Jetairways
529
(5.6)
As on February 04, 2016
Market Outlook
February 5, 2016
Nasscom - projects the IT export growth at 10-12% CC for
FY2017
Nasscom, the body representing the IT industry, expects that the export revenue
will grow by 10-12% on Constant Currency (CC) for FY2017. For FY2016 the
industry reported exports revenue growth of 12.3% on constant currency basis
(forecast growth of 12-14%). Domestic revenues are expected to clock growth rate
of
11-13% in FY2017. We believe that given the volatility in the macro
environment, this looks like a decent forecast. Moreover, on a higher base the
growth will be towards this range, with the larger players gaining more share from
the other marginal players. Moreover given the high ROE’s of the companies and
the respective valuations we remain positive on the sector and maintain our
recommendations.
Result Review
Visaka Industries (CMP: `103/ TP: `144/ Upside: 40%)
For 3QFY2016, Visaka Industries posted mixed set of numbers. The top-line
during the quarter was flat witnessing a marginal growth of 0.6% yoy to `215cr.
This was lower than our estimate of `239cr. The raw material cost as a percentage
of sales increased by 455bp yoy to 57.7% of sales and employee expense grew by
146bp yoy to 7.8% of sales. However, this was compensated by 645bp yoy decline
in other expenses to 26.9% of sales and resulting in EBITDA margin improving by
44bp yoy to 7.7% and EBITDA growing by 6.7% yoy to `16cr. This is in-line with
our estimate of 7.1% and `17cr respectively. The company reported bottom-line of
`1.1cr which is lower than our estimate of `1.6cr.
The top-line for the Building Products segment declined by 3.6% on yoy basis to
`167cr. The EBIT margin for the segment reported 153bp yoy expansion to 3.9%.
The Synthetic Yarn segment witnessed 5.1% yoy growth in its top-line to `41cr with
EBIT margin expanding by 73bp yoy to 13.3%.
Considering the weakness in rural economy, the performance of the building
products division is likely to remain subdued in the near term. The negative
currency movement, which has impacted raw material cost, is likely to stabilize
going forward. Moreover, the Synthetic Yarn business is performing well which in
the longer run should benefit from rise in textile exports. We have Buy rating on
the stock and will revise out target price post management interaction.
Tata Steel (CMP: `226/ TP: / Upside:)
Standalone revenues declined 8% on a YoY basis and 5% sequentially to INR
9,064cr, 5% ahead of our estimate of INR 8,622cr. Volumes came in 7% ahead of
estimates, while realisation per tonne at $ 585/tonne was lower than our estimate
of ~$ 605/tonne. Material costs however increased significantly at `2,501cr
(~28.7% of revenues), 11% ahead of our estimate of `2,261cr. Other expenses
also came in ahead of expectations, resulting in lower than expected EBITDA at
`1,498cr vs. our estimate of `1,662cr. EBITDA per tonne dipped to $ 97 as
against our estimate of $ 115. Corus volumes were 5% below our estimate at
3.35MT, while realisations were in line with estimates. However EBITDA loss was
much worse than expected at INR
675cr as against our expectations of
`365cr.Consolidated revenue declined 16% YOY at `28,039cr, as against our
Market Outlook
February 5, 2016
expectation of `29,305cr. Consolidated EBITDA came in at `814cr, down 54%
YoY, and well below our expectations of `1,176cr. Consolidated net loss came in
at
`1,415cr (excluding exceptional) as against our expectations of `1,387cr, led
by lower than expected EBITDA. We retain our NEUTRAL rating on the stock.
Sanofi India (CMP: `4,178/ TP: / Upside:)
For 4QCY2015, the company posted results below expectations. On sales, the
company posted a sales of `522cr, lower than expected `562cr, posting a yoy
growth of 8.6%. On the operating front, the GPM came in at 51.5% V/s 45.5% in
4QCY2014, leading the OPM’s to come in at 12.7% V/s 5.2% during the last
corresponding period. However, this was lower than the expected 19.4% during
the period. Thus the Adj. Net profit came in at `52.5cr V/s `102.3cr expected a
yoy growth of 102.8%. However the reported profit came in at `120.2cr V/s
`92.6cr during the last corresponding period, a yoy growth of 29.9%. This was on
back of the other income which came in at `67.7cr, which was on back of sale of
its property in Mumbai, for which the company got the
`110cr as the
compensation. Overall, we are neutral on the stock.
Y/E
Sales OPM PAT EPS ROE P/E P/BV EV/EBITDA EV/Sales
Dec
(` cr)
(%)
(` cr)
(`)
(%) (x)
(x)
(x)
(x)
CY2015E
2,082
17.4
272
118.2
19.9
35.3
5.2
24.6
4.3
CY2016E
2,371
20.8
349
151.5
25.5
27.6
4.2
17.0
3.5
Result Preview
Lupin (CMP: `1,652/ TP: / Upside: )
Lupin is expected to post another lacklustre quarter, though should witness some
improvement over 2QFY2016. For 3QFY2016, the company is expected to post
sales of `3400cr, a yoy growth of 8.1%. The growth during the quarter would be
impacted, on back of lacklustre growth in US, while domestic markets should post
robust growth during the period. On the operating front, the OPM’s are expected
to come in at 20.5% V/s 27.0% in 3QFY2015. Thus the, net profit would come in
at `469cr V/s `602cr in 3QFY2015, a yoy dip of 22.0%. Overall, we are neutral
on the stock.
Y/E
Sales OPM
PAT
EPS ROE P/E P/BV EV/EBITDA EV/Sales
Mar
(` cr)
(%)
(` cr)
(`)
(%) (x) (x)
(x)
(x)
FY2016E
13,092
25.0
2,266
50.4 22.8 32.8
6.8
21.9
5.5
FY2017E
16,561
27.0
3,072
68.3 24.7 24.2
5.4
15.6
4.2
Cadila Healthcare (CMP: `312 / TP: `352/ Upside:12.8% )
Cadila Healthcare is expected to post robust results during the quarter. For
3QFY2016, the company is expected to post sales of `2600cr, a yoy growth of
20.4%. The growth would be driven by the exports and domestic sales. On
operating front, the OPM is expected to come in 21.4% V/s 19.3% in 3QFY2015.
Thus, the net profit would come in at `353cr V/s `282cr, yoy growth of 25.3%. We
maintain our accumulate with a price target of `352.
Market Outlook
February 5, 2016
Y/E
Sales OPM PAT EPS ROE P/E P/BV EV/EBITDA EV/Sales
Mar
(` cr)
(%)
(` cr)
(`)
(%) (x)
(x)
(x)
(x)
FY2016E
10,224
21.0
1,496
14.6
30.8
21.3
5.8
14.9
3.1
FY2017E
11,840
22.0
1,800
17.6
29.0
17.7
4.6
11.8
2.6
IPCA Labs (CMP: `632/ TP: `900/ Upside: 42.4%)
IPCA Labs, is expected to post another lacklustre quarter. For 3QFY2016, the
company is expected to post sales of `750cr, a yoy growth of 2.2%, mainly
impacted on back of exports, while domestic formulations should see some
recovery. On operating front, the OPM is expected to come in 14.1% V/s 15.6% in
3QFY2015. Thus, the Adj. net profit would come in at `53cr V/s `49cr, yoy growth
of 8.2%. We maintain our buy with a price target of `900.
Y/E
Sales OPM PAT EPS ROE P/E P/BV EV/EBITDA EV/Sales
Mar
(` cr)
(%)
(` cr)
(`)
(%) (x)
(x)
(x)
(x)
FY2016E
3,363
12.9
169
13.4
7.4
47.2
3.4
20.5
2.6
FY2017E
3,909
18.6
354
28.0
14.0
22.6
3.0
12.2
2.3
Economic and Political News
Jayant Sinha urges 15% EPFO investment in equities
New policy coming in February to speed up nod for housing projects:
Venkaiah Naidu
India enjoying robust economic growth, says IMF chief Christine Lagarde
Corporate News
Development of KG Basin block not viable at under $4.2 a unit: ONGC
Cairn India Can't Export Excess Crude: Govt to HC
LafargeHolcim may Divest Cement Units
Market Outlook
February 5, 2016
Quarterly Bloomberg Brokers Consensus Estimate
Bosch Ltd - February 5, 2016
Particulars (` cr)
3QFY16E
3QFY15
y-o-y (%)
2QFY16
q-o-q (%)
Net sales
2,654
2,350
12.9
2,597
2.2
EBITDA
466
438
6.4
452
3.1
EBITDA margin (%)
17.6
18.6
17.4
Net profit
301
111
171.2
305
(1.3)
Divi's Laboratories Ltd
- February 5, 2016
Particulars (` cr)
3QFY16E
3QFY15
y-o-y (%)
2QFY16
q-o-q (%)
Net sales
939
788
19.2
961
(2.3)
EBITDA
360
292
23.3
376
(4.3)
EBITDA margin (%)
38.3
37.1
39.1
Net profit
274
220
24.5
295
(7.1)
Eicher Motors Ltd Consol - February 5, 2016
Particulars (` cr)
3QFY16E
3QFY15
y-o-y (%)
2QFY16
q-o-q (%)
Net sales
3,275
2,225
47.2
3,123
4.9
EBITDA
519
305
70.2
493
5.3
EBITDA margin (%)
15.8
13.7
15.8
Net profit
270
165
63.6
285
(5.3)
Lupin Ltd Consol - February 5, 2016
Particulars (` cr)
3QFY16E
3QFY15
y-o-y (%)
2QFY16
q-o-q (%)
Net sales
3,348
3,145
6.5
3,178
5.3
EBITDA
789
882
(10.5)
672
17.4
EBITDA margin (%)
23.6
28.0
21.1
Net profit
505
601
(16.0)
408
23.8
TATA Power Ltd - February 5, 2016
Particulars (` cr)
3QFY16E
3QFY15
y-o-y (%)
2QFY16
q-o-q (%)
Net sales
9,399
8,754
7.4
9,463
(0.7)
EBITDA
1,988
1,512
31.5
2,461
(19.2)
EBITDA margin (%)
21.2
17.3
26.0
Net profit
229
197
16.2
247
(7.3)
Market Outlook
February 5, 2016
Top Picks ★★★★★
Large Cap
Market Cap
CMP
Target
Upside
Company
Rationale
(` Cr)
(`)
(`)
(%)
To outpace battery industry growth due to better technological
Amara Raja Batteries
14,577
853
1,040
21.9
products leading to market share gains in both the automotive
OEM and replacement segments.
Earnings to grow strongly given the MHCV cyclical upturn.
Ashok Leyland
24,859
87
111
27.1
Focus on exports and LCV's provides additional growth
avenue.
The stock is trading at attractive valuations and is factoring all
HCL Tech
1,22,251
867
1,038
19.7
the bad news.
Strong visibility for a robust 20% earnings trajectory, coupled
HDFC Bank
2,65,316
1,050
1,262
20.2
with high quality of earnings on account of high quality retail
business and strategic focus on highly rated corporates.
Back on the growth trend, expect a long term growth of 14%
Infosys
2,71,017
1,180
1,347
14.2
to be a US$20bn in FY2020.
Well positioned to benefit from such expected gradual
recovery in the overall domestic capex cycle, given its presence
Larsen & Toubro
1,05,791
1,136
1,310
15.3
across various infrastructure segments, its execution
capabilities, and its strong balance sheet.
LICHF continues to grow its retail loan book at a healthy pace
with improvement in asset quality. We expect the company to
LIC Housing Finance
22,087
438
592
35.2
post a healthy loan book which is likely to reflect in a strong
earnings growth.
Source: Company, Angel Research
Mid Cap
Market Cap
CMP
Target
Upside
Company
Rationale
(` Cr)
(`)
(`)
(%)
Favourable outlook for the AC industry to augur well for
Cooling products business which is out pacing the market
Blue Star
3,177
353
439
24.3
growth. EMPPAC division's profitability to improve once
operating environment turns around.
Change in business focus towards high-margin chronic &
Garware Wall Ropes
761
348
473
35.9
lifestyle segments and increasing penetration in Europe and
US
Economic recovery to have favourable impact on advertising &
circulation revenue growth. Further, the acquisition of a radio
Jagran Prakashan
5,106
156
189
21.0
business (Radio City) would also boost the company's revenue
growth.
Massive capacity expansion along with rail advantage at ICD
Navkar Corporation
2,679
188
265
41.1
as well CFS augurs well for the company
Earnings boost on back of stable material prices and
Radico Khaitan
1,451
109
156
43.0
favourable pricing environment. Valuation discount to peers
provides additional comfort
Strong brands and distribution network would boost growth
Siyaram Silk Mills
984
1,050
1,354
29.0
going ahead. Stock currently trades at an inexpensive
valuation.
Structural shift in the Lighting industry towards LED lighting will
Surya Roshni
619
141
201
42.3
drive growth.
Source: Company, Angel Research
Market Outlook
February 5, 2016
Key Upcoming Events
Result Calendar
Date
Company
Bosch India, Vijaya Bank, Goodyear, Lupin, Cadila Healthcare, Divi's Lab., Dishman Pharma, Tata Power Co., PTC
February 05, 2016
India, Radico Khaitan
February 06, 2016
Prakash Industries, TVS Srichakra
February 08, 2016
JK Tyre, GlaxoSmith Con, Hitachi, Sterling Tools, Ipca labs
Motherson Sumi, Bharat Forge, Apollo Tyres, Ramco Cements, Punjab Natl.Bank, Power Fin.Corpn., Allahabad Bank,
February 09, 2016
Central Bank, Dena Bank, Britannia, SAIL, Hindalco, MOIL, GAIL, Essar Oil, Dr Reddy's, Aurobindo Pharma, CESC
Tata Chemicals, Tata Global, Automotive Axle, Areva, Ambuja Cements, ACC, India Cements, Rural Elec.Corp., UCO
February 10, 2016
Bank, Bank of Maharashtra, Petronet LNG, Bajaj Electrical, Finolex Cables, Cipla, GSK Pharma, NHPC
Tata Motors, Hero Motocorp, Ashok Leyland, BHEL, BGR Energy , J & K Bank, St Bk of India, Union Bank, Indian Bank,
February 11, 2016
Oriental Bank, Coal India, Nalco, ONGC, Indraprasth Gas, Page Industries, GIPCL, Unitech, Coffee Day Enterprises
Ltd
M&M, FAG Bearings, Canara Bank, Andhra Bank, Corporation Bank, Nestle, Sun TV Network, NMDC, Bhushan Steel,
February 12, 2016
Monnet Ispat, IOC, BPCL, HPCL, Sun Pharma, Anant Raj
February 13, 2016
Bank of Baroda, Adani Power
Source: Bloomberg, Angel Research
Global economic events release calendar
Bloomberg Data
Date
Time
Country
Event Description
Unit
Period
Last Reported
Estimated
Feb 05, 2016
7:00 PM US
Change in Nonfarm payrolls
Thousands
Jan
292.00
190.00
7:00 PM US
Unnemployment rate
%
Jan
5.00
5.00
Feb 10, 2016
India
Imports YoY%
% Change
Jan
(3.90)
India
Exports YoY%
% Change
Jan
(14.70)
3:00 PM UK
Industrial Production (YoY)
% Change
Dec
0.90
1.00
Feb 12, 2016
7:30 AM India
Industrial Production YoY
% Change
Dec
(3.20)
3:30 PM Euro Zone Euro-Zone GDP s.a. (QoQ)
% Change
4Q A
0.30
0.30
12:30 PM Germany GDP nsa (YoY)
% Change
4Q P
1.80
Feb 15, 2016
12:00 PM India
Monthly Wholesale Prices YoY%
% Change
Jan
(0.73)
China
Exports YoY%
% Change
Jan
(1.40)
(2.00)
Feb 16, 2016
3:00 PM UK
CPI (YoY)
% Change
Jan
0.20
Feb 17, 2016
7:00 PM US
Housing Starts
Thousands
Jan
1,149.00
7:00 PM US
Building permits
Thousands
Jan
1,204.00
3:00 PM UK
Jobless claims change
% Change
Jan
(4.30)
7:45 PM US
Industrial Production
%
Jan
(0.36)
US
Producer Price Index (mom)
% Change
Jan
(0.70)
Feb 18, 2016
7:00 AM China
Consumer Price Index (YoY)
% Change
Jan
1.60
Feb 19, 2016
7:00 PM US
Consumer price index (mom)
% Change
Jan
(0.10)
8:30 PM Euro Zone Euro-Zone Consumer Confidence
Value
Feb A
(6.30)
Source: Bloomberg, Angel Research
Market Outlook
February 5, 2016
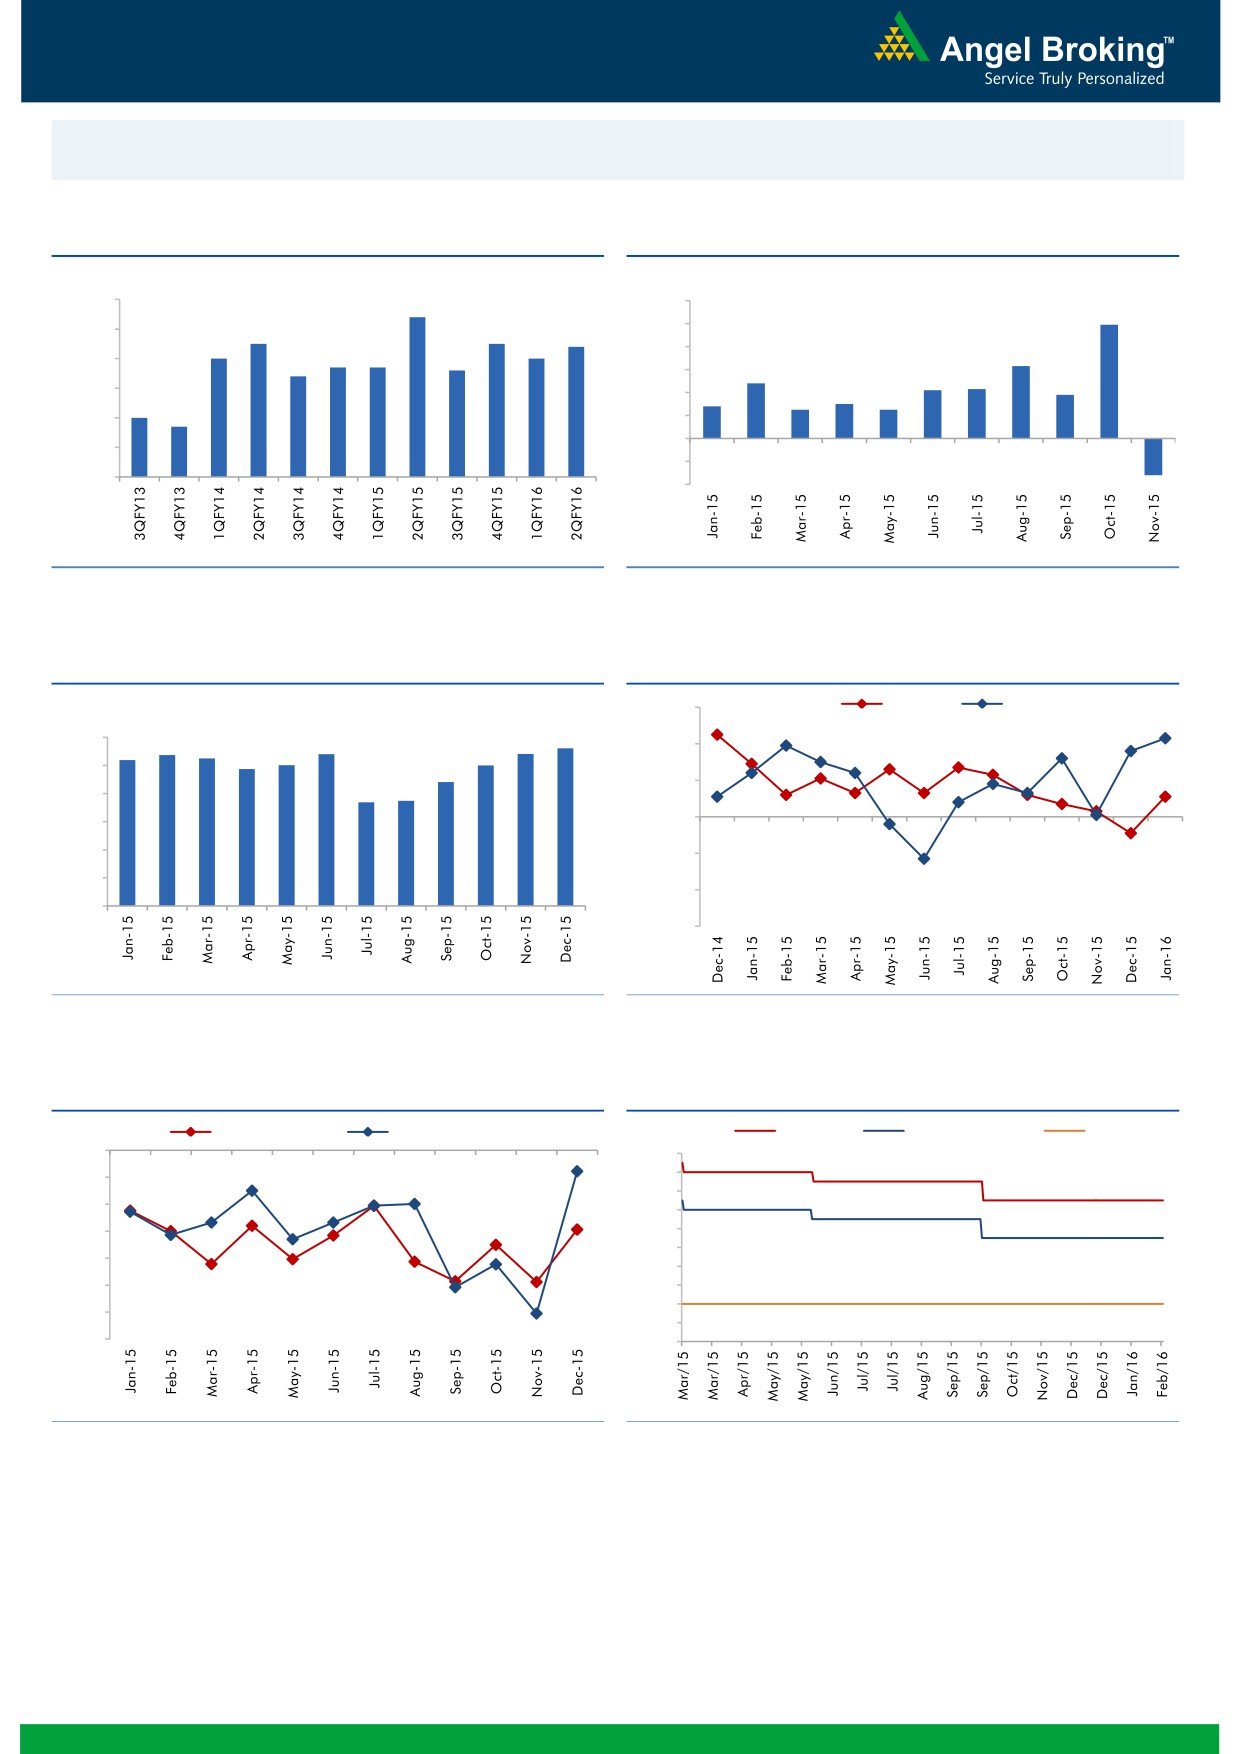
Macro watch
Exhibit 1: Quarterly GDP trends
Exhibit 2: IIP trends
(%)
(%)
9.0
8.4
12.0
9.9
7.5
7.5
10.0
8.0
7.4
7.0
7.0
6.7
6.7
6.6
8.0
6.3
7.0
6.4
6.0
4.8
4.3
4.2
3.8
6.0
2.8
3.0
4.0
2.5
2.5
5.0
4.7
5.0
2.0
(3.2)
-
4.0
(2.0)
3.0
(4.0)
Source: CSO, Angel Research
Source: MOSPI, Angel Research
Exhibit 3: Monthly CPI inflation trends
Exhibit 4: Manufacturing and services PMI
(%)
56.0
Mfg. PMI
Services PMI
5.4
5.4
5.6
6.0
5.2
5.4
5.3
54.0
4.9
5.0
5.0
5.0
4.4
3.7
3.7
52.0
4.0
3.0
50.0
2.0
48.0
1.0
46.0
-
44.0
Source: MOSPI, Angel Research
Source: Market, Angel Research; Note: Level above 50 indicates expansion
Exhibit 5: Exports and imports growth trends
Exhibit 6: Key policy rates
(%)
Exports yoy growth
Imports yoy growth
(%)
Repo rate
Reverse Repo rate
CRR
0.0
8.00
7.50
(5.0)
7.00
(10.0)
6.50
(15.0)
6.00
5.50
(20.0)
5.00
(25.0)
4.50
4.00
(30.0)
3.50
(35.0)
3.00
Source: Bloomberg, Angel Research
Source: RBI, Angel Research
Market Outlook
February 5, 2016
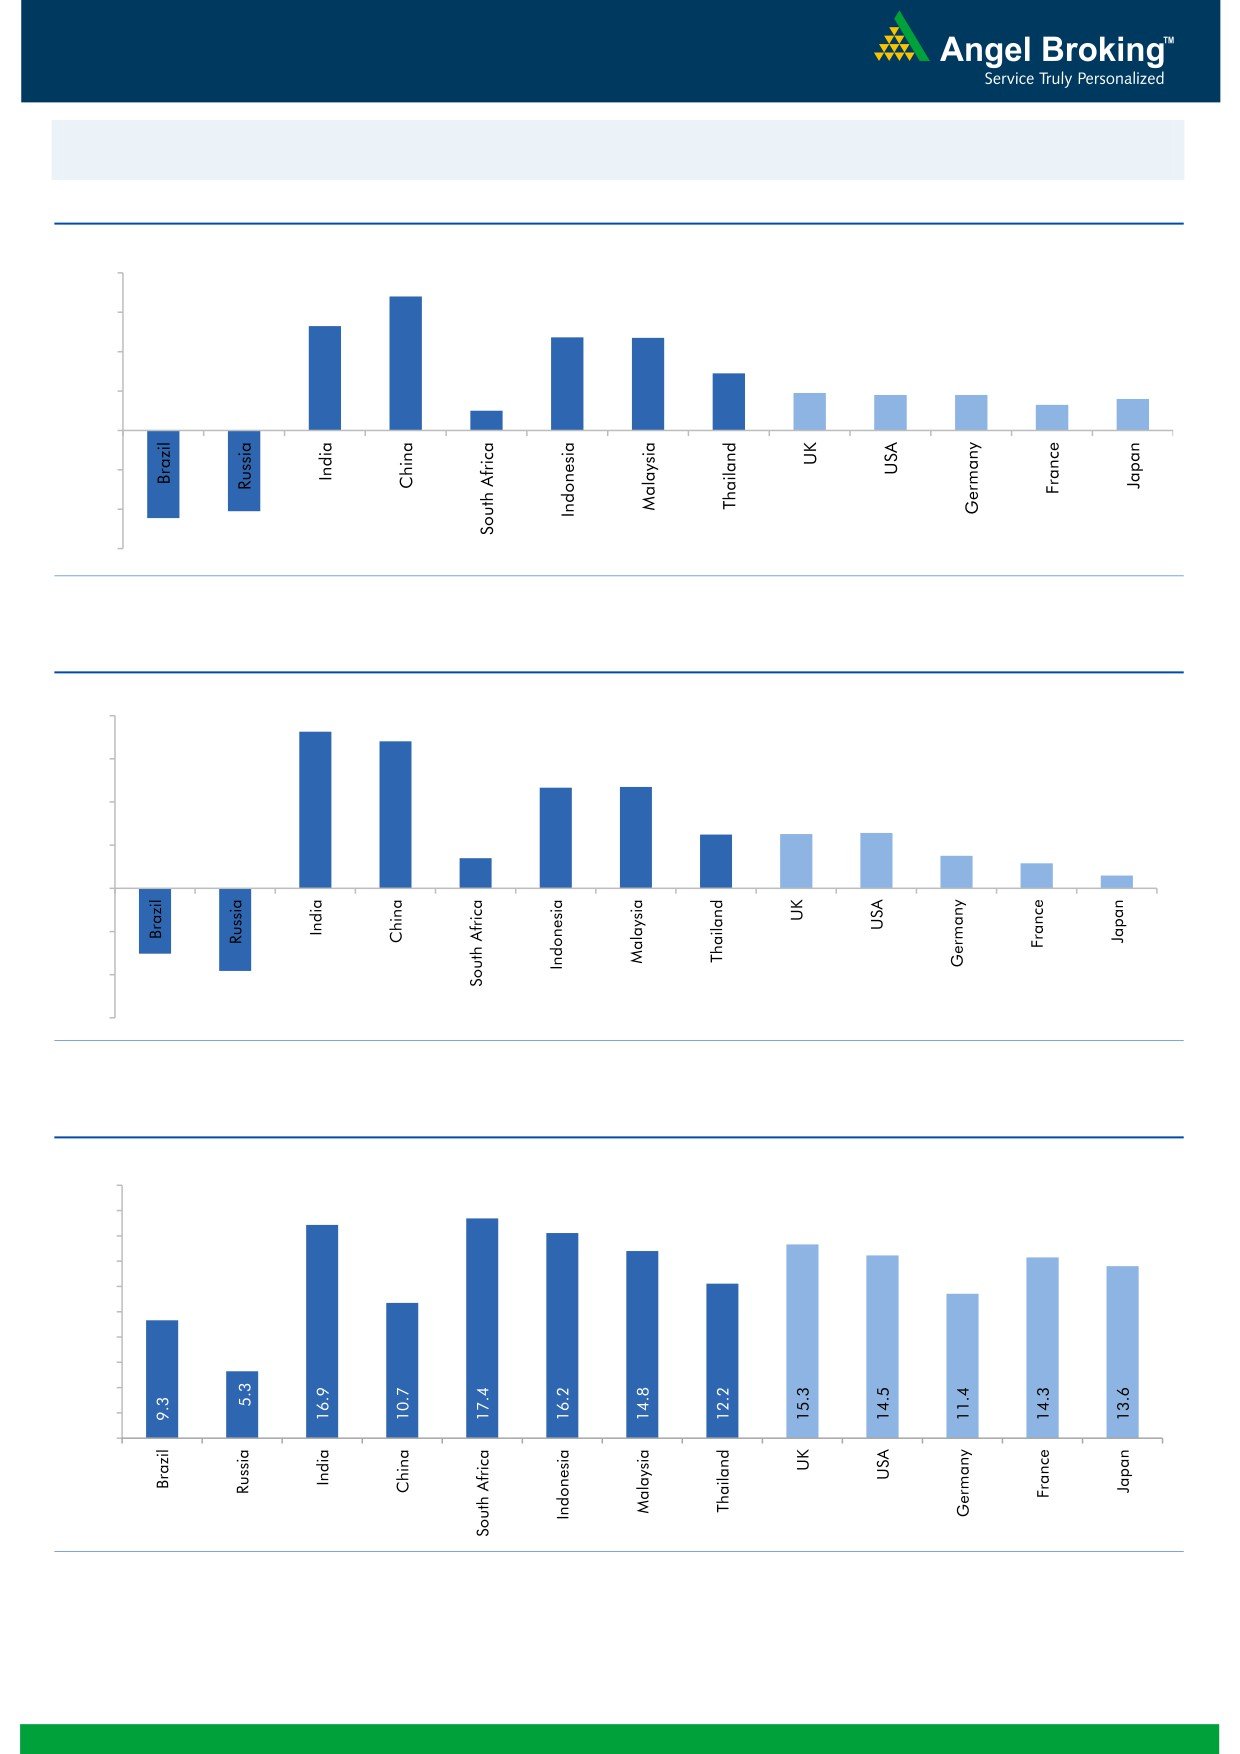
Global watch
Exhibit 1: Latest quarterly GDP Growth (%, yoy) across select developing and developed countries
(%)
8.0
6.8
6.0
5.3
4.7
4.7
4.0
2.9
1.9
1.8
1.8
1.3
1.6
2.0
1.0
-
(2.0)
(4.0)
(4.1)
(4.5)
(6.0)
Source: Bloomberg, Angel Research
Exhibit 2: 2015 GDP Growth projection by IMF (%, yoy) across select developing and developed countries
(%)
8.0
7.3
6.8
6.0
4.7
4.7
4.0
2.5
2.5
2.6
1.4
1.5
2.0
1.2
0.6
-
(2.0)
(3.0)
(4.0)
(3.8)
(6.0)
Source: IMF, Angel Research
Exhibit 3: One year forward P-E ratio across select developing and developed countries
(x)
20.0
18.0
16.0
14.0
12.0
10.0
8.0
6.0
4.0
2.0
-
Source: IMF, Angel Research
Market Outlook
February 5, 2016
Exhibit 4: Relative performance of indices across globe
Returns (%)
Country
Name of index
Closing price
1M
3M
1YR
Brazil
Bovespa
40,822
(5.2)
(14.5)
(17.8)
Russia
Micex
1,788
0.8
3.7
7.3
India
Nifty
7,404
(5.0)
(8.0)
(15.9)
China
Shanghai Composite
2,781
(15.4)
(21.1)
(17.1)
South Africa
Top 40
44,292
(1.3)
(9.2)
(3.0)
Mexico
Mexbol
43,752
0.7
(3.1)
4.1
Indonesia
LQ45
814
3.1
7.1
(10.9)
Malaysia
KLCI
1,657
(2.1)
(0.6)
(7.8)
Thailand
SET 50
821
4.5
(10.3)
(22.7)
USA
Dow Jones
16,417
(6.2)
(7.5)
(7.6)
UK
FTSE
5,899
(3.9)
(7.6)
(13.9)
Japan
Nikkei
17,045
(7.6)
(10.0)
(4.1)
Germany
DAX
9,393
(9.2)
(14.5)
(13.7)
France
CAC
4,229
(7.1)
(14.8)
(9.9)
Source: Bloomberg, Angel Research
Stock Watch
February 05, 2016
Company Name
Reco
CMP
Target
Mkt Cap
Sales ( Čcr )
OPM(%)
EPS (Č)
PER(x)
P/BV(x)
RoE(%)
EV/Sales(x)
(Č)
Price ( Č)
( Č cr )
FY16E FY17E
FY16E
FY17E
FY16E
FY17E
FY16E
FY17E
FY16E
FY17E
FY16E
FY17E
FY16E
FY17E
Agri / Agri Chemical
Rallis
Neutral
158
-
3,067
2,097
2,415
14.4
14.4
9.5
11.0
16.6
14.3
3.3
2.9
21.1
21.3
1.5
1.3
United Phosphorus
Buy
405
480
17,367
12,500
14,375
18.3
18.3
29.8
35.9
13.6
11.3
2.5
2.1
20.0
20.3
1.5
1.2
Auto & Auto Ancillary
Ashok Leyland
Buy
87
111
24,859
17,995
21,544
11.4
11.6
3.4
4.7
25.7
18.6
4.5
4.1
17.7
22.2
1.3
1.1
Bajaj Auto
Buy
2,310
2,728
66,845
23,695
27,298
21.3
20.4
134.6
151.5
17.2
15.3
5.5
4.7
31.8
30.6
2.4
2.0
Bharat Forge
Buy
792
943
18,442
7,867
8,881
20.0
20.3
34.4
41.0
23.0
19.3
4.5
3.7
21.1
20.9
2.5
2.1
Eicher Motors
Accumulate
16,894
19,036
45,875
15,379
16,498
15.6
16.6
473.2
574.8
35.7
29.4
13.2
9.8
36.7
33.2
2.9
2.7
Gabriel India
Accumulate
88
101
1,264
1,415
1,544
8.7
9.0
4.6
5.4
19.1
16.3
3.5
3.1
18.1
18.9
0.9
0.8
Hero Motocorp
Accumulate
2,511
2,774
50,132
28,561
31,559
14.7
14.7
151.1
163.2
16.6
15.4
6.4
5.5
38.7
35.6
1.6
1.4
Jamna Auto Industries Neutral
138
-
1,105
1,292
1,486
9.3
9.8
6.0
7.5
23.1
18.4
4.8
4.0
20.7
21.8
0.9
0.8
L G Balakrishnan & Bros Neutral
453
-
711
1,254
1,394
11.6
11.8
35.9
41.7
12.6
10.9
1.7
1.5
13.5
13.8
0.7
0.6
Mahindra and Mahindra Buy
1,201
1,449
74,603
39,031
44,440
13.8
13.9
57.9
67.6
20.8
17.8
3.4
3.0
16.1
16.6
1.6
1.3
Maruti
Neutral
3,794
-
114,605
57,865
68,104
16.4
16.7
176.3
225.5
21.5
16.8
4.2
3.6
19.4
21.2
1.8
1.4
Minda Industries
Buy
884
1,047
1,402
2,523
2,890
8.7
9.0
55.0
65.4
16.1
13.5
3.1
2.5
19.3
18.7
0.7
0.5
Motherson Sumi
Buy
263
313
34,768
39,343
45,100
8.8
9.1
10.1
12.5
26.0
21.0
8.2
6.5
35.3
34.4
1.0
0.8
Rane Brake Lining
Buy
369
465
292
454
511
11.5
12.0
25.2
31.0
14.7
11.9
2.2
2.0
14.9
16.6
0.8
0.7
Setco Automotive
Neutral
33
-
446
594
741
12.7
13.7
1.7
3.2
19.6
10.4
2.1
1.8
10.4
16.9
1.2
1.0
Tata Motors
Buy
326
409
94,108
266,022
312,667
12.8
13.1
26.3
38.3
12.4
8.5
1.6
1.4
8.4
12.1
0.5
0.5
TVS Motor
Accumulate
281
322
13,367
11,263
13,106
6.9
8.3
9.2
14.6
30.6
19.3
7.0
5.6
22.7
29.1
1.2
1.0
Amara Raja Batteries
Buy
853
1,040
14,577
4,892
5,871
17.4
17.6
28.8
37.1
29.6
23.0
6.9
5.5
23.4
24.1
2.9
2.4
Exide Industries
Buy
122
162
10,345
6,950
7,784
14.4
14.8
6.6
7.3
18.4
16.7
2.3
2.1
12.6
12.8
1.2
1.1
Apollo Tyres
Buy
141
171
7,170
12,146
12,689
16.8
16.0
21.2
19.0
6.6
7.4
1.1
1.0
16.5
13.0
0.7
0.7
Ceat
Buy
892
1,119
3,607
6,041
6,597
14.1
13.7
99.5
111.9
9.0
8.0
1.8
1.5
19.6
18.5
0.7
0.6
JK Tyres
Neutral
88
-
1,990
7,446
7,669
15.2
14.0
19.6
18.4
4.5
4.8
1.1
0.9
25.2
19.5
0.7
0.6
Swaraj Engines
Accumulate
849
919
1,054
552
630
14.2
14.7
44.6
54.1
19.0
15.7
4.4
4.0
23.2
25.6
1.8
1.5
Subros
Neutral
87
-
519
1,293
1,527
11.8
11.9
4.2
6.7
20.6
12.9
1.6
1.4
7.7
11.5
0.7
0.6
Indag Rubber
Neutral
179
-
470
283
329
17.0
17.2
13.0
15.4
13.8
11.6
3.0
2.5
21.8
21.6
1.4
1.1
Capital Goods
ACE
Neutral
38
-
379
660
839
4.7
8.2
1.0
3.9
38.3
9.8
1.2
1.1
3.2
11.3
0.7
0.6
BEML
Neutral
995
-
4,146
3,277
4,006
6.0
8.9
29.2
64.3
34.1
15.5
1.9
1.7
5.7
11.7
1.4
1.1
Bharat Electronics
Buy
1,221
1,414
29,302
7,737
8,634
16.8
17.2
54.0
61.0
22.6
20.0
3.2
2.9
39.3
45.6
2.9
2.5
Stock Watch
February 05, 2016
Company Name
Reco
CMP
Target
Mkt Cap
Sales ( Čcr )
OPM(%)
EPS (Č)
PER(x)
P/BV(x)
RoE(%)
EV/Sales(x)
(Č)
Price ( Č)
( Č cr )
FY16E
FY17E
FY16E
FY17E
FY16E
FY17E
FY16E
FY17E
FY16E
FY17E
FY16E
FY17E
FY16E
FY17E
Capital Goods
Voltas
Buy
274
353
9,058
5,363
5,963
8.0
9.1
11.0
13.8
24.9
19.8
3.8
3.4
16.2
17.9
1.6
1.5
BGR Energy
Neutral
109
-
787
3,615
3,181
9.5
9.4
16.7
12.4
6.5
8.8
0.6
0.6
10.0
7.0
0.6
0.8
BHEL
Neutral
130
-
31,709
33,722
35,272
10.8
11.7
10.5
14.2
12.3
9.1
0.9
0.9
7.0
9.0
1.0
1.0
Blue Star
Buy
353
439
3,177
3,548
3,977
6.3
6.9
13.7
17.2
25.8
20.6
6.5
4.2
26.1
25.4
1.0
0.8
Crompton Greaves
Neutral
134
-
8,402
13,484
14,687
4.9
6.2
4.5
7.1
29.8
18.9
2.1
2.0
7.2
10.8
0.8
0.7
Greaves Cotton
Neutral
130
-
3,164
1,655
1,755
16.6
16.8
7.4
7.8
17.5
16.6
3.5
3.3
21.1
20.6
1.9
1.7
Inox Wind
Buy
287
458
6,369
4,980
5,943
17.0
17.5
26.6
31.6
10.8
9.1
3.2
2.4
35.0
30.0
1.4
1.1
KEC International
Neutral
113
-
2,894
8,791
9,716
6.1
6.8
5.4
8.2
20.8
13.7
2.1
1.9
10.0
14.0
0.5
0.5
Thermax
Neutral
795
-
9,471
6,413
7,525
7.4
8.5
30.5
39.3
26.1
20.2
4.0
3.5
15.0
17.0
1.5
1.2
Cement
ACC
Buy
1,270
1,630
23,842
13,151
14,757
16.4
18.3
63.9
83.4
19.9
15.2
2.6
2.4
13.3
16.1
1.7
1.4
Ambuja Cements
Buy
196
233
30,378
11,564
12,556
19.4
20.7
8.9
10.1
22.0
19.4
2.8
2.6
12.8
13.8
2.3
2.1
HeidelbergCement
Neutral
73
-
1,643
1,772
1,926
13.3
15.4
1.0
3.0
72.5
24.2
1.8
1.7
2.6
7.9
1.5
1.3
India Cements
Buy
82
112
2,525
4,216
4,840
18.0
19.5
4.0
9.9
20.6
8.3
0.8
0.8
4.0
9.5
0.9
0.7
JK Cement
Buy
470
744
3,285
3,661
4,742
10.1
15.8
18.0
61.0
26.1
7.7
1.9
1.7
7.5
22.9
1.4
1.0
J K Lakshmi Cement
Buy
272
430
3,195
2,947
3,616
16.7
19.9
11.5
27.2
23.6
10.0
2.2
1.9
9.8
20.8
1.5
1.2
Mangalam Cements
Neutral
179
-
477
1,053
1,347
10.5
13.3
8.4
26.0
21.3
6.9
0.9
0.8
4.3
12.5
0.8
0.6
Orient Cement
Buy
138
183
2,821
1,854
2,524
21.2
22.2
7.7
11.1
17.9
12.4
2.6
2.2
13.3
15.7
2.3
1.6
Ramco Cements
Neutral
379
-
9,017
4,036
4,545
20.8
21.3
15.1
18.8
25.1
20.2
3.1
2.7
12.9
14.3
2.7
2.4
Shree Cement^
Neutral
10,473
-
36,484
7,150
8,742
26.7
28.6
228.0
345.5
45.9
30.3
6.8
5.7
15.7
20.3
4.9
3.9
UltraTech Cement
Buy
2,770
3,282
76,021
25,021
30,023
19.1
21.6
89.0
132.0
31.1
21.0
3.6
3.1
12.2
15.9
3.1
2.6
Construction
ITNL
Neutral
77
-
2,517
7,360
8,825
34.0
35.9
7.0
9.0
10.9
8.5
0.4
0.4
3.2
3.7
3.7
3.6
KNR Constructions
Buy
499
673
1,404
937
1,470
14.3
14.0
33.5
38.6
14.9
12.9
2.3
2.0
15.4
15.4
1.6
1.0
Larsen & Toubro
Buy
1,136
1,310
105,791
58,870
65,708
8.3
10.3
42.0
53.0
27.1
21.4
1.9
1.7
8.8
11.2
2.0
1.8
Gujarat Pipavav Port
Neutral
150
-
7,244
629
684
51.0
52.2
6.4
5.9
23.4
25.4
3.1
2.8
15.9
12.7
11.2
10.1
MBL Infrastructures
Buy
157
285
652
2,313
2,797
12.2
14.6
19.0
20.0
8.3
7.9
0.9
0.8
11.3
10.6
1.0
0.9
Nagarjuna Const.
Neutral
62
-
3,427
7,892
8,842
8.8
9.1
3.0
5.3
20.6
11.6
1.0
1.0
5.0
8.5
0.7
0.6
PNC Infratech
Accumulate
494
558
2,532
1,873
2,288
13.2
13.5
24.0
32.0
20.6
15.4
2.0
1.8
12.1
12.3
1.5
1.2
Simplex Infra
Neutral
270
-
1,335
5,955
6,829
10.3
10.5
16.0
31.0
16.9
8.7
0.9
0.8
5.3
9.9
0.7
0.6
Power Mech Projects
Neutral
585
-
861
1,539
1,801
12.8
12.7
59.0
72.1
9.9
8.1
1.5
1.3
18.6
16.8
0.6
0.5
Stock Watch
February 05, 2016
Company Name
Reco
CMP
Target
Mkt Cap
Sales ( Čcr )
OPM(%)
EPS (Č)
PER(x)
P/BV(x)
RoE(%)
EV/Sales(x)
(Č)
Price ( Č)
( Č cr )
FY16E
FY17E
FY16E
FY17E
FY16E
FY17E
FY16E
FY17E
FY16E
FY17E
FY16E
FY17E
FY16E
FY17E
Construction
Sadbhav Engineering
Neutral
303
-
5,201
3,481
4,219
10.7
10.8
8.0
12.0
37.9
25.3
3.5
3.1
10.3
13.5
1.8
1.5
NBCC
Buy
945
1,089
11,342
7,382
9,506
7.7
8.6
39.8
54.4
23.8
17.4
5.7
4.5
26.7
29.1
1.3
1.0
MEP Infra
Neutral
42
-
676
1,956
1,876
28.1
30.5
1.3
3.0
32.0
13.9
6.7
4.5
21.2
32.8
1.8
1.7
SIPL
Neutral
85
-
2,982
675
1,042
62.4
64.7
-
-
3.2
3.6
-
-
16.1
10.9
Financials
Allahabad Bank
Neutral
50
-
2,988
8,569
9,392
2.8
2.9
16.3
27.5
3.1
1.8
0.3
0.2
7.6
11.9
-
-
Axis Bank
Buy
382
494
90,934
26,473
31,527
3.5
3.6
35.7
43.5
10.7
8.8
1.8
1.6
17.9
18.9
-
-
Bank of Baroda
Neutral
123
-
28,330
18,485
21,025
1.9
2.0
13.5
21.1
9.1
5.8
0.7
0.6
7.3
10.6
-
-
Bank of India
Neutral
93
-
7,571
15,972
17,271
1.9
2.0
15.3
33.4
6.1
2.8
0.3
0.2
3.6
7.6
-
-
Canara Bank
Neutral
182
-
9,893
15,441
16,945
2.0
2.1
46.6
70.4
3.9
2.6
0.3
0.3
8.0
11.2
-
-
Dena Bank
Neutral
33
-
2,152
3,440
3,840
2.1
2.3
7.3
10.0
4.6
3.3
0.4
0.3
6.1
7.9
-
-
Federal Bank
Neutral
45
-
7,738
3,477
3,999
3.0
3.0
5.0
6.2
9.0
7.2
0.9
0.8
10.6
11.9
-
-
HDFC
Neutral
1,170
-
184,711
10,358
11,852
3.3
3.3
41.1
47.0
28.5
24.9
5.4
4.9
24.7
24.9
-
-
HDFC Bank
Buy
1,050
1,262
265,316
38,309
47,302
4.3
4.3
49.3
61.1
21.3
17.2
3.7
3.2
18.5
19.7
-
-
ICICI Bank
Buy
204
254
118,602
34,279
39,262
3.3
3.3
21.0
24.4
9.7
8.4
1.6
1.4
14.4
14.7
-
-
IDBI Bank
Neutral
56
-
10,593
9,625
10,455
1.8
1.8
8.5
14.2
6.5
3.9
0.4
0.4
5.9
9.3
-
-
Indian Bank
Neutral
86
-
4,109
6,160
6,858
2.5
2.5
24.5
29.8
3.5
2.9
0.3
0.2
7.7
8.6
-
-
LIC Housing Finance
Buy
438
592
22,087
3,101
3,745
2.5
2.5
33.0
40.2
13.3
10.9
2.5
2.1
19.7
20.5
-
-
Oriental Bank
Neutral
100
-
2,995
7,643
8,373
2.4
2.4
37.2
45.4
2.7
2.2
0.2
0.2
8.2
9.4
-
-
Punjab Natl.Bank
Neutral
91
-
17,859
23,638
26,557
2.8
2.8
17.9
27.2
5.1
3.3
0.5
0.4
8.5
12.0
-
-
South Ind.Bank
Neutral
18
-
2,457
1,965
2,185
2.5
2.5
2.5
3.3
7.3
5.5
0.7
0.7
9.5
11.7
-
-
St Bk of India
Buy
163
202
126,572
82,520
93,299
2.7
2.8
20.0
24.5
8.1
6.7
0.9
0.8
11.5
12.8
-
-
Union Bank
Neutral
124
-
8,555
12,646
14,129
2.3
2.4
31.0
39.1
4.0
3.2
0.4
0.4
9.8
11.4
-
-
Vijaya Bank
Neutral
30
-
2,543
3,536
3,827
1.9
1.9
5.5
6.7
5.4
4.5
0.4
0.4
7.8
8.8
-
-
Yes Bank
Neutral
760
-
31,911
7,190
9,011
3.2
3.3
58.2
69.7
13.1
10.9
2.3
2.0
19.2
19.6
-
-
FMCG
Asian Paints
Neutral
889
-
85,244
16,553
19,160
16.0
16.2
17.7
21.5
50.3
41.3
13.3
12.0
29.4
31.2
5.0
4.3
Britannia
Neutral
2,856
-
34,260
8,065
9,395
9.6
10.2
47.2
65.5
60.5
43.6
20.1
19.0
38.3
41.2
4.1
3.5
Colgate
Neutral
833
-
22,646
4,836
5,490
19.5
19.7
48.5
53.2
17.2
15.7
12.6
11.0
99.8
97.5
4.6
4.0
Dabur India
Accumulate
247
267
43,486
9,370
10,265
17.1
17.2
7.3
8.1
33.7
30.5
10.2
8.3
33.7
30.6
4.5
4.1
GlaxoSmith Con*
Accumulate
5,779
6,118
24,306
4,919
5,742
17.2
17.4
168.3
191.2
34.4
30.2
9.7
8.3
28.8
28.9
4.5
3.8
Stock Watch
February 05, 2016
Company Name
Reco
CMP
Target
Mkt Cap
Sales ( Čcr )
OPM(%)
EPS (Č)
PER(x)
P/BV(x)
RoE(%)
EV/Sales(x)
(Č)
Price ( Č)
( Č cr )
FY16E FY17E
FY16E
FY17E
FY16E
FY17E
FY16E
FY17E
FY16E
FY17E
FY16E
FY17E
FY16E
FY17E
FMCG
Godrej Consumer
Neutral
1,238
-
42,141
10,168
12,886
16.1
16.1
32.1
38.4
38.6
32.2
7.8
7.2
19.7
21.0
4.2
3.3
HUL
Neutral
835
-
180,597
34,940
38,957
17.5
17.7
20.8
24.7
40.1
33.8
44.6
35.7
110.5
114.2
5.0
4.4
ITC
Buy
322
382
258,551
41,068
45,068
37.8
37.4
13.9
15.9
23.1
20.2
7.7
6.8
34.1
33.8
5.9
5.4
Marico
Neutral
225
-
29,042
6,551
7,766
15.7
16.0
10.4
12.5
21.7
18.0
6.3
5.2
33.2
32.4
4.4
3.7
Nestle*
Buy
5,479
6,646
52,821
11,291
12,847
22.2
22.3
158.9
184.6
34.5
29.7
18.0
16.2
55.0
57.3
4.5
3.9
Tata Global
Buy
122
144
7,675
8,635
9,072
9.8
9.9
6.5
7.6
18.7
16.0
1.9
1.8
6.8
7.4
0.8
0.8
IT
HCL Tech^
Buy
867
1,038
122,251
42,038
47,503
21.2
21.5
51.5
57.7
16.8
15.0
3.6
2.8
21.5
18.8
2.5
2.0
Infosys
Accumulate
1,180
1,347
271,017
61,850
69,981
27.5
27.5
59.4
65.7
19.9
18.0
4.2
3.6
21.2
20.1
3.7
3.1
TCS
Buy
2,417
2,854
476,341
108,487
122,590
28.3
28.5
122.8
138.4
19.7
17.5
7.5
6.8
38.0
38.9
4.0
3.5
Tech Mahindra
Buy
469
646
45,382
25,566
28,890
16.0
17.0
26.3
31.9
17.8
14.7
3.2
2.7
17.9
18.6
1.5
1.3
Wipro
Buy
560
719
138,248
50,808
58,713
23.7
23.8
37.3
42.3
15.0
13.2
2.8
2.5
19.0
17.9
2.3
1.8
Media
D B Corp
Accumulate
320
356
5,883
2,241
2,495
27.8
27.9
21.8
25.6
14.7
12.5
3.8
3.4
26.7
28.5
2.6
2.3
HT Media
Neutral
76
-
1,765
2,495
2,603
11.2
11.2
7.3
8.6
10.4
8.8
0.8
0.7
7.4
8.1
0.2
0.2
Jagran Prakashan
Buy
156
189
5,106
2,170
2,355
27.2
26.2
8.9
9.9
17.6
15.8
3.7
3.2
20.9
20.5
2.2
2.1
Sun TV Network
Neutral
337
-
13,279
2,779
3,196
70.2
70.5
22.8
27.3
14.8
12.3
3.6
3.3
26.7
28.3
4.5
3.9
Hindustan Media
Neutral
270
-
1,978
920
1,031
20.0
20.0
19.2
20.9
14.0
12.9
2.3
2.0
16.4
15.3
1.7
1.5
Ventures
Metals & Mining
Coal India
Buy
321
380
203,040
76,167
84,130
19.9
22.3
22.4
25.8
14.3
12.5
5.2
5.0
35.5
41.0
2.0
1.8
Hind. Zinc
Accumulate
161
175
68,176
14,641
14,026
50.4
50.4
17.7
16.0
9.1
10.1
1.4
1.3
16.2
13.2
2.3
2.1
Hindalco
Neutral
69
-
14,176
104,356
111,186
8.7
9.5
6.7
11.1
10.2
6.2
0.4
0.4
3.5
5.9
0.7
0.6
JSW Steel
Neutral
1,011
-
24,426
42,308
45,147
16.4
20.7
(10.3)
49.5
20.4
1.1
1.1
(1.0)
5.6
1.6
1.5
NMDC
Neutral
81
-
32,154
8,237
10,893
46.6
44.5
10.0
11.7
8.2
7.0
0.9
0.8
12.5
13.0
3.7
2.8
SAIL
Neutral
39
-
15,901
45,915
53,954
7.2
10.5
1.5
4.4
25.6
8.8
0.4
0.4
2.3
4.1
1.0
0.9
Vedanta
Neutral
68
-
20,086
71,445
81,910
26.2
26.3
12.9
19.2
5.3
3.5
0.4
0.3
7.2
8.9
0.7
0.5
Tata Steel
Neutral
226
-
21,964
126,760
137,307
8.9
11.3
6.4
23.1
35.5
9.8
0.7
0.7
2.0
7.1
0.8
0.7
Oil & Gas
Cairn India
Neutral
123
-
22,986
11,323
12,490
49.4
51.0
20.7
20.7
5.9
5.9
0.4
0.4
6.4
6.1
1.1
0.5
GAIL
Neutral
355
-
44,980
64,856
70,933
9.1
9.6
24.0
28.9
14.8
12.3
1.3
1.2
8.8
9.6
0.9
0.8
ONGC
Neutral
220
-
188,306
154,564
167,321
36.8
37.4
28.6
32.5
7.7
6.8
1.0
0.9
12.7
13.5
1.4
1.3
Petronet LNG
Neutral
255
-
19,110
29,691
31,188
5.8
6.2
12.8
13.4
19.9
19.0
3.0
2.7
15.8
14.8
0.7
0.7
Indian Oil Corp
Buy
389
455
94,557
359,607
402,760
5.9
6.1
42.5
48.7
9.2
8.0
1.2
1.1
14.1
14.4
0.4
0.3
Stock Watch
February 05, 2016
Company Name
Reco
CMP
Target
Mkt Cap
Sales ( Čcr )
OPM(%)
EPS (Č)
PER(x)
P/BV(x)
RoE(%)
EV/Sales(x)
(Č)
Price ( Č)
( Č cr )
FY16E FY17E
FY16E
FY17E
FY16E
FY17E
FY16E
FY17E
FY16E
FY17E
FY16E
FY17E
FY16E
FY17E
Oil & Gas
Reliance Industries
Buy
974
1,150
315,501
304,775
344,392
12.6
13.4
91.3
102.6
10.7
9.5
1.2
1.1
11.8
12.0
1.0
0.8
Pharmaceuticals
Alembic Pharma
Neutral
633
-
11,935
3,274
3,802
26.9
19.4
35.0
28.7
18.1
22.1
8.0
6.0
55.6
31.2
3.6
3.0
Aurobindo Pharma
Buy
741
856
43,323
14,923
17,162
22.0
23.0
35.7
42.8
20.8
17.3
6.1
4.6
34.0
30.2
3.3
2.8
Aventis*
Neutral
4,185
-
9,638
2,082
2,371
17.4
20.8
118.2
151.5
35.4
27.6
5.2
4.2
19.9
25.5
4.3
3.6
Cadila Healthcare
Accumulate
312
352
31,941
10,224
11,840
21.0
22.0
14.6
17.6
21.4
17.7
5.9
4.6
30.8
29.0
3.2
2.7
Cipla
Buy
550
636
44,203
14,211
16,611
20.6
19.0
27.0
28.9
20.4
19.0
3.5
3.0
18.4
16.8
3.1
2.6
Dr Reddy's
Buy
3,007
3,933
51,286
16,838
19,575
25.0
23.1
167.5
178.8
18.0
16.8
3.8
3.2
23.1
20.4
3.0
2.5
Dishman Pharma
Neutral
322
-
2,600
1,733
1,906
21.5
21.5
17.0
19.9
19.0
16.2
1.9
1.7
10.5
11.2
2.0
1.7
GSK Pharma*
Neutral
3,214
-
27,225
2,870
3,158
20.0
22.1
59.5
68.3
54.0
47.1
15.9
16.4
28.5
34.3
9.0
8.2
Indoco Remedies
Neutral
308
-
2,837
1,033
1,199
15.9
18.2
9.4
13.6
32.8
22.6
4.9
4.1
15.7
19.7
2.8
2.5
Ipca labs
Buy
632
900
7,975
3,363
3,909
12.9
18.6
13.4
28.0
47.2
22.6
3.4
3.0
7.4
14.0
2.7
2.3
Lupin
Neutral
1,652
-
74,433
13,092
16,561
25.0
27.0
50.4
68.3
32.8
24.2
6.8
5.4
22.8
24.7
5.4
4.2
Sun Pharma
Accumulate
833
950
200,362
28,163
32,610
25.8
30.7
17.4
26.9
47.9
31.0
4.5
3.9
13.0
16.6
6.6
5.5
Power
Tata Power
Neutral
59
-
15,971
35,923
37,402
22.6
22.8
4.1
5.2
14.6
11.5
1.1
1.0
7.5
9.3
1.4
1.3
NTPC
Buy
126
157
103,893
87,064
98,846
23.5
23.5
11.7
13.2
10.8
9.6
1.2
1.1
11.4
12.1
2.2
2.0
Power Grid
Buy
147
170
76,826
20,702
23,361
86.7
86.4
12.1
13.2
12.2
11.1
1.8
1.6
15.6
15.1
8.6
8.0
Telecom
Bharti Airtel
Neutral
305
-
121,721
101,748
109,191
32.1
31.7
12.0
12.5
25.4
24.4
1.7
1.6
6.9
6.7
1.8
1.7
Idea Cellular
Neutral
100
-
36,022
34,282
36,941
32.0
31.5
5.9
6.2
17.0
16.1
1.6
1.4
9.9
9.3
1.6
1.5
zOthers
Abbott India
Neutral
4,958
-
10,535
2,715
3,153
14.5
14.1
134.3
152.2
36.9
32.6
9.2
7.6
27.4
25.6
3.6
3.0
Bajaj Electricals
Buy
175
290
1,763
4,719
5,287
5.2
5.8
8.6
12.7
20.4
13.8
2.3
2.1
11.4
14.8
0.4
0.3
Finolex Cables
Neutral
229
-
3,508
2,520
2,883
12.2
12.0
12.7
14.2
18.1
16.2
2.5
2.2
13.6
13.5
1.1
1.0
Goodyear India*
Buy
481
622
1,109
1,888
1,680
12.1
11.9
62.2
56.6
7.7
8.5
1.8
1.6
25.9
19.7
0.4
0.4
Hitachi
Neutral
1,131
-
3,076
1,779
2,081
7.8
8.8
21.8
33.4
51.9
33.8
8.4
6.8
17.4
22.1
1.8
1.5
Jyothy Laboratories
Neutral
285
-
5,165
1,620
1,847
11.5
11.5
7.3
8.5
39.1
33.7
5.1
4.7
13.3
14.4
3.1
2.6
MRF
Buy
33,735
45,575
14,307
20,316
14,488
21.4
21.1
5,488.0
3,798.0
6.2
8.9
2.1
1.7
41.1
21.2
0.7
0.9
Page Industries
Neutral
11,897
-
13,270
1,929
2,450
19.8
20.1
229.9
299.0
51.8
39.8
22.8
15.9
52.1
47.1
6.9
5.4
Relaxo Footwears
Neutral
455
-
5,460
1,767
2,152
12.3
12.5
19.3
25.1
23.6
18.2
5.8
4.5
27.7
27.8
3.1
2.6
Siyaram Silk Mills
Buy
1,050
1,354
984
1,636
1,815
11.5
11.5
89.9
104.1
11.7
10.1
1.9
1.7
17.9
17.8
0.8
0.7
Styrolution ABS India*
Accumulate
651
698
1,145
1,271
1,440
8.6
9.2
32.0
41.1
20.3
15.9
2.1
1.9
10.7
12.4
0.9
0.8
Stock Watch
February 05, 2016
Company Name
Reco
CMP
Target
Mkt Cap
Sales ( Čcr )
OPM(%)
EPS (Č)
PER(x)
P/BV(x)
RoE(%)
EV/Sales(x)
(Č)
Price ( Č)
( Č cr )
FY16E
FY17E
FY16E
FY17E
FY16E
FY17E
FY16E
FY17E
FY16E
FY17E
FY16E
FY17E
FY16E
FY17E
zOthers
TVS Srichakra
Buy
2,486
3,240
1,903
2,101
2,338
15.7
15.0
248.6
270.0
10.0
9.2
4.4
3.1
43.6
34.0
0.9
0.8
HSIL
Accumulate
267
302
1,932
2,123
2,384
16.1
16.5
15.0
18.9
17.8
14.2
1.4
1.3
8.0
9.4
1.3
1.1
Kirloskar Engines India
Neutral
227
-
3,288
2,403
2,554
8.6
9.9
9.2
10.5
24.8
21.7
2.4
2.3
9.7
10.7
1.0
0.9
Ltd
M M Forgings
Buy
422
614
509
511
615
21.7
21.6
43.1
55.8
9.8
7.6
1.8
1.5
19.9
21.2
1.2
0.9
Banco Products (India) Neutral
118
-
843
1,208
1,353
11.0
12.3
10.8
14.5
10.9
8.1
1.3
1.1
11.9
14.5
0.7
0.6
Competent Automobiles Neutral
137
-
84
1,040
1,137
3.2
3.1
25.7
28.0
5.3
4.9
0.8
0.7
15.0
14.3
0.1
0.1
Nilkamal
Neutral
1,291
-
1,926
1,871
2,031
10.7
10.5
63.2
69.8
20.4
18.5
3.3
2.9
17.6
16.6
1.1
1.0
Visaka Industries
Buy
102
144
162
1,086
1,197
9.9
10.3
21.5
28.8
4.7
3.6
0.5
0.4
9.6
11.6
0.4
0.3
Transport Corporation of
Neutral
233
-
1,770
2,830
3,350
8.8
9.0
14.4
18.3
16.2
12.7
2.5
2.2
15.4
17.1
0.7
0.7
India
Elecon Engineering
Neutral
63
-
691
1,369
1,533
13.7
14.9
3.3
6.1
19.1
10.5
1.2
1.2
6.6
11.4
0.8
0.7
Surya Roshni
Buy
141
201
619
2,992
3,223
8.1
8.4
14.7
18.3
9.6
7.7
0.9
0.8
9.7
11.0
0.5
0.5
MT Educare
Neutral
148
-
588
286
366
18.3
17.7
7.7
9.4
19.1
15.8
4.0
3.5
20.2
21.1
2.0
1.5
Radico Khaitan
Buy
109
156
1,451
1,565
1,687
12.2
13.0
5.7
7.1
19.1
15.4
1.6
1.5
8.3
9.6
1.4
1.3
Garware Wall Ropes
Buy
348
473
762
862
974
11.2
11.2
24.9
29.6
14.0
11.8
2.1
1.8
15.1
15.4
0.9
0.7
Wonderla Holidays
Neutral
381
-
2,155
206
308
44.0
43.6
9.0
12.9
42.4
29.6
5.8
5.3
13.7
17.8
10.4
6.9
Linc Pen & Plastics
Neutral
192
-
284
340
371
8.3
8.9
10.8
13.2
17.8
14.5
2.8
2.5
16.0
17.1
0.9
0.8
The Byke Hospitality
Neutral
161
-
647
222
287
20.5
20.5
5.6
7.6
28.6
21.4
5.4
4.4
18.9
20.8
3.0
2.3
Interglobe Aviation
Neutral
805
-
29,021
17,022
21,122
20.7
14.5
63.9
53.7
12.6
15.0
18.9
15.5
149.9
103.2
1.7
1.4
Coffee Day Enterprises
Neutral
245
-
5,046
2,692
2,964
17.0
18.6
-
4.7
-
51.7
3.0
2.8
0.2
5.5
2.3
2.1
Ltd
Navneet Education
Neutral
86
-
2,042
998
1,062
24.1
24.0
5.8
6.1
14.9
14.1
3.3
2.9
22.0
20.6
2.1
2.0
Navkar Corporation
Buy
188
265
2,679
365
436
38.3
37.5
5.6
5.9
33.3
32.0
2.1
2.0
6.3
6.1
8.2
7.0
Source: Company, Angel Research; Note: *December year end; #September year end; &October year end; Price as on February 04, 2016
Market Outlook
February 5, 2016
Research Team Tel: 022 - 39357800
DISCLAIMER
Angel Broking Private Limited (hereinafter referred to as “Angel”) is a registered Member of National Stock Exchange of India Limited,
Bombay Stock Exchange Limited and Metropolitan Stock Exchange of India Limited. It is also registered as a Depository Participant with
CDSL and Portfolio Manager with SEBI. It also has registration with AMFI as a Mutual Fund Distributor. Angel Broking Private Limited is
a registered entity with SEBI for Research Analyst in terms of SEBI (Research Analyst) Regulations, 2014 vide registration number
INH000000164. Angel or its associates has not been debarred/ suspended by SEBI or any other regulatory authority for accessing
/dealing in securities Market. Angel or its associates including its relatives/analyst do not hold any financial interest/beneficial
ownership of more than 1% in the company covered by Analyst. Angel or its associates/analyst has not received any compensation /
managed or co-managed public offering of securities of the company covered by Analyst during the past twelve months. Angel/analyst
has not served as an officer, director or employee of company covered by Analyst and has not been engaged in market making activity
of the company covered by Analyst.
This document is solely for the personal information of the recipient, and must not be singularly used as the basis of any investment
decision. Nothing in this document should be construed as investment or financial advice. Each recipient of this document should
make such investigations as they deem necessary to arrive at an independent evaluation of an investment in the securities of the
companies referred to in this document (including the merits and risks involved), and should consult their own advisors to determine
the merits and risks of such an investment.
Reports based on technical and derivative analysis center on studying charts of a stock's price movement, outstanding positions and
trading volume, as opposed to focusing on a company's fundamentals and, as such, may not match with a report on a company's
fundamentals.
The information in this document has been printed on the basis of publicly available information, internal data and other reliable
sources believed to be true, but we do not represent that it is accurate or complete and it should not be relied on as such, as this
document is for general guidance only. Angel Broking Pvt. Limited or any of its affiliates/ group companies shall not be in any way
responsible for any loss or damage that may arise to any person from any inadvertent error in the information contained in this report.
Angel Broking Pvt. Limited has not independently verified all the information contained within this document. Accordingly, we cannot
testify, nor make any representation or warranty, express or implied, to the accuracy, contents or data contained within this document.
While Angel Broking Pvt. Limited endeavors to update on a reasonable basis the information discussed in this material, there may be
regulatory, compliance, or other reasons that prevent us from doing so.
This document is being supplied to you solely for your information, and its contents, information or data may not be reproduced,
redistributed or passed on, directly or indirectly.
Neither Angel Broking Pvt. Limited, nor its directors, employees or affiliates shall be liable for any loss or damage that may arise from
or in connection with the use of this information.
Note: Please refer to the important ‘Stock Holding Disclosure' report on the Angel website (Research Section). Also, please refer to the
latest update on respective stocks for the disclosure status in respect of those stocks. Angel Broking Pvt. Limited and its affiliates may
have investment positions in the stocks recommended in this report.