Market Outlook
July 04, 2016
Market Cues
Domestic Indices
Chg (%)
(Pts)
(Close)
Indian markets are expected to open with positive bias tracing SGX Nifty.
BSE Sensex
0.5
145
27,145
Nifty
0.5
41
8,328
U.S. stocks gained for 4th straight daily gain on Friday, with Dow and S&P reporting
their best week this year as stocks clawed back some of the losses scored in the
Mid Cap
1.2
140
11,858
wake of tumult that followed U.K.’s decision last week to sever ties with EU. Markets
Small Cap
0.7
84
11,885
gained as ECB says it is weighing changes to its bond-buying program, BoE
Bankex
0.4
87
20,619
Governor saying his organization would loosen policy within months to deal with
fallout of Brexit vote.
Global Indices
Chg (%)
(Pts)
(Close)
European shares gained on Friday, lifted by expectations that ECB would take action
Dow Jones
0.1
19
17,949
to support markets in order to ease worries about fallout from UK's vote to leave EU.
Nasdaq
0.4
20
4,863
Indian shares closed higher for 5th consecutive session on account of good monsoon
FTSE
1.1
73
6,578
progress, cabinet’s approval for 7th pay commission recommendations, government
Nikkei
0.7
107
15,682
reforms to boost private sector and positive global mood.
Hang Seng
1.8
358
20,794
News Analysis
Shanghai Com
0.1
3
2,932
Coal India (CIL) hits 99% of June output target
India's biggest Oil refinery to cost `2lakh cr
Advances / Declines
BSE
NSE
Detailed analysis on Pg2
Advances
1,578
890
Declines
1,149
703
Investor’s Ready Reckoner
Unchanged
142
64
Key Domestic & Global Indicators
Stock Watch: Latest investment recommendations on 150+ stocks
Volumes (` Cr)
Refer Pg6 onwards
BSE
3,337
Top Picks
NSE
19,138
CMP
Target
Upside
Company
Sector
Rating
(`)
(`)
(%)
Amara Raja
Auto/Auto Ancillary
Buy
862
1,076
24.8
Net Inflows (` Cr)
Net
Mtd
Ytd
HCL Tech
IT
Buy
731
1,000
36.7
FII
1,482
5,175
19,544
LIC Housing
Financials
Buy
499
592
18.7
MFs
130
265
9,696
Bharat Electronics
Capital Goods
Accumulate
1,272
1,414
11.2
Navkar Corporation Others
Buy
213
265
24.3
Top Gainers
Price (`)
Chg (%)
More Top Picks on Pg3
Il&Fstrans
81
9.9
Key Upcoming Events
Mcleodruss
212
Previous
Consensus
9.3
Date
Region
Event Description
Reading
Expectations
Ioc
473
7.4
July 05 Germany
PMI Services
53.2
53.2
M&Mfin
355
July 07 US
Intial Jobless claims
268.0
267.0
6.3
July 08 UK
Industrial Production(YoY)
1.6
0.5
Sparc
351
5.4
July 10 India
Imports YoY %
-13.2
--
6.(
More Events on Pg4
Top Losers
Price (`)
Chg (%)
Kpit
158
(14.4)
Jpassociat
9
(3.2)
Sadbhav
283
(3.1)
Gspl
138
(3.0)
Unitech
6
(2.8)
As on July 01, 2016
Market Outlook
July 04, 2016
Coal India (CIL) hits 99% of June output target
Coal India has produced 42.72mntn for the month of Jun-16 in comparison to the
monthly target of 43.31mntn. This reflects 99% achievement of the monthly target.
In 1QFY2017, CIL recorded provisional coal production of 125.65mntn as against
target of 132.43mntn (reflecting 95% achievement of the target). Off-take in June-
16 is at 44.96mntn, lower than the targeted 47.52mntn for the month. Whereas,
for 1QFY2017 off-take was at 133.19mntn (v/s 149.88mntn expected).
Govt. of India has set FY2017 production target of 598mntn for CIL. In FY2016,
CIL production grew 8.5% to 536mntn, missing the then target of 550mntn.
Despite the production target miss for 1QFY2017, CIL reported 3.6% yoy increase
in production numbers. On the back of initiatives announced by the Centre, we
expect CIL to further ramp-up its operations, going forward. We maintain BUY
rating on CIL with price target of `380.
India's biggest Oil refinery to cost `2lakh cr
Upcoming oil refinery on the West coast, to be set-up by IOC, BPCL, HPCL and EIL
is expected to cost `2lakh cr ($30bn). This 60mntn/year refinery and mega
petrochemical complex is expected to be set up in 2 phases. Phase-1 will be
40mntn together with aromatic complex, naphtha cracker and polymer complex
and will cost `1.2-1.5lakh cr and will come up in 5-6 years from the date of land
acquisition. Entire refinery will include 3 crude units of 20 mntn each- first of these
will be part of Phase-1. This mega complex will require 12,000-15,000 acres of
land and 2-3 sites on coast of Maharashtra are being explored. The second phase
is expected to cost `50,000-60,000cr.
IOC has been looking at west coast for a refinery as catering to customers in the
West and South has been difficult, given that its refineries are mostly based in the
North. HPCL and BPCL are also looking at bigger refinery because of constraints
they face at their Mumbai units. This Refinery will produce petrol, diesel, LPG, ATF
and feedstock for petrochemical plants in plastic, chemical and textile industries in
Maharashtra. Being on the west coast will provide the unit a natural advantage of
easily sourcing crude oil from Middle-East, Africa and South America. East coast is
not being considered as shipping crude oil to east coast will add at least USD 1/
barrel to cost. Also, moving products to consumption heartland from west will not
be difficult.
IOC has 6 refineries with total capacity of 54.20mntn. It also has subsidiary
refinery with 11.50mntn capacity. Paradip has taken its refining capacity to 80.7
mntn. We maintain ACCUMULATE rating on IOCL with price target of `455.
Economic and Political News
Pulses Imports may rise to 5mntn in Apr-Dec: Industry
Govt cuts prices of key fertilizers by up to `4,000/tn
Soybean output declines to lowest in 11 years
Corporate News
SBI secures $625mn from World Bank for solar Programme
MOIL set to infuse `1,600cr in 5 years
Bosch board approves share buyback for over `2,000cr
Equitas gets final license from RBI, to launch bank soon
Market Outlook
July 04, 2016
Top Picks ★★★★★
Large Cap
Market Cap
CMP
Target
Upside
Company
Rationale
(` Cr)
(`)
(`)
(%)
To outpace battery industry growth due to better technological
Amara Raja Batteries
14,723
862
1,076
24.8
products leading to market share gains in both the automotive
OEM and replacement segments.
Uptick in defense capex by government, coupled with BELs
Bharat Electronics
30,522
1,272
1,414
11.2
strong market positioning, indicate good times ahead for BEL.
HCL Tech
1,03,183
731
1,000
36.7
Stock is trading at attractive valuations & factors all bad news.
Strong visibility for a robust 20% earnings trajectory, coupled
HDFC Bank
2,97,201
1,174
1,262
7.5
with high quality of earnings on account of high quality retail
business and strategic focus on highly rated corporates.
Back on the growth trend, expect a long term growth of 14% to
Infosys
2,69,225
1,172
1,374
17.2
be a US$20bn in FY2020.
Continues to grow its retail loan book at healthy pace with
LIC Housing Finance
25,162
499
592
18.7
improvement in asset quality. Expect LICHF to post a healthy
loan book which is likely to reflect in a strong earnings growth.
Huge bid pipeline of re-development works at Delhi and other
NBCC
11,565
193
220
14.1
State Governments and opportunity from Smart City, positions
NBCC to report strong growth, going forward.
Strong market positioning within the domestic AC markets to
Voltas
10,514
318
407
28.1
continue, EMP business set to revive
Source: Company, Angel Research
Mid Cap
Market Cap
CMP
Target
Upside
Company
Rationale
(` Cr)
(`)
(`)
(%)
Among the top 4 players in the consumer durables segment.
Bajaj Electricals
2,476
245
268
9.4
Improved profitability backed by turn around in E&P segment.
Strong order book lends earnings visibility.
Favourable outlook for AC industry to augur well for Cooling
Blue Star
3,927
437
495
13.4
products business. EMPPAC division's profitability to improve
once operating environment turns around.
With a focus on the low and medium income (LMI) consumer
Dewan Housing
6,068
208
270
29.8
segment, the company has increased its presence in tier-II & III
cities where the growth opportunity is immense.
Strong loan growth backed by diversified loan portfolio and
Equitas Holdings
6,163
184
235
27.9
adequate CAR. ROE & ROA likely to remain decent as risk of
dilution remains low. Attractive valuations considering growth.
Commencement of new projects, downtrend in the interest rate
IL&FS Transport
2,651
81
93
15.4
cycle, to lead to stock re-rating
Economic recovery to have favourable impact on advertising &
circulation revenue growth. Further, the acquisition of a radio
Jagran Prakashan
5,860
179
205
14.4
business (Radio City) would also boost the company's revenue
growth.
Speedier execution and speedier sales, strong revenue visibility
Mahindra Lifespace
1,915
467
554
18.7
in short-to-long run, attractive valuations
Massive capacity expansion along with rail advantage at ICD
Navkar Corporation
3,041
213
265
24.3
as well CFS augurs well for the company
Earnings boost on back of stable material prices and
Radico Khaitan
1,234
93
125
34.8
favourable pricing environment. Valuation discount to peers
provides additional comfort
Strong brands and distribution network would boost growth
Siyaram Silk Mills
1,052
1,122
1,347
20.1
going ahead. Stock currently trades at an inexpensive
valuation.
Source: Company, Angel Research
Market Outlook
July 4, 2016
Key Upcoming Events
Global economic events release calendar
Bloomberg Data
Date
Time
Country
Event Description
Unit
Period
Last Reported
Estimated
Jul 05, 2016
1:25 PM Germany PMI Services
Value
Jun F
53.20
53.20
Jul 07, 2016
6:00 PM
US
Initial Jobless claims
Thousands
Jul 2
268.00
267.00
6:00 PM
US
Change in Nonfarm payrolls
Thousands
Jun
38.00
175.00
Jul 08, 2016
2:00 PM
UK Industrial Production (YoY)
% Change
May
1.60
0.50
6:00 PM
US
Unnemployment rate
%
Jun
4.70
4.80
Jul 10, 2016
India
Imports YoY%
% Change
Jun
-13.20
July 12, 2016
7:00 AM
China Consumer Price Index (YoY)
% Change
Jun
2.00
9:36 PM
July 13, 2016
5:30 PM
India
Industrial Production YoY
% Change
May
-0.80
India
Exports YoY%
% Change
Jun
-0.80
China Exports YoY%
% Change
Jun
-4.10
(4.00)
Jul 14, 2016
4:30 PM
UK BOE Announces rates
% Ratio
Jul 14
0.50
US
Producer Price Index (mom)
% Change
Jun
0.50
12:00 PM
India
Monthly Wholesale Prices YoY%
% Change
Jun
0.79
Jul 15, 2016
2:30 PM Euro Zone Euro-Zone CPI (YoY)
%
Jun F
0.10
6:00 PM
US
Consumer price index (mom)
% Change
Jun
0.20
0.30
6:45 PM
US
Industrial Production
%
Jun
(0.42)
0.10
7:30 AM
China Industrial Production (YoY)
% Change
Jun
6.00
6:00 PM
US
Housing Starts
Thousands
Jun
1,164.00
Jul 19, 2016
7:30 AM
China Real GDP (YoY)
% Change
2Q
6.70
Source: Bloomberg, Angel Research
Market Outlook
July 04, 2016
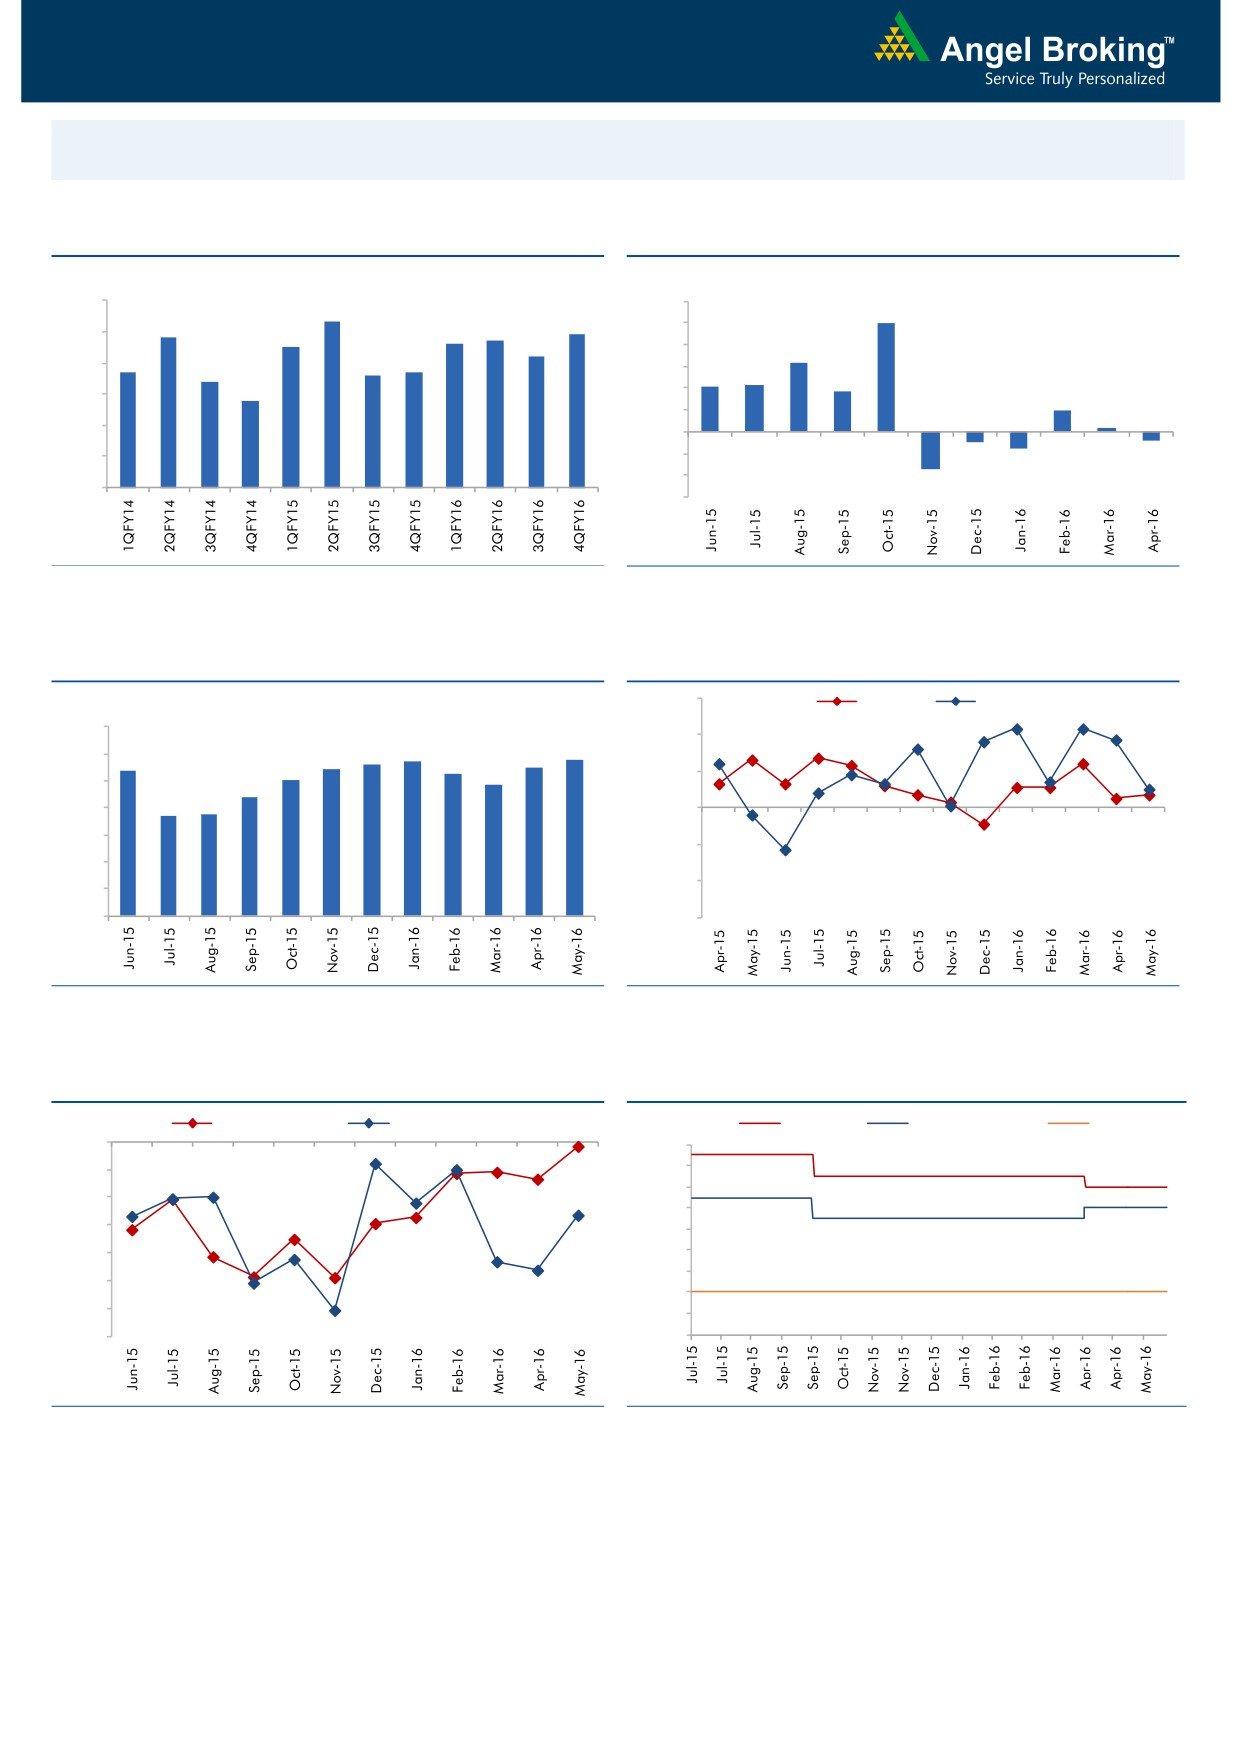
Macro watch
Exhibit 1: Quarterly GDP trends
Exhibit 2: IIP trends
(%)
(%)
9.0
12.0
8.3
9.9
7.8
7.7
7.9
10.0
8.0
7.5
7.6
7.2
8.0
6.3
6.7
6.6
6.7
7.0
6.4
6.0
4.2
4.3
3.7
5.8
4.0
6.0
2.0
2.0
0.3
5.0
-
4.0
(2.0)
(0.9)
(0.8)
(1.6)
(4.0)
3.0
(3.4)
(6.0)
Source: CSO, Angel Research
Source: MOSPI, Angel Research
Exhibit 3: Monthly CPI inflation trends
Exhibit 4: Manufacturing and services PMI
56.0
Mfg. PMI
Services PMI
(%)
7.0
54.0
5.6
5.7
5.8
5.4
5.4
5.5
6.0
5.3
5.0
4.8
52.0
5.0
4.4
3.7
3.7
4.0
50.0
3.0
48.0
2.0
46.0
1.0
-
44.0
Source: MOSPI, Angel Research
Source: Market, Angel Research; Note: Level above 50 indicates expansion
Exhibit 5: Exports and imports growth trends
Exhibit 6: Key policy rates
(%)
Exports yoy growth
Imports yoy growth
(%)
Repo rate
Reverse Repo rate
CRR
0.0
7.50
(5.0)
7.00
6.50
(10.0)
6.00
(15.0)
5.50
(20.0)
5.00
4.50
(25.0)
4.00
(30.0)
3.50
(35.0)
3.00
Source: Bloomberg, Angel Research
Source: RBI, Angel Research
Market Outlook
July 04, 2016
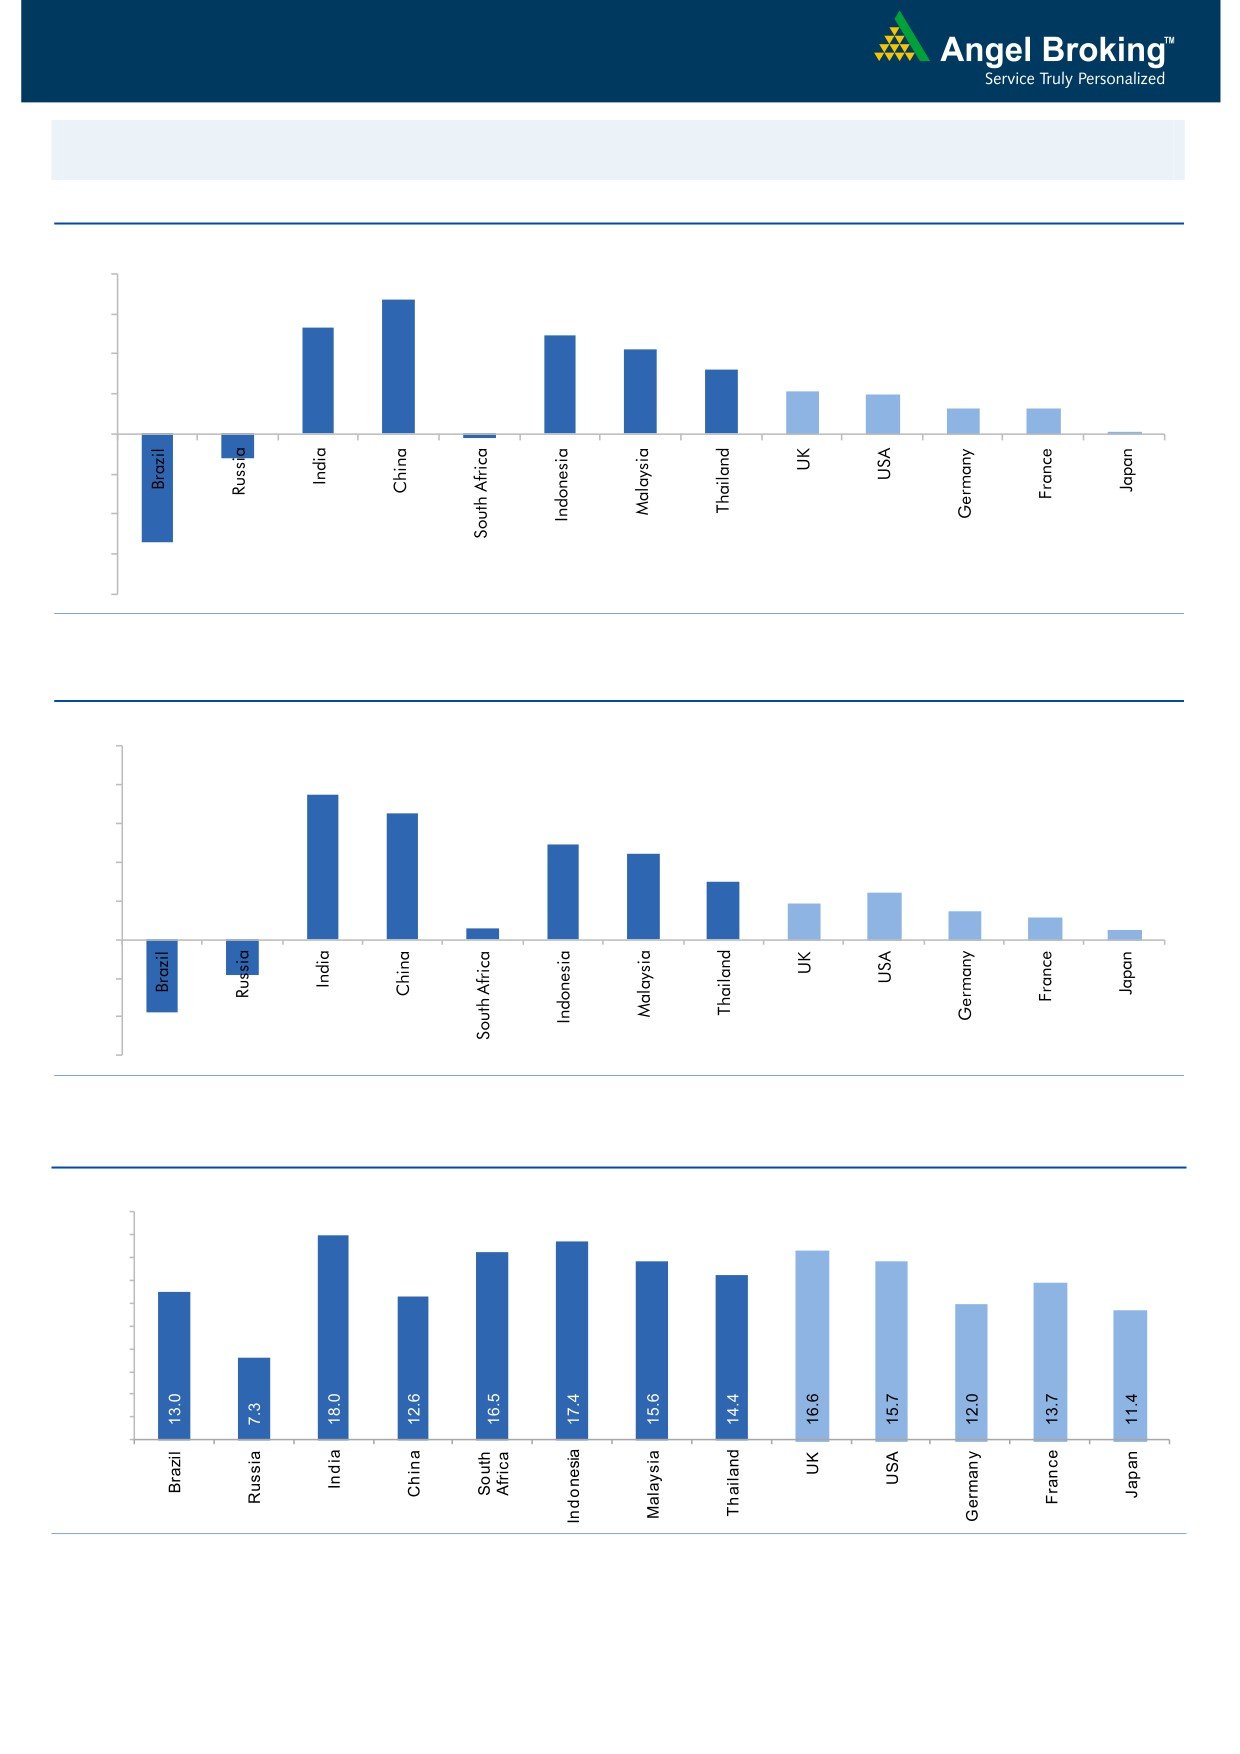
Global watch
Exhibit 1: Latest quarterly GDP Growth (%, yoy) across select developing and developed countries
(%)
8.0
6.7
6.0
5.3
4.9
4.2
4.0
3.2
2.1
2.0
2.0
1.3
1.3
0.1
-
(2.0)
(4.0)
(1.2)
(6.0)
(0.2)
(5.4)
(8.0)
Source: Bloomberg, Angel Research
Exhibit 2: 2016 GDP Growth projection by IMF (%, yoy) across select developing and developed countries
(%)
10.0
7.5
8.0
6.5
6.0
4.9
4.4
4.0
3.0
2.4
1.9
1.5
2.0
1.1
0.6
0.5
(3.8)
(1.8)
-
(2.0)
(4.0)
(6.0)
Source: IMF, Angel Research
Exhibit 3: One year forward P-E ratio across select developing and developed countries
(x)
20.0
18.0
16.0
14.0
12.0
10.0
8.0
6.0
4.0
2.0
-
Source: IMF, Angel Research
Market Outlook
July 04, 2016
Exhibit 4: Relative performance of indices across globe
Returns (%)
Country
Name of index
Closing price
1M
3M
1YR
Brazil
Bovespa
52,233
6.6
4.4
(1.8)
Russia
Micex
1,897
(0.1)
2.8
15.7
India
Nifty
8,328
1.8
7.7
(0.6)
China
Shanghai Composite
2,932
3.9
0.4
(35.9)
South Africa
Top 40
46,016
(4.1)
(0.9)
(0.6)
Mexico
Mexbol
46,213
1.4
1.2
2.5
Indonesia
LQ45
851
2.5
1.2
0.5
Malaysia
KLCI
1,646
1.2
(4.2)
(4.1)
Thailand
SET 50
911
(0.1)
0.9
(8.0)
USA
Dow Jones
17,949
0.9
0.9
1.5
UK
FTSE
6,578
6.2
6.5
0.6
Japan
Nikkei
15,682
(7.5)
(8.3)
(24.6)
Germany
DAX
9,776
(4.2)
(0.2)
(8.4)
France
CAC
4,274
(4.5)
(1.6)
(12.8)
Source: Bloomberg, Angel Research
Stock Watch
July 04, 2016
Company Name
Reco
CMP
Target
Mkt Cap
Sales ( Čcr )
OPM(%)
EPS (Č)
PER(x)
P/BV(x)
RoE(%)
EV/Sales(x)
(Č)
Price ( Č)
( Č cr )
FY16E FY17E
FY16E
FY17E
FY16E
FY17E
FY16E
FY17E
FY16E
FY17E
FY16E
FY17E
FY16E
FY17E
Agri / Agri Chemical
Rallis
Neutral
221
-
4,294
1,612
1,911
13.3
13.3
7.4
9.5
29.8
23.2
4.8
4.3
16.7
18.4
2.6
2.2
United Phosphorus
Accumulate
561
684
24,025
13,083
15,176
18.5
18.5
31.5
37.4
17.8
15.0
3.5
2.9
21.4
21.4
2.2
1.8
Auto & Auto Ancillary
Ashok Leyland
Neutral
99
-
28,302
17,995
21,544
11.4
11.6
3.4
4.7
29.3
21.2
5.1
4.7
17.7
22.2
1.6
1.3
Bajaj Auto
Neutral
2,669
-
77,229
22,709
25,860
20.9
20.1
129.0
143.6
20.7
18.6
6.3
5.5
30.7
29.4
2.9
2.5
Bharat Forge
Buy
774
875
18,008
7,351
8,318
19.9
19.7
31.2
36.5
24.8
21.2
4.4
3.8
19.3
19.2
2.5
2.2
Eicher Motors
Accumulate
19,155
20,044
52,028
15,556
16,747
15.5
17.3
464.8
597.5
41.2
32.1
15.1
11.1
36.2
34.3
3.2
2.9
Gabriel India
Accumulate
93
101
1,334
1,415
1,544
8.7
9.0
4.6
5.4
20.2
17.2
3.7
3.3
18.1
18.9
0.9
0.8
Hero Motocorp
Neutral
3,177
-
63,434
28,244
30,532
15.5
15.9
156.7
168.5
20.3
18.9
8.1
6.9
39.9
36.4
2.1
1.9
Jamna Auto Industries Neutral
174
-
1,388
1,281
1,473
11.2
11.5
7.6
9.2
22.9
18.9
5.8
4.7
25.4
25.2
1.1
0.9
L G Balakrishnan & Bros Neutral
470
-
737
1,254
1,394
11.6
11.8
35.9
41.7
13.1
11.3
1.8
1.6
13.5
13.8
0.7
0.6
Mahindra and Mahindra Neutral
1,461
-
90,723
38,416
42,904
13.7
13.9
54.8
63.4
26.7
23.0
4.1
3.7
15.4
15.8
1.8
1.6
Maruti
Neutral
4,166
-
125,841
57,865
68,104
16.4
16.7
176.3
225.5
23.6
18.5
4.6
3.9
19.4
21.2
2.0
1.6
Minda Industries
Neutral
1,159
-
1,839
2,523
2,890
8.7
9.0
55.0
65.4
21.1
17.7
4.1
3.3
19.3
18.7
0.8
0.7
Motherson Sumi
Accumulate
287
313
38,016
39,343
45,100
8.8
9.1
10.1
12.5
28.5
23.0
9.0
7.1
35.3
34.4
1.0
0.9
Rane Brake Lining
Buy
397
465
314
454
511
11.5
12.0
25.2
31.0
15.8
12.8
2.4
2.1
14.9
16.6
0.8
0.7
Setco Automotive
Neutral
51
-
675
594
741
12.7
13.7
1.7
3.2
29.7
15.8
3.1
2.7
10.4
16.9
1.3
1.1
Tata Motors
Neutral
458
-
132,205
259,686
273,957
13.0
13.4
25.9
29.5
17.7
15.5
2.3
2.0
8.0
9.0
0.7
0.7
TVS Motor
Accumulate
311
330
14,754
11,263
13,122
6.9
8.5
9.2
15.0
33.8
20.7
7.7
6.1
22.7
29.6
1.2
1.0
Amara Raja Batteries
Buy
862
1,076
14,723
4,690
5,429
17.5
17.5
28.5
35.3
30.3
24.4
7.0
5.8
23.1
25.9
3.0
2.6
Exide Industries
Neutral
176
-
14,939
6,950
7,784
14.4
14.8
6.6
7.3
26.6
24.1
3.4
3.1
12.6
12.8
1.6
1.5
Apollo Tyres
Buy
154
183
7,854
12,056
12,714
17.2
16.4
23.0
20.3
6.7
7.6
1.2
1.0
17.7
13.6
0.7
0.7
Ceat
Buy
862
1,119
3,485
6,041
6,597
14.1
13.7
99.5
111.9
8.7
7.7
1.7
1.4
19.6
18.5
0.8
0.6
JK Tyres
Neutral
90
-
2,041
7,446
7,669
15.2
14.0
19.6
18.4
4.6
4.9
1.2
1.0
25.2
19.5
0.7
0.6
Swaraj Engines
Neutral
1,218
-
1,513
552
630
14.2
14.7
44.6
54.1
27.3
22.5
6.4
5.8
23.2
25.6
2.3
2.0
Subros
Neutral
94
-
564
1,293
1,527
11.8
11.9
4.2
6.7
22.4
14.0
1.7
1.5
7.7
11.5
0.7
0.6
Indag Rubber
Neutral
190
-
499
283
329
17.0
17.2
13.0
15.4
14.7
12.3
3.2
2.7
21.8
21.6
1.5
1.2
Capital Goods
ACE
Neutral
45
-
449
660
839
4.7
8.2
1.0
3.9
45.4
11.6
1.4
1.3
3.2
11.3
0.8
0.6
BEML
Buy
875
1,157
3,644
3,277
4,006
6.0
8.9
36.2
64.3
24.2
13.6
1.7
1.5
5.7
11.7
1.1
0.9
Bharat Electronics
Buy
1,272
1,414
30,522
7,295
8,137
20.0
16.8
56.5
58.7
22.5
21.7
3.4
3.0
42.1
44.6
3.0
2.5
Stock Watch
July 04, 2016
Company Name
Reco
CMP
Target
Mkt Cap
Sales ( Čcr )
OPM(%)
EPS (Č)
PER(x)
P/BV(x)
RoE(%)
EV/Sales(x)
(Č)
Price ( Č)
( Č cr )
FY16E
FY17E
FY16E
FY17E
FY16E
FY17E
FY16E
FY17E
FY16E
FY17E
FY16E
FY17E
FY16E
FY17E
Capital Goods
Voltas
Buy
318
407
10,514
5,857
6,511
7.5
7.9
11.7
12.9
27.2
24.6
4.4
3.9
17.1
16.7
1.9
1.7
BGR Energy
Neutral
118
-
850
3,615
3,181
9.5
9.4
16.7
12.4
7.1
9.5
0.7
0.7
10.0
7.0
0.6
0.8
BHEL
Neutral
132
-
32,284
33,722
35,272
10.8
11.7
10.5
14.2
12.6
9.3
0.9
0.9
7.0
9.0
0.9
0.9
Blue Star
Buy
437
495
3,927
3,770
4,351
5.7
6.4
11.4
17.2
38.2
25.4
5.9
5.5
18.4
23.1
1.0
0.9
Crompton Greaves
Neutral
74
-
4,625
13,484
14,687
4.9
6.2
4.5
7.1
16.4
10.4
1.2
1.1
7.2
10.8
0.5
0.4
Greaves Cotton
Neutral
138
-
3,371
1,655
1,755
16.6
16.8
7.4
7.8
18.7
17.7
3.7
3.5
21.1
20.6
2.0
1.9
Inox Wind
Buy
238
286
5,274
4,406
5,605
15.5
15.7
20.4
24.8
11.7
9.6
2.7
2.0
27.9
25.9
1.3
1.0
KEC International
Neutral
144
-
3,706
8,791
9,716
6.1
6.8
5.4
8.2
26.7
17.6
2.7
2.4
10.0
14.0
0.6
0.6
Thermax
Neutral
853
-
10,161
6,413
7,525
7.4
8.5
30.5
39.3
28.0
21.7
4.3
3.7
15.0
17.0
1.4
1.1
VATech Wabag
Neutral
598
-
3,260
2,722
3,336
7.9
8.1
19.5
24.6
30.7
24.3
3.2
2.9
11.1
12.4
1.3
1.1
Cement
ACC
Neutral
1,615
-
30,330
13,151
14,757
16.4
18.3
63.9
83.4
25.3
19.4
3.3
3.0
13.3
16.1
2.0
1.7
Ambuja Cements
Neutral
253
-
39,247
11,564
12,556
19.4
20.7
8.9
10.1
28.4
25.0
3.6
3.4
12.8
13.8
2.7
2.5
HeidelbergCement
Neutral
116
-
2,623
1,772
1,926
13.3
15.4
1.0
3.0
115.8
38.6
2.9
2.7
2.6
7.9
1.9
1.7
India Cements
Neutral
113
-
3,465
4,216
4,840
18.0
19.5
4.0
9.9
28.2
11.4
1.1
1.0
4.0
9.5
1.0
0.8
JK Cement
Neutral
669
-
4,677
3,661
4,742
10.1
15.8
7.5
28.5
89.2
23.5
2.7
2.4
7.5
22.9
1.6
1.2
J K Lakshmi Cement
Neutral
401
-
4,719
2,947
3,616
16.7
19.9
11.5
27.2
34.9
14.7
3.3
2.9
9.8
20.8
1.8
1.4
Mangalam Cements
Neutral
310
-
826
1,053
1,347
10.5
13.3
8.4
26.0
36.9
11.9
1.6
1.4
4.3
12.5
1.1
0.8
Orient Cement
Neutral
182
-
3,727
1,854
2,524
21.2
22.2
7.7
11.1
23.6
16.4
3.4
2.9
13.3
15.7
2.6
1.8
Ramco Cements
Neutral
569
-
13,555
4,036
4,545
20.8
21.3
15.1
18.8
37.7
30.3
4.6
4.1
12.9
14.3
3.5
3.0
Shree Cement^
Neutral
14,800
-
51,559
7,150
8,742
26.7
28.6
228.0
345.5
64.9
42.8
9.6
8.0
15.7
20.3
6.4
5.1
UltraTech Cement
Neutral
3,427
-
94,039
24,669
29,265
18.2
20.6
82.0
120.0
41.8
28.6
4.5
3.9
11.3
14.7
3.6
3.1
Construction
ITNL
Buy
81
93
2,651
7,360
8,682
34.0
32.2
7.0
8.6
11.5
9.4
0.4
0.4
3.2
2.5
3.7
3.5
KNR Constructions
Neutral
553
-
1,555
937
1,470
14.3
14.0
44.2
38.6
12.5
14.3
2.5
2.2
15.4
15.4
1.8
1.2
Larsen & Toubro
Buy
1,541
1,700
143,590
58,870
65,708
8.3
10.3
42.0
53.0
36.7
29.1
2.5
2.3
8.8
11.2
2.5
2.3
Gujarat Pipavav Port
Neutral
162
-
7,841
629
684
51.0
52.2
6.4
5.9
25.3
27.5
3.3
3.1
15.9
12.7
11.8
10.7
MBL Infrastructures
Buy
121
285
503
2,313
2,797
12.2
14.6
19.0
20.0
6.4
6.1
0.7
0.6
11.3
10.6
0.9
0.8
Nagarjuna Const.
Neutral
76
-
4,228
7,892
8,842
8.8
9.1
3.0
5.3
25.4
14.4
1.3
1.2
5.0
8.5
0.7
0.6
PNC Infratech
Neutral
567
-
2,908
1,873
2,288
13.2
13.5
24.0
32.0
23.6
17.7
2.3
2.0
12.1
12.3
1.6
1.3
Simplex Infra
Neutral
271
-
1,341
5,955
6,829
10.3
10.5
16.0
31.0
16.9
8.7
0.9
0.8
5.3
9.9
0.7
0.6
Stock Watch
July 04, 2016
Company Name
Reco
CMP
Target
Mkt Cap
Sales ( Čcr )
OPM(%)
EPS (Č)
PER(x)
P/BV(x)
RoE(%)
EV/Sales(x)
(Č)
Price ( Č)
( Č cr )
FY16E
FY17E
FY16E
FY17E
FY16E
FY17E
FY16E
FY17E
FY16E
FY17E
FY16E
FY17E
FY16E
FY17E
Construction
Power Mech Projects
Neutral
548
-
805
1,539
1,801
12.8
12.7
59.0
72.1
9.3
7.6
1.4
1.2
18.6
16.8
0.6
0.5
Sadbhav Engineering
Accumulate
284
298
4,863
3,186
3,598
10.2
10.3
8.0
9.0
35.4
31.5
3.3
2.9
9.4
9.9
1.8
1.6
NBCC
Accumulate
193
220
11,565
5,838
7,428
6.0
7.9
5.2
8.2
37.1
23.5
1.2
0.9
21.9
28.2
1.8
1.3
MEP Infra
Neutral
44
-
712
1,956
1,876
28.1
30.5
1.3
3.0
33.7
14.6
7.1
4.8
21.2
32.8
1.7
1.7
SIPL
Neutral
99
-
3,487
675
1,042
62.4
64.7
-
-
3.7
4.2
-
-
16.7
11.3
Engineers India
Neutral
209
-
7,057
1,667
1,725
13.5
16.0
9.7
11.4
21.6
18.4
2.5
2.5
11.7
13.4
2.7
2.7
Financials
Allahabad Bank
Neutral
69
-
5,021
8,569
9,392
2.8
2.9
16.3
27.5
4.3
2.5
0.4
0.3
7.6
11.9
-
-
Axis Bank
Neutral
543
-
129,553
26,204
29,738
3.6
3.5
34.5
35.4
15.7
15.3
2.5
2.2
16.8
14.9
-
-
Bank of Baroda
Neutral
157
-
36,072
18,802
21,088
2.0
2.2
(7.4)
13.0
12.0
1.3
1.0
(4.2)
7.3
-
-
Bank of India
Neutral
104
-
9,733
15,972
17,271
1.9
2.0
15.3
33.4
6.8
3.1
0.3
0.3
3.6
7.6
-
-
Canara Bank
Neutral
219
-
11,873
15,441
16,945
2.0
2.1
46.6
70.4
4.7
3.1
0.4
0.4
8.0
11.2
-
-
Dena Bank
Neutral
39
-
2,624
3,440
3,840
2.1
2.3
7.3
10.0
5.4
3.9
0.4
0.3
6.1
7.9
-
-
Dewan Housing Finance Buy
208
270
6,068
1,828
2,225
2.9
3.0
24.9
29.7
8.4
7.0
1.3
1.1
15.1
16.1
-
-
Equitas Holdings
Buy
184
235
6,163
679
1,076
12.4
11.7
6.2
6.7
29.7
27.4
3.7
2.7
13.3
12.5
-
-
Federal Bank
Neutral
59
-
10,146
3,279
3,787
2.8
2.9
3.9
5.5
15.0
10.7
1.2
1.1
8.4
10.8
-
-
HDFC
Neutral
1,245
-
196,775
10,358
11,852
3.3
3.3
41.1
47.0
30.3
26.5
5.8
5.2
24.7
24.9
-
-
HDFC Bank
Accumulate
1,174
1,262
297,201
38,606
47,696
4.4
4.5
48.8
61.4
24.1
19.1
4.1
3.6
18.7
20.0
-
-
ICICI Bank
Neutral
240
-
139,839
34,279
39,262
3.3
3.3
21.0
24.4
11.5
9.9
1.9
1.6
14.4
14.7
-
-
IDBI Bank
Neutral
71
-
14,607
9,625
10,455
1.8
1.8
8.5
14.2
8.3
5.0
0.5
0.5
5.9
9.3
-
-
Indian Bank
Neutral
142
-
6,799
6,160
6,858
2.5
2.5
24.5
29.8
5.8
4.7
0.5
0.4
7.7
8.6
-
-
LIC Housing Finance
Buy
499
592
25,163
3,179
3,758
2.6
2.6
32.9
40.6
15.2
12.3
2.8
2.4
19.6
20.7
-
-
Oriental Bank
Neutral
111
-
3,830
7,643
8,373
2.4
2.4
37.2
45.4
3.0
2.4
0.3
0.2
8.2
9.4
-
-
Punjab Natl.Bank
Neutral
105
-
20,667
23,122
26,022
2.8
2.8
7.0
21.6
15.1
4.9
0.8
0.7
3.4
10.0
-
-
South Ind.Bank
Neutral
20
-
2,707
1,965
2,185
2.5
2.5
2.5
3.3
8.1
6.1
0.8
0.7
9.5
11.7
-
-
St Bk of India
Neutral
220
-
170,509
79,958
86,061
2.6
2.6
13.4
20.7
16.4
10.6
1.3
1.3
11.5
12.8
-
-
Union Bank
Neutral
132
-
9,060
12,646
14,129
2.3
2.4
31.0
39.1
4.3
3.4
0.5
0.4
9.8
11.4
-
-
Vijaya Bank
Neutral
37
-
3,716
3,536
3,827
1.9
1.9
5.5
6.7
6.7
5.6
0.6
0.5
7.8
8.8
-
-
Yes Bank
Neutral
1,130
-
47,569
7,190
9,011
3.2
3.3
58.2
69.7
19.4
16.2
3.5
3.0
19.2
19.6
-
-
FMCG
Asian Paints
Neutral
1,002
-
96,145
15,534
17,445
17.7
16.8
18.4
19.6
54.6
51.1
19.3
18.2
34.6
35.6
6.2
5.5
Stock Watch
July 04, 2016
Company Name
Reco
CMP
Target
Mkt Cap
Sales ( Čcr )
OPM(%)
EPS (Č)
PER(x)
P/BV(x)
RoE(%)
EV/Sales(x)
(Č)
Price ( Č)
( Č cr )
FY16E FY17E
FY16E
FY17E
FY16E
FY17E
FY16E
FY17E
FY16E
FY17E
FY16E
FY17E
FY16E
FY17E
FMCG
Britannia
Neutral
2,804
-
33,637
8,481
9,795
14.0
14.1
65.5
78.3
42.8
35.8
20.3
16.6
38.3
41.2
3.8
3.3
Colgate
Neutral
920
-
25,028
4,136
4,632
22.5
23.3
22.2
25.3
41.5
36.4
25.2
22.4
68.6
67.5
5.6
5.0
Dabur India
Neutral
311
-
54,657
9,370
10,265
17.6
17.3
7.3
8.1
42.4
38.4
11.0
10.1
31.7
30.6
5.6
5.1
GlaxoSmith Con*
Accumulate
6,057
6,118
25,471
4,519
5,142
19.6
19.8
164.3
191.2
36.9
31.7
10.2
8.7
30.8
29.9
4.7
4.1
Godrej Consumer
Neutral
1,622
-
55,224
9,003
10,335
18.1
18.7
34.1
41.8
47.6
38.8
10.3
8.8
23.9
24.8
6.1
5.3
HUL
Neutral
898
-
194,371
33,299
35,497
17.1
17.1
18.9
20.0
47.5
44.9
41.7
36.3
87.6
80.8
5.6
5.2
ITC
Accumulate
252
380
304,607
36,837
39,726
38.8
38.7
12.2
13.5
20.6
18.7
5.8
5.0
27.8
26.9
7.2
6.7
Marico
Neutral
267
-
34,506
6,151
6,966
17.2
17.3
5.4
6.4
49.5
41.8
15.6
12.3
33.2
32.4
5.2
4.6
Nestle*
Neutral
6,507
-
62,742
9,393
10,507
22.2
22.3
106.8
121.8
60.9
53.4
21.4
19.3
34.8
36.7
6.2
5.6
Tata Global
Accumulate
135
137
8,514
8,635
9,072
9.8
9.9
5.8
7.2
23.3
18.7
2.1
2.0
6.8
7.4
0.9
0.9
Procter & Gamble
Buy
6,245
7,369
20,273
2,588
2,939
23.3
23.2
130.2
146.2
48.0
42.7
95.6
91.7
27.6
25.3
7.4
6.4
Hygiene
IT
HCL Tech^
Buy
731
1,000
103,183
37,061
30,781
21.5
20.5
51.4
40.0
14.2
18.3
3.7
2.7
20.1
20.3
2.5
2.7
Infosys
Accumulate
1,172
1,374
269,225
62,441
70,558
27.5
27.5
59.0
65.3
19.9
18.0
4.0
3.6
22.2
22.4
4.1
3.5
TCS
Accumulate
2,502
3,004
492,962
108,646
122,770
28.3
28.3
123.7
141.0
20.2
17.7
6.7
6.1
33.1
34.6
4.3
3.7
Tech Mahindra
Buy
512
700
49,671
26,494
30,347
16.3
17.0
32.2
37.5
15.9
13.6
3.5
3.0
21.7
21.8
1.8
1.5
Wipro
Buy
558
680
137,977
50,808
56,189
23.7
23.8
37.3
40.7
15.0
13.7
2.9
2.6
19.2
17.7
2.1
1.7
Media
D B Corp
Neutral
379
-
6,965
2,025
2,187
27.4
27.4
17.4
18.9
21.8
20.1
4.9
4.5
22.9
23.7
3.4
3.1
HT Media
Neutral
78
-
1,814
2,495
2,673
12.9
13.2
6.8
7.2
11.5
10.8
0.9
0.8
7.5
7.8
0.3
0.3
Jagran Prakashan
Buy
179
205
5,860
2,107
2,355
33.5
28.0
10.1
10.8
17.8
16.6
4.2
3.6
23.3
21.7
2.7
2.4
Sun TV Network
Neutral
370
-
14,585
2,510
2,763
71.8
71.5
21.9
24.8
16.9
14.9
4.0
3.6
22.8
24.3
5.2
4.7
Hindustan Media
Neutral
272
-
1,996
914
1,016
21.7
21.5
21.9
23.3
12.4
11.7
2.2
1.9
18.0
16.2
1.6
1.4
Ventures
Metals & Mining
Coal India
Buy
310
380
195,870
76,167
84,130
19.9
22.3
22.4
25.8
13.8
12.0
5.0
4.9
35.5
41.0
1.9
1.7
Hind. Zinc
Neutral
177
-
74,957
14,641
14,026
50.4
50.4
17.7
16.0
10.1
11.1
1.5
1.4
16.2
13.2
2.5
2.3
Hindalco
Neutral
125
-
25,771
104,356
111,186
8.7
9.5
6.7
11.1
18.6
11.3
0.7
0.6
3.5
5.9
0.7
0.7
JSW Steel
Neutral
1,464
-
35,386
42,308
45,147
16.4
20.7
(10.3)
49.5
29.6
1.6
1.6
(1.0)
5.6
1.8
1.7
NMDC
Neutral
94
-
37,407
8,237
10,893
46.6
44.5
10.0
11.7
9.5
8.1
1.1
0.9
12.5
13.0
4.1
3.1
SAIL
Neutral
46
-
19,060
45,915
53,954
7.2
10.5
1.5
4.4
30.6
10.5
0.4
0.4
2.3
4.1
1.0
0.9
Vedanta
Neutral
135
-
40,083
71,445
81,910
26.2
26.3
12.9
19.2
10.5
7.1
0.7
0.7
7.2
8.9
0.9
0.7
Tata Steel
Neutral
327
-
31,793
126,760
137,307
8.9
11.3
6.4
23.1
51.5
14.2
1.0
1.0
2.0
7.1
0.8
0.8
Stock Watch
July 04, 2016
Company Name
Reco
CMP
Target
Mkt Cap
Sales ( Čcr )
OPM(%)
EPS (Č)
PER(x)
P/BV(x)
RoE(%)
EV/Sales(x)
(Č)
Price ( Č)
( Č cr )
FY16E FY17E
FY16E
FY17E
FY16E
FY17E
FY16E
FY17E
FY16E
FY17E
FY16E
FY17E
FY16E
FY17E
Oil & Gas
Cairn India
Neutral
145
-
27,101
11,323
12,490
49.4
51.0
20.7
20.7
7.0
7.0
0.5
0.4
6.4
6.1
1.4
0.8
GAIL
Neutral
395
-
50,137
64,856
70,933
9.1
9.6
24.0
28.9
16.5
13.7
1.4
1.3
8.8
9.6
0.9
0.8
ONGC
Neutral
224
-
191,942
154,564
145,998
36.8
37.4
20.8
22.6
10.8
9.9
1.0
1.0
10.1
9.7
1.4
1.5
Petronet LNG
Neutral
298
-
22,380
29,691
31,188
5.8
6.2
12.8
13.4
23.3
22.2
3.5
3.1
15.8
14.8
0.8
0.7
Indian Oil Corp
Accumulate
474
455
115,158
359,607
402,760
5.9
6.1
42.5
48.7
11.2
9.7
1.5
1.3
14.1
14.4
0.4
0.3
Reliance Industries
Buy
974
1,150
315,701
304,775
344,392
12.6
13.4
91.3
102.6
10.7
9.5
1.2
1.1
11.8
12.0
0.9
0.8
Pharmaceuticals
Alembic Pharma
Neutral
582
-
10,966
3,274
3,802
26.9
19.4
35.0
28.7
16.6
20.3
7.4
5.6
55.6
31.2
3.2
2.7
Aurobindo Pharma
Accumulate
745
856
43,595
14,923
17,162
22.0
23.0
35.7
42.8
20.9
17.4
6.1
4.6
34.0
30.2
3.5
3.0
Aventis*
Accumulate
4,654
4,738
10,719
2,049
2,375
15.4
17.3
115.4
153.5
40.3
30.3
6.6
5.1
19.3
25.8
4.6
3.9
Cadila Healthcare
Buy
328
400
33,604
9,469
11,246
21.2
22.0
14.9
17.1
22.0
19.2
6.3
4.9
28.8
26.6
3.4
2.9
Cipla
Buy
508
605
40,813
13,979
16,447
20.2
18.6
25.7
27.5
19.8
18.5
3.2
2.8
17.6
16.1
2.7
2.2
Dr Reddy's
Accumulate
3,477
3,476
59,301
15,471
17,479
24.6
24.6
138.2
152.4
25.2
22.8
4.6
4.0
19.7
18.7
3.4
3.0
Dishman Pharma
Neutral
142
-
2,293
1,733
1,906
21.5
21.5
10.1
10.0
14.1
14.2
1.7
1.5
10.5
11.2
1.9
1.7
GSK Pharma*
Neutral
3,469
-
29,382
2,870
3,158
20.0
22.1
59.5
68.3
58.3
50.8
17.2
17.7
28.5
34.3
9.9
9.1
Indoco Remedies
Neutral
275
-
2,534
1,033
1,199
15.9
18.2
9.4
13.6
29.3
20.2
4.3
3.7
15.7
19.7
2.6
2.3
Ipca labs
Buy
488
750
6,151
3,363
3,909
12.9
18.6
13.4
28.0
36.4
17.4
2.6
2.3
7.4
14.0
1.9
1.6
Lupin
Buy
1,548
1,809
69,803
13,702
15,912
23.7
26.4
50.5
58.1
30.7
26.7
6.3
5.2
22.9
21.4
5.2
4.2
Sun Pharma
Buy
764
950
183,871
28,163
32,610
25.8
30.7
17.4
26.9
43.9
28.4
4.2
3.6
13.0
16.6
5.8
4.8
Power
Tata Power
Neutral
74
-
20,109
35,923
37,402
22.6
22.8
4.1
5.2
18.3
14.4
1.4
1.3
7.5
9.3
1.5
1.4
NTPC
Neutral
156
-
128,794
87,271
99,297
23.5
23.5
11.8
13.3
13.3
11.8
1.5
1.4
11.5
12.2
2.4
2.2
Power Grid
Accumulate
165
170
86,374
20,702
23,361
86.7
86.4
12.1
13.2
13.7
12.5
2.0
1.8
15.6
15.1
8.7
8.1
Real Estate
MLIFE
Buy
467
554
1,915
826
1,011
20.1
21.9
22.7
30.7
20.6
15.2
1.2
1.1
6.0
7.4
4.1
3.1
Telecom
Bharti Airtel
Neutral
369
-
147,404
101,748
109,191
32.1
31.7
12.0
12.5
30.7
29.5
2.1
2.0
6.9
6.7
2.0
1.9
Idea Cellular
Neutral
106
-
38,187
34,282
36,941
32.0
31.5
5.9
6.2
18.0
17.1
1.7
1.5
9.9
9.3
1.7
1.6
zOthers
Abbott India
Neutral
4,711
-
10,011
2,715
3,153
14.5
14.1
134.3
152.2
35.1
31.0
8.8
7.2
27.4
25.6
3.3
2.8
Bajaj Electricals
Buy
245
268
2,476
4,612
5,351
5.6
5.7
23.4
18.0
10.5
13.7
3.2
2.9
12.5
14.4
0.5
0.4
Finolex Cables
Neutral
361
-
5,523
2,520
2,883
12.2
12.0
12.7
14.2
28.5
25.4
3.9
3.4
13.6
13.5
1.9
1.6
Goodyear India*
Accumulate
532
582
1,227
1,800
1,600
11.7
11.5
58.7
52.9
9.1
10.1
2.0
1.8
24.6
18.7
0.4
0.4
Hitachi
Neutral
1,377
-
3,744
1,779
2,081
7.8
8.8
21.8
33.4
63.2
41.2
10.2
8.3
17.4
22.1
2.0
1.7
Stock Watch
July 04, 2016
Company Name
Reco
CMP
Target
Mkt Cap
Sales ( Čcr )
OPM(%)
EPS (Č)
PER(x)
P/BV(x)
RoE(%)
EV/Sales(x)
(Č)
Price ( Č)
( Č cr )
FY16E
FY17E
FY16E
FY17E
FY16E
FY17E
FY16E
FY17E
FY16E
FY17E
FY16E
FY17E
FY16E
FY17E
zOthers
Jyothy Laboratories
Neutral
300
-
5,435
1,620
1,847
11.5
11.5
7.3
8.5
41.2
35.4
5.3
4.9
13.3
14.4
3.1
2.7
MRF
Buy
33,630
45,575
14,263
20,316
14,488
21.4
21.1
5,488.0
3,798.0
6.1
8.9
2.1
1.7
41.1
21.2
0.6
0.9
Page Industries
Neutral
14,060
-
15,682
1,929
2,450
19.8
20.1
229.9
299.0
61.2
47.0
27.0
18.8
52.1
47.1
8.2
6.4
Relaxo Footwears
Neutral
497
-
5,966
1,767
2,152
12.3
12.5
19.3
25.1
25.8
19.8
6.3
4.9
27.7
27.8
3.0
2.5
Siyaram Silk Mills
Buy
1,122
1,347
1,052
1,619
1,799
11.6
11.6
93.5
104.9
12.0
10.7
2.1
1.8
17.1
16.4
0.8
0.8
Styrolution ABS India* Neutral
641
-
1,127
1,271
1,440
8.6
9.2
32.0
41.1
20.0
15.6
2.0
1.8
10.7
12.4
0.8
0.7
TVS Srichakra
Buy
2,356
2,932
1,804
2,035
2,252
15.9
15.3
248.6
268.1
9.5
8.8
4.1
3.0
43.6
33.9
0.9
0.8
HSIL
Accumulate
273
310
1,977
2,123
2,384
16.1
16.5
15.0
18.9
18.2
14.5
1.4
1.3
8.0
9.4
1.3
1.1
Kirloskar Engines India
Neutral
268
-
3,876
2,403
2,554
8.6
9.9
9.2
10.5
29.2
25.6
2.8
2.7
9.7
10.7
1.2
1.1
Ltd
M M Forgings
Buy
450
546
543
511
615
21.7
21.6
43.1
55.8
10.4
8.1
1.9
1.6
19.9
21.2
1.3
1.0
Banco Products (India) Neutral
158
-
1,127
1,208
1,353
11.0
12.3
10.8
14.5
14.6
10.9
1.7
1.5
11.9
14.5
0.8
0.7
Competent Automobiles Neutral
145
-
89
1,040
1,137
3.2
3.1
25.7
28.0
5.6
5.2
0.8
0.7
15.0
14.3
0.1
0.1
Nilkamal
Neutral
1,228
-
1,832
1,871
2,031
10.7
10.5
63.2
69.8
19.4
17.6
3.2
2.7
17.6
16.6
1.0
0.9
Visaka Industries
Buy
158
162
251
1,020
1,120
8.7
9.1
13.9
20.1
11.4
7.9
0.7
0.7
6.4
8.7
0.4
0.4
Transport Corporation of
Neutral
316
-
2,419
2,830
3,350
8.8
9.0
14.4
18.3
22.0
17.3
3.4
3.0
15.4
17.1
0.9
0.8
India
Elecon Engineering
Neutral
65
-
705
1,359
1,482
10.3
13.7
0.8
3.9
80.6
16.6
1.3
1.3
1.6
7.8
0.8
0.7
Surya Roshni
Buy
167
201
733
2,992
3,223
8.1
8.4
14.7
18.3
11.4
9.1
1.1
1.0
9.7
11.0
0.5
0.5
MT Educare
Neutral
167
-
665
286
366
18.3
17.7
7.7
9.4
21.6
17.8
4.6
4.0
20.2
21.1
2.4
1.8
Radico Khaitan
Buy
93
125
1,234
1,543
1,659
12.6
13.0
5.8
6.3
16.1
14.6
1.4
1.3
8.5
8.6
1.3
1.2
Garware Wall Ropes
Buy
390
460
853
828
898
11.2
10.3
28.3
29.0
13.8
13.4
2.3
2.0
16.8
14.9
0.9
0.8
Wonderla Holidays
Neutral
402
-
2,274
206
308
44.0
43.6
9.0
12.9
44.7
31.2
6.1
5.5
13.7
17.8
10.4
6.9
Linc Pen & Plastics
Accumulate
245
235
362
344
382
9.1
9.1
12.4
13.1
19.8
18.7
3.6
3.1
18.0
16.7
1.0
0.9
The Byke Hospitality
Neutral
160
-
640
222
287
20.5
20.5
5.6
7.6
28.3
21.1
5.3
4.4
18.9
20.8
3.1
2.4
Interglobe Aviation
Neutral
1,012
-
36,482
17,022
21,122
20.7
14.5
63.9
53.7
15.8
18.9
23.7
19.5
149.9
103.2
2.1
1.7
Coffee Day Enterprises
Neutral
260
-
5,352
2,692
2,964
17.0
18.6
-
4.7
-
54.8
3.2
3.0
0.2
5.5
2.4
2.2
Ltd
Navneet Education
Neutral
98
-
2,323
998
1,062
24.1
24.0
5.8
6.1
17.0
16.0
3.7
3.3
22.0
20.6
2.1
2.0
Navkar Corporation
Buy
213
265
3,041
347
408
43.2
42.9
6.7
6.8
32.0
31.5
2.3
2.2
7.3
6.9
8.7
7.9
UFO Moviez
Neutral
570
-
1,574
558
619
32.0
33.2
22.5
30.0
25.3
19.0
3.0
2.6
12.0
13.8
2.5
2.1
VRL Logistics
Neutral
313
-
2,856
1,725
1,902
16.5
16.7
12.2
14.6
25.7
21.5
5.4
4.7
20.8
21.9
1.6
1.4
Stock Watch
July 04, 2016
Company Name
Reco
CMP
Target Mkt Cap
Sales ( Čcr )
OPM(%)
EPS (Č)
PER(x)
P/BV(x)
RoE(%)
EV/Sales(x)
(Č)
Price ( Č)
( Č cr )
FY16E FY17E FY16E FY17E FY16E FY17E FY16E FY17E FY16E FY17E FY16E FY17E FY16E FY17E
zOthers
Team Lease Serv.
Neutral
1,083
-
1,851
2,565
3,229
1.3
1.5
15.2
22.8
71.3
47.6
5.7
5.1
8.0
10.7
0.5
0.4
S H Kelkar & Co.
Neutral
213
-
3,080
928
1,036
15.3
15.1
4.9
6.1
43.1
34.9
4.0
3.7
9.4
10.7
3.2
2.8
Quick Heal
Neutral
268
-
1,878
339
408
27.8
27.3
7.1
7.7
37.9
34.6
3.2
3.2
8.5
9.3
3.8
3.2
Narayana Hrudaya
Neutral
313
-
6,401
1,603
1,873
10.9
11.5
1.0
2.6
328.8
118.4
7.9
7.3
2.4
6.1
4.1
3.5
Manpasand Bever.
Neutral
567
-
2,839
540
836
19.9
19.6
10.2
16.9
55.4
33.6
4.5
4.0
8.1
12.0
4.7
3.0
Source: Company, Angel Research; Note: *December year end; #September year end; &October year end; Price as on July 02, 2016
Market Outlook
July 04, 2016
Research Team Tel: 022 - 39357800
DISCLAIMER
Angel Broking Private Limited (hereinafter referred to as “Angel”) is a registered Member of National Stock Exchange of India Limited,
Bombay Stock Exchange Limited and Metropolitian Stock Exchange of India Limited. It is also registered as a Depository Participant with
CDSL and Portfolio Manager with SEBI. It also has registration with AMFI as a Mutual Fund Distributor. Angel Broking Private Limited is a
registered entity with SEBI for Research Analyst in terms of SEBI (Research Analyst) Regulations, 2014 vide registration number
INH000000164. Angel or its associates has not been debarred/ suspended by SEBI or any other regulatory authority for accessing
/dealing in securities Market. Angel or its associates including its relatives/analyst do not hold any financial interest/beneficial ownership
of more than 1% in the company covered by Analyst. Angel or its associates/analyst has not received any compensation / managed or co
-managed public offering of securities of the company covered by Analyst during the past twelve months. Angel/analyst has not served as
an officer, director or employee of company covered by Analyst and has not been engaged in market making activity of the company
covered by Analyst.
This document is solely for the personal information of the recipient, and must not be singularly used as the basis of any investment
decision. Nothing in this document should be construed as investment or financial advice. Each recipient of this document should make
such investigations as they deem necessary to arrive at an independent evaluation of an investment in the securities of the companies
referred to in this document (including the merits and risks involved), and should consult their own advisors to determine the merits and
risks of such an investment.
Reports based on technical and derivative analysis center on studying charts of a stock's price movement, outstanding positions and
trading volume, as opposed to focusing on a company's fundamentals and, as such, may not match with a report on a company's
fundamentals.
The information in this document has been printed on the basis of publicly available information, internal data and other reliable sources
believed to be true, but we do not represent that it is accurate or complete and it should not be relied on as such, as this document is for
general guidance only. Angel Broking Pvt. Limited or any of its affiliates/ group companies shall not be in any way responsible for any
loss or damage that may arise to any person from any inadvertent error in the information contained in this report. Angel Broking Pvt.
Limited has not independently verified all the information contained within this document. Accordingly, we cannot testify, nor make any
representation or warranty, express or implied, to the accuracy, contents or data contained within this document. While Angel Broking
Pvt. Limited endeavors to update on a reasonable basis the information discussed in this material, there may be regulatory, compliance,
or other reasons that prevent us from doing so.
This document is being supplied to you solely for your information, and its contents, information or data may not be reproduced,
redistributed or passed on, directly or indirectly.
Neither Angel Broking Pvt. Limited, nor its directors, employees or affiliates shall be liable for any loss or damage that may arise from or
in connection with the use of this information.
Note: Please refer to the important ‘Stock Holding Disclosure' report on the Angel website (Research Section). Also, please refer to the
latest update on respective stocks for the disclosure status in respect of those stocks. Angel Broking Pvt. Limited and its affiliates may have
investment positions in the stocks recommended in this report.