Market Outlook
May 4, 2016
Market Cues
Domestic Indices
Chg (%)
(Pts)
(Close)
BSE Sensex
(0.8)
(207)
25,230
Indian markets are expected to open on a negative note tracking the SGX Nifty and
Nifty
(0.8)
(59)
7,747
weak global cues.
Mid Cap
(0.9)
(95)
11,069
US markets ended in red amid global economic jitters. Disappointing manufacturing
Small Cap
(0.3)
(31)
11,033
data from China and a surprise rate cut in Australia led investors to take limited risk
by moving out of stocks. Falling crude oil prices led to decline in energy stocks, but
Bankex
(1.0)
(194)
18,665
Apple shares rose to snap a prolonged losing skid.
The European markets ended in the red. Weaker than expected manufacturing data
Global Indices
Chg (%)
(Pts)
(Close)
from China weighed heavily on mining and resource stocks. Financial stocks were
Dow Jones
(0.8)
(140)
17,751
also under pressure after disappointing earnings from banks like UBS and
Nasdaq
(1.1)
(54)
4,763
Commerzbank.
FTSE
(0.9)
(56)
6,186
Indian stocks reversed early gains to end sharply lower, tracking weak European
Nikkei
(3.1)
(519)
16,147
cues and lackluster movements in the rupee. The early rally faded soon as European
Hang Seng
(1.9)
(390)
20,677
markets fell sharply to hit a three-week low amid sluggish bank earnings, continued
Shanghai Com
1.8
54
2,993
strength of yen, a firmer euro and disappointing manufacturing data from China.
News & Result Analysis
Advances / Declines
BSE
NSE
Liberty House submits bid for Tata Steel UK assets
Advances
1,180
667
JSW Energy to buy JSPL’s Chhattisgarh power project
Detailed analysis on Pg2
Declines
1,475
892
Unchanged
148
74
Investor’s Ready Reckoner
Key Domestic & Global Indicators
Volumes (` Cr)
Stock Watch: Latest investment recommendations on 150+ stocks
BSE
2,737
Refer Pg6 onwards
NSE
18,410
Top Picks
CMP
Target
Upside
Net Inflows (` Cr)
Net
Mtd
Ytd
Company
Sector
Rating
(`)
(`)
(%)
FII
349
349
12,139
Amara Raja
Auto & Auto Ancillary Accumulate
956
1,076
12.5
MFs
15
15
2,611
HCL Tech
IT
Buy
729
1,038
42.3
LIC Housing
Financials
Buy
455
592
30.1
Top Gainers
Price (`)
Chg (%)
Bharat Electronics
Capital Goods
Buy
1,176
1,414
20.2
Navkar Corporation Others
Buy
182
265
45.8
Atul
1,831
6.3
More Top Picks on Pg4
Gdl
286
4.5
Auropharma
802
4.2
Key Upcoming Events
Previous
Consensus
Unitdspr
2,450
3.8
Date
Region
Event Description
Reading
Expectations
Ramcocem
471
3.8
May 6 US
Change in Nonfarm payrolls (thousands)
215
200
May 8 China
Exports YoY%
11.5
1.3
Top Losers
Price (`)
Chg (%)
May 10 India
Exports YoY%
(5.47)
--
Tvsmotor
288
(9.7)
May 10 India
Imports YoY%
(21.56)
--
6.(
Marico
255
(4.5)
More Events on Pg5
Centurytex
612
(4.2)
Amtekauto
37
(4.2)
Srtransfin
1,043
(3.7)
As on May 03, 2016
Market Outlook
May 4, 2016
Liberty House submits bid for Tata Steel UK assets
The UK-based commodity-trading firm Liberty House Group has formally
submitted the first bid for some of Tata Steel Ltd’s UK assets, in a move that could
potentially save thousands of jobs. Tata Steel Europe Ltd is a subsidiary of Tata
Steel—part of the $108 billion Tata Group. The bid is based on Liberty House’s
“green steel” business model and would involve a transition from steelmaking in
blast furnaces to recycling steel in electric arc furnaces while ensuring the company
continues to meet key customers’ quality requirements. The “green steel” model
refers to steelmaking would be ultimately powered by renewable energy sources.
We maintain our neutral view on the stock.
JSW Energy to buy JSPL’s Chhattisgarh power project
JSW Energy Ltd will buy 100% of Jindal Steel and Power Ltd’s (JSPL)
1,000
megawatt (MW) thermal power plant in Chhattisgarh at an enterprise value of
`4,000cr. If the power plant is completely secured of fuel and manages to enter
into long-term power purchase agreements (PPAs), then the enterprise value of the
deal could be increased to `6,500cr. The sale of the 1,000 MW power plant in
Chhattisgarh, owned by JSPL unit’s Jindal Power Ltd, will help the former meet
interest payment obligations and pare overall debt. Jindal Power has a total
capacity of 3,400 MW. Post the acquisition, JSW Energy will have total installed
power generation capacity of 5,531 MW.
Economic and Political News
GST, land reforms key to boost India's economic growth: IMF
IMF retains India's growth forecast at 7.5% for 2016, 2017
NSE to launch new exchange for MSMEs
Corporate News
Parag Milk raises `343 cr from anchor investors
Top 50 defaulters of PSBs had exposure of `1.21 lakh crore
Public sector banks face `66,190cr in wilful defaults, SBI tops list
Market Outlook
May 4, 2016
Quarterly Bloomberg Brokers Consensus Estimate
Jindal Steel & Power Ltd Consol - May 4, 2016
Particulars (` cr)
4QFY16E
4QFY15
y-o-y (%)
3QFY15
q-o-q (%)
Net sales
5,172
4,481
15.4
4,133
25.1
EBITDA
1,006
1,048
(3.9)
579
73.8
EBITDA margin (%)
19.5
23.4
14.0
Net profit
(408)
(519)
0.0
(573)
0.0
Hero Motocorp Ltd - May 5, 2016
Particulars (` cr)
4QFY16E
4QFY15
y-o-y (%)
3QFY15
q-o-q (%)
Net sales
7,445
6,695
11.2
3,398
3.8
EBITDA
1,161
838
38.5
1,224
(5.1)
EBITDA margin (%)
15.6
12.5
17.1
Net profit
809
477
69.8
796
1.7
Reliance Capital Ltd. - May 6, 2016
Particulars (` cr)
4QFY16E
4QFY15
y-o-y (%)
3QFY15
q-o-q (%)
Net sales
1,940
2,469
(21.4)
2,315
(16.2)
EBITDA
243
1,125
(78.4)
1,091
(77.7)
EBITDA margin (%)
12.5
45.6
47.1
Net profit
360
407
(11.5)
235
53.2
Siemens Ltd. - May 6, 2016
Particulars (` cr)
4QFY16E
4QFY15
y-o-y (%)
3QFY15
q-o-q (%)
Net sales
2,793
2,319
20.4
2,589
7.9
EBITDA
260
53
392.3
250
3.9
EBITDA margin (%)
9.3
2.3
9.7
Net profit
159
13
1,125.9
162
(1.6)
Titan company Ltd. - May 6, 2016
Particulars (` cr)
4QFY16E
4QFY15
y-o-y (%)
3QFY15
q-o-q (%)
Net sales
2,823
2,474
14.1
3,398
(16.9)
EBITDA
294
270
8.8
324
(9.2)
EBITDA margin (%)
10.4
10.9
9.5
Net profit
215
215
0.0
225
(4.5)
Market Outlook
May 4, 2016
Top Picks ★★★★★
Large Cap
Market Cap
CMP
Target
Upside
Company
Rationale
(` Cr)
(`)
(`)
(%)
To outpace battery industry growth due to better technological
Amara Raja Batteries
16,336
956
1,076
12.5
products leading to market share gains in both the automotive
OEM and replacement segments.
Uptick in defense capex by government when coupled with
Bharat Electronics
28,222
1,176
1,414
20.2
BELs strong market positioning, indicate that good times are
ahead for BEL.
The stock is trading at attractive valuations and is factoring all
HCL Tech
1,02,872
729
1,038
42.3
the bad news.
Strong visibility for a robust 20% earnings trajectory, coupled
HDFC Bank
2,82,629
1,117
1,262
13.0
with high quality of earnings on account of high quality retail
business and strategic focus on highly rated corporates.
Back on the growth trend, expect a long term growth of 14%
Infosys
2,72,097
1,181
1,374
16.4
to be a US$20bn in FY2020.
LICHF continues to grow its retail loan book at a healthy pace
with improvement in asset quality. We expect the company to
LIC Housing Finance
22,955
455
592
30.1
post a healthy loan book which is likely to reflect in a strong
earnings growth.
Huge bid pipeline of re-development works at Delhi and other
NBCC
12,099
1,008
1,089
8.0
State Governments and opportunity from Smart City, positions
NBCC to report strong growth, going forward.
Source: Company, Angel Research
Mid Cap
Market Cap
CMP
Target
Upside
Company
Rationale
(` Cr)
(`)
(`)
(%)
Favorable outlook for the AC industry to augur well for
Cooling products business which is out pacing the market
Blue Star
3,807
423
481
13.7
growth. EMPPAC division's profitability to improve once
operating environment turns around.
With a focus on the low and medium income (LMI) consumer
Dewan Housing
5,953
204
270
32.4
segment, the company has increased its presence in tier-II &
III cities where the growth opportunity is immense.
Commencement of new projects, downtrend in the interest
IL&FS Transport
2,497
76
93
22.5
rate cycle, to lead to stock re-rating
Economic recovery to have favourable impact on advertising
& circulation revenue growth. Further, the acquisition of a
Jagran Prakashan
5,324
163
205
25.9
radio business (Radio City) would also boost the company's
revenue growth.
Speedier execution and speedier sales, strong revenue visibilty
Mahindra Lifespace
1,777
433
554
27.9
in short-to-long run, attractive valuations
Massive capacity expansion along with rail advantage at ICD
Navkar Corporation
2,591
182
265
45.8
as well CFS augurs well for the company
Earnings boost on back of stable material prices and
Radico Khaitan
1,191
90
156
74.3
favourable pricing environment. Valuation discount to peers
provides additional comfort
Strong brands and distribution network would boost growth
Siyaram Silk Mills
950
1,013
1,354
33.6
going ahead. Stock currently trades at an inexpensive
valuation.
Source: Company, Angel Research
Market Outlook
May 04, 2016
Key Upcoming Events
Result Calendar
Date
Company
May 4, 2016
Mangalam Cement, Hexaware, Jindal Steel, Vesuvius India
May 5, 2016
Hero Motocorp
May 6, 2016
Siemens, Reliance Capital
May 7, 2016
Andhra Bank
May 9, 2016
HUL, MM Forging
May 10, 2016
Automotive Axle, Visaka Industries, Radico Khaitan
May 11, 2016
Apollo Tyres, Kotak Mah. Bank, South Ind.Bank, Asian Paints, TVS Srichakra, Quick Heal
May 12, 2016
Nestle, ITD Cementation, Dr Reddy's, Glenmark Pharma.
May 13, 2016
Central Bank, Cadila Healthcare
May 14, 2016
Relaxo
Source: Bloomberg, Angel Research
Global economic events release calendar
Date
Time
Country
Event Description
Unit
Period
Bloomberg Data
Last Reported Estimated
May 4,, 2016 1:25PM Germany
PMI Services
Value
Apr F
54.60
54.60
May 5,, 2016 6:00PM US
Change in Nonfarm payrolls
Thousands
Apr
215.00
200.00
May 6,, 2016 6:00PM US
Initial Jobless claims
Thousands
Apr 30
257.00
260.00
6:00PM US
Unnemployment rate
%
Apr
5.00
4.90
May 8,, 2016
India
Exports YoY%
% Change
Apr
(5.47)
--
May 10, 2016
China
Exports YoY%
% Change
Apr
11.50
1.30
India
Imports YoY%
% Change
Apr
(21.56)
--
7:00AM China
Consumer Price Index (YoY)
% Change
Apr
2.30
2.40
May 11, 2016 2:00PM UK
Industrial Production (YoY)
% Change
Mar
(0.50)
--
May 12, 2016 5:30PM India
Industrial Production YoY
% Change
Mar
2.00
--
4:30PM UK
BOE Announces rates
% Ratio
May 12
0.50
0.50
May 13, 2016 2:30PM Euro Zone
Euro-Zone GDP s.a. (QoQ)
% Change
1Q P
0.60
--
US
Producer Price Index (mom)
% Change
Apr
0.20
--
11:30AM Germany
GDP nsa (YoY)
% Change
1Q P
2.10
--
May 14, 201611:00AM China
Industrial Production (YoY)
% Change
Apr
6.80
6.60
Source: Bloomberg, Angel Research
Market Outlook
May 4, 2016
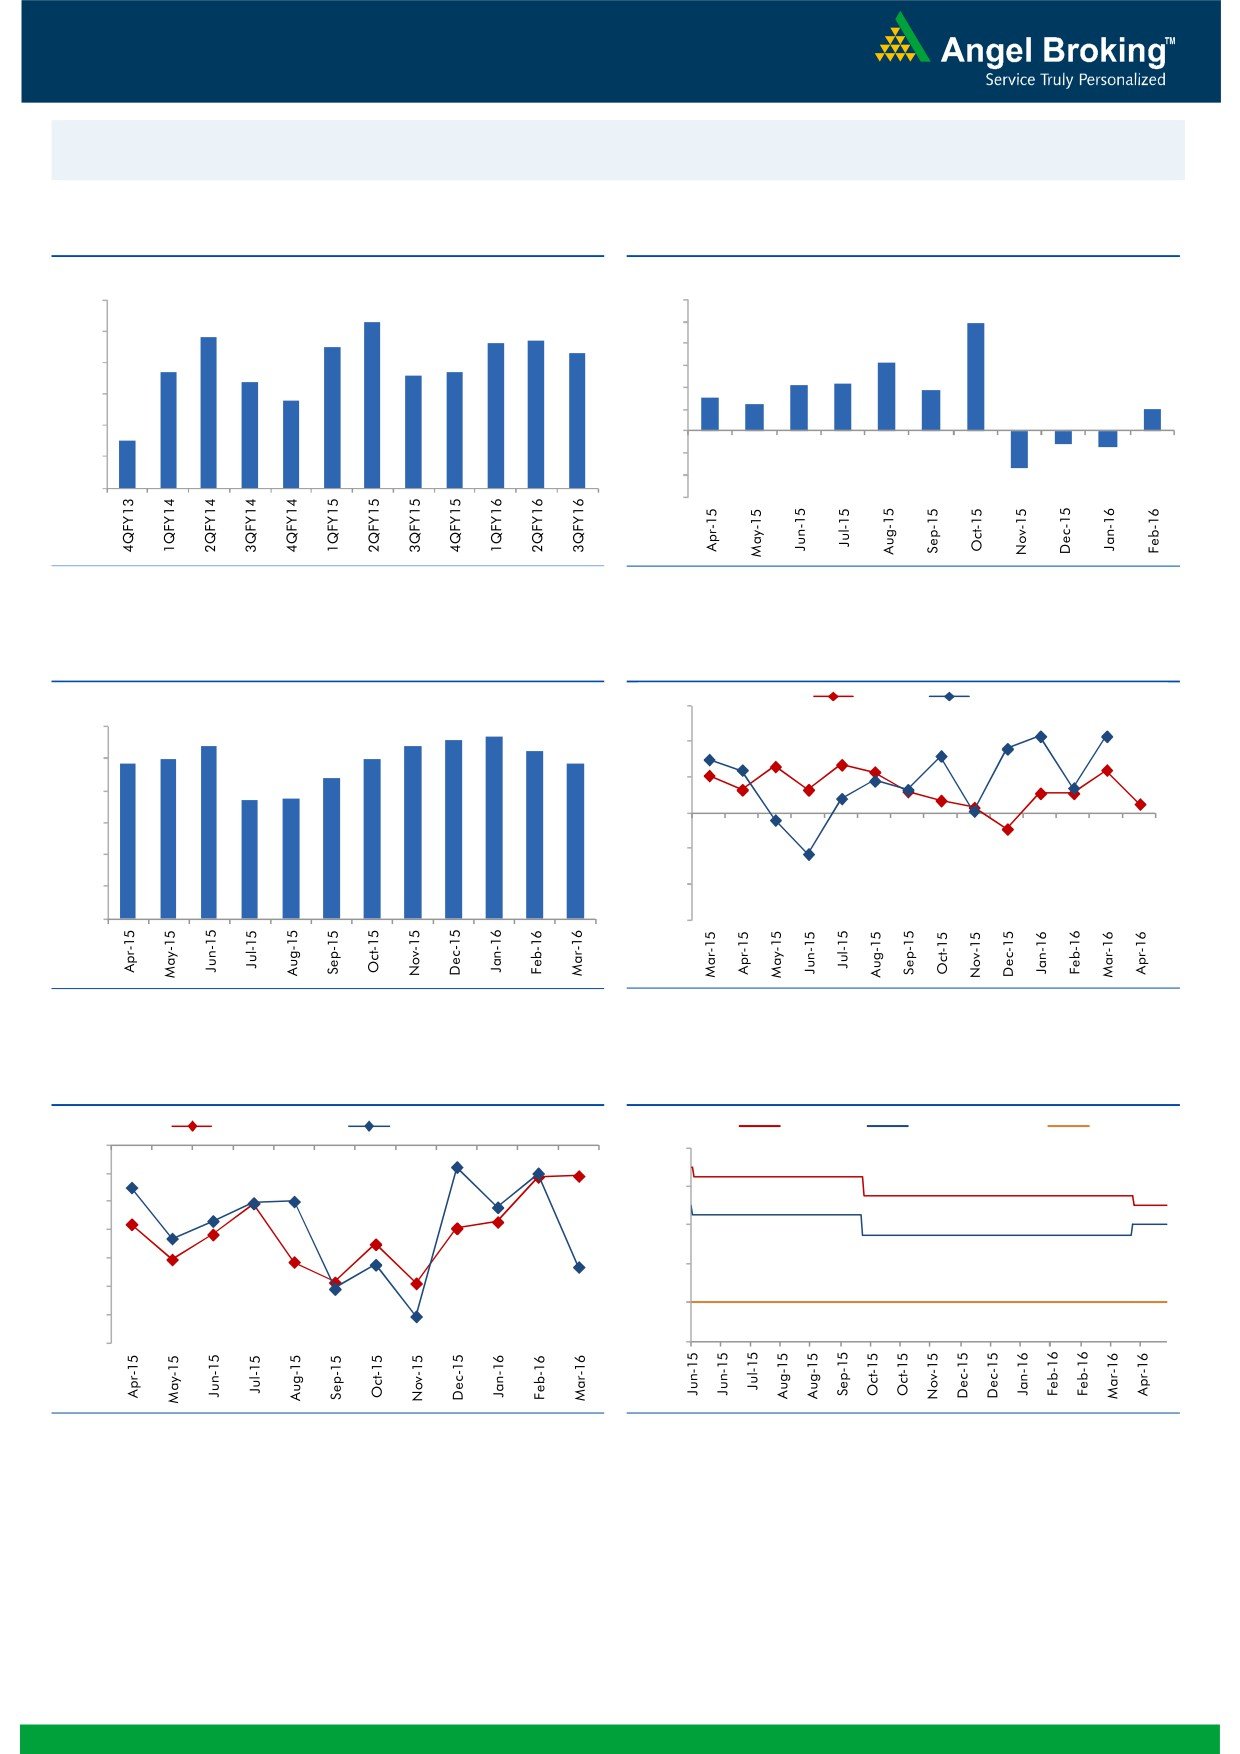
Macro watch
Exhibit 1: Quarterly GDP trends
Exhibit 2: IIP trends
(%)
(%)
9.0
12.0
8.3
9.9
7.8
7.7
10.0
8.0
7.5
7.6
7.3
8.0
6.3
6.7
6.6
6.7
7.0
6.4
6.0
4.2
4.3
3.7
5.8
3.0
4.0
2.5
6.0
2.0
2.0
5.0
4.5
-
4.0
(2.0)
(1.2)
(1.5)
(4.0)
3.0
(3.4)
(6.0)
Source: CSO, Angel Research
Source: MOSPI, Angel Research
Exhibit 3: Monthly CPI inflation trends
Exhibit 4: Manufacturing and services PMI
Mfg. PMI
Services PMI
(%)
56.0
5.6
5.7
6.0
5.4
5.4
5.3
5.0
5.0
54.0
4.9
4.8
5.0
4.4
3.7
3.7
52.0
4.0
50.0
3.0
2.0
48.0
1.0
46.0
-
44.0
Source: MOSPI, Angel Research
Source: Market, Angel Research; Note: Level above 50 indicates expansion
Exhibit 5: Exports and imports growth trends
Exhibit 6: Key policy rates
(%)
Exports yoy growth
Imports yoy growth
(%)
Repo rate
Reverse Repo rate
CRR
0.0
8.00
(5.0)
7.00
(10.0)
(15.0)
6.00
(20.0)
5.00
(25.0)
4.00
(30.0)
(35.0)
3.00
Source: Bloomberg, Angel Research
Source: RBI, Angel Research
Market Outlook
May 4, 2016
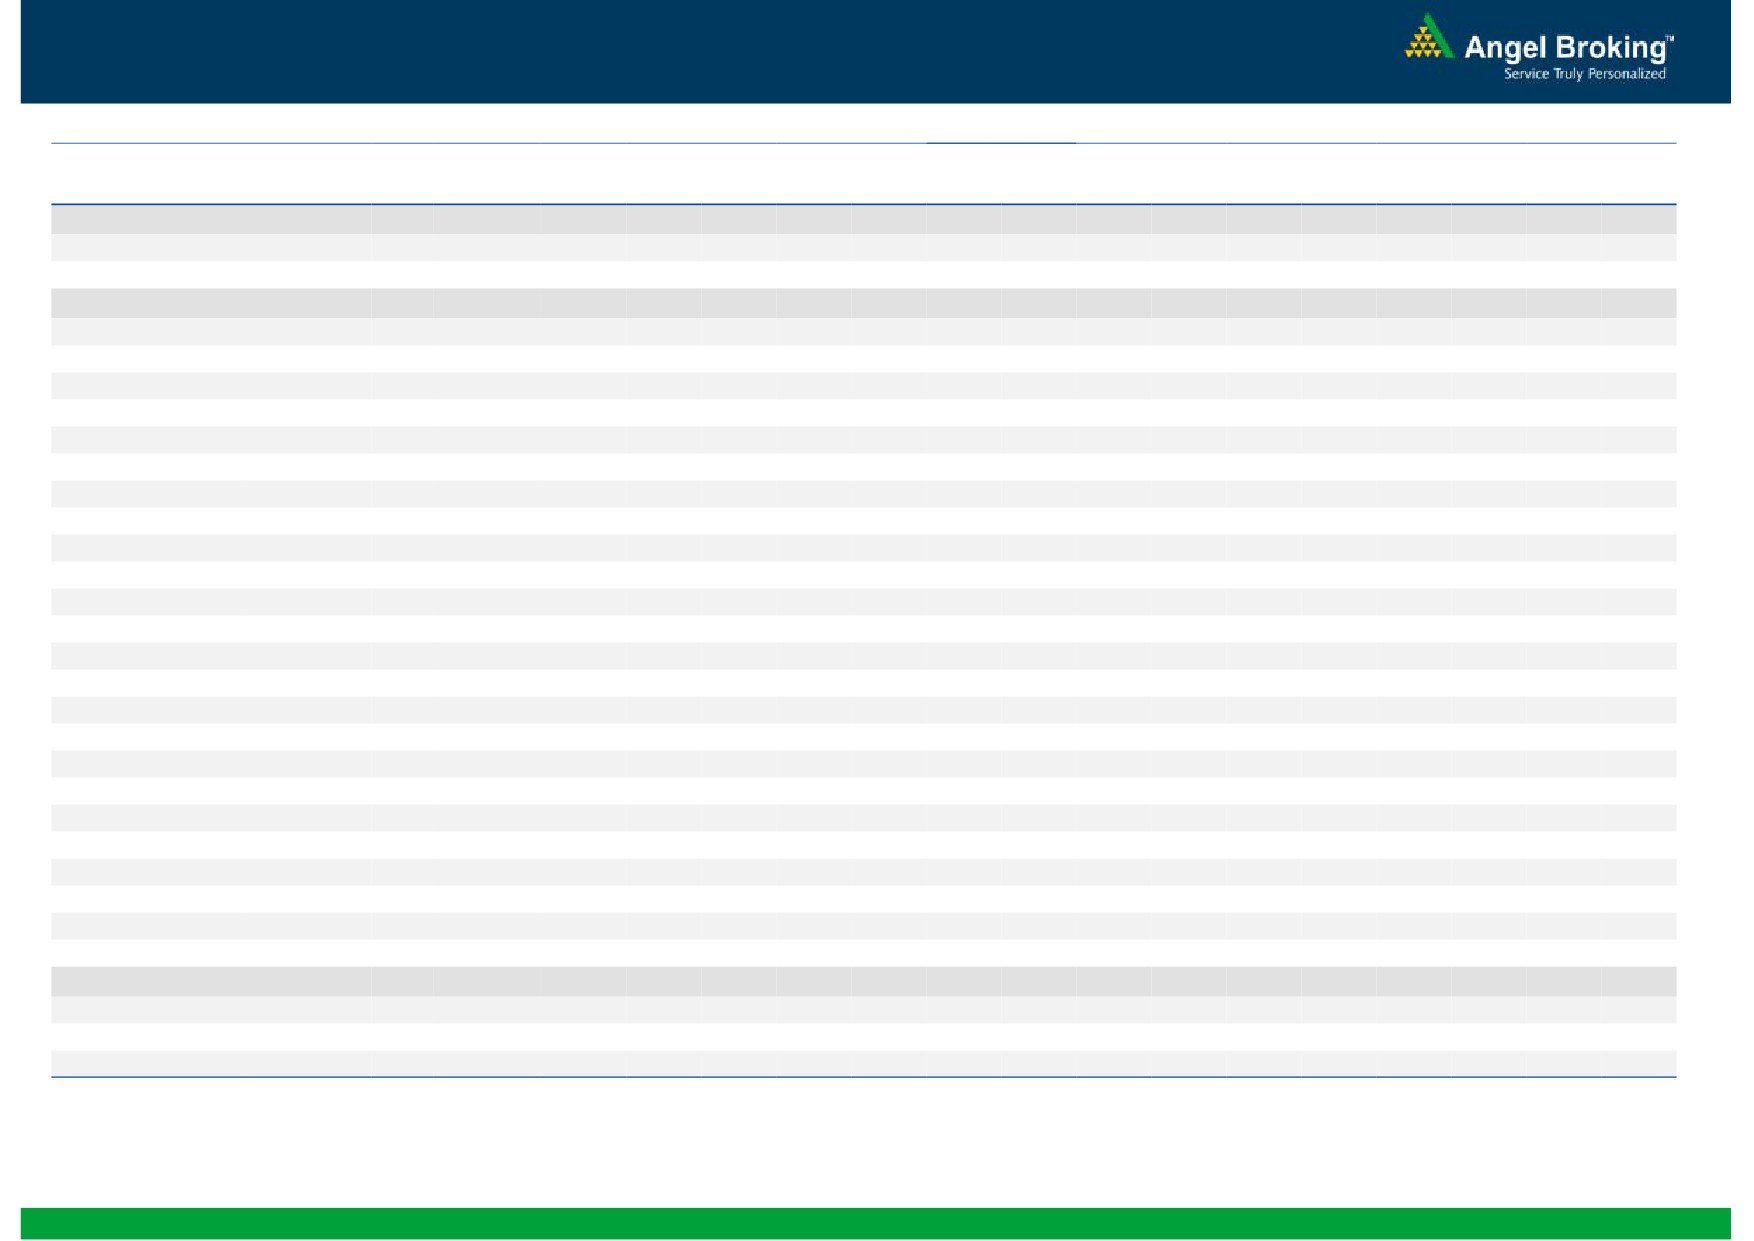
Global watch
Exhibit 1: Relative performance of indices across globe
Returns (%)
Country
Name of index
Closing price
1M
3M
1YR
Brazil
Bovespa
52,260
4.5
39.6
(3.8)
Russia
Micex
1,953
4.5
10.2
16.9
India
Nifty
7,747
2.0
4.2
(5.7)
China
Shanghai Composite
2,993
(0.3)
1.8
(32.2)
South Africa
Top 40
45,549
(1.6)
6.3
(5.3)
Mexico
Mexbol
45,648
(0.4)
8.5
1.0
Indonesia
LQ45
827
(1.6)
3.4
(12.7)
Malaysia
KLCI
1,651
(3.9)
1.0
(11.3)
Thailand
SET 50
887
(1.2)
11.6
(13.5)
USA
Dow Jones
17,751
1.2
8.7
(1.0)
UK
FTSE
6,186
0.2
1.7
(10.8)
Japan
Nikkei
16,147
(4.3)
(5.2)
(18.9)
Germany
DAX
9,927
1.5
1.9
(12.9)
France
CAC
4,372
1.1
(0.5)
(12.1)
Source: Bloomberg, Angel Research
Stock Watch
May 04, 2016
Company Name
Reco
CMP
Target
Mkt Cap
Sales ( Čcr )
OPM(%)
EPS (Č)
PER(x)
P/BV(x)
RoE(%)
EV/Sales(x)
(Č)
Price ( Č)
( Č cr )
FY16E FY17E
FY16E
FY17E
FY16E
FY17E
FY16E
FY17E
FY16E
FY17E
FY16E
FY17E
FY16E
FY17E
Agri / Agri Chemical
Rallis
Neutral
195
-
3,785
1,612
1,911
13.3
13.3
7.4
9.5
26.3
20.5
4.2
3.8
16.7
18.4
2.4
2.0
United Phosphorus
Buy
579
684
24,810
13,083
15,176
18.5
18.5
31.5
37.4
18.4
15.5
3.7
3.0
21.4
21.4
2.1
1.7
Auto & Auto Ancillary
Ashok Leyland
Accumulate
105
111
29,896
17,995
21,544
11.4
11.6
3.4
4.7
30.9
22.4
5.4
5.0
17.7
22.2
1.6
1.3
Bajaj Auto
Neutral
2,463
-
71,277
22,709
25,860
20.9
20.1
129.0
143.6
19.1
17.2
5.9
5.0
30.7
29.4
2.7
2.3
Bharat Forge
Accumulate
796
875
18,529
7,351
8,318
19.9
19.7
31.2
36.5
25.5
21.8
4.6
3.9
19.3
19.2
2.7
2.3
Eicher Motors
Neutral
19,982
-
54,272
15,556
16,747
15.5
17.3
464.8
597.5
43.0
33.4
15.7
11.6
36.2
34.3
3.4
3.1
Gabriel India
Accumulate
93
101
1,338
1,415
1,544
8.7
9.0
4.6
5.4
20.3
17.3
3.7
3.3
18.1
18.9
0.9
0.8
Hero Motocorp
Neutral
2,884
-
57,598
28,244
30,532
15.5
15.9
156.7
168.5
18.4
17.1
7.4
6.2
39.9
36.4
1.9
1.7
Jamna Auto Industries Accumulate
142
160
1,137
1,281
1,473
11.2
11.5
7.6
9.2
18.7
15.5
4.7
3.9
25.4
25.2
0.9
0.8
L G Balakrishnan & Bros Neutral
458
-
719
1,254
1,394
11.6
11.8
35.9
41.7
12.8
11.0
1.7
1.5
13.5
13.8
0.7
0.6
Mahindra and Mahindra Neutral
1,326
-
82,348
38,416
42,904
13.7
13.9
54.8
63.4
24.2
20.9
3.7
3.3
15.4
15.8
1.8
1.6
Maruti
Neutral
3,817
-
115,301
57,865
68,104
16.4
16.7
176.3
225.5
21.7
16.9
4.2
3.6
19.4
21.2
1.8
1.4
Minda Industries
Neutral
1,006
-
1,596
2,523
2,890
8.7
9.0
55.0
65.4
18.3
15.4
3.5
2.9
19.3
18.7
0.7
0.6
Motherson Sumi
Buy
259
313
34,226
39,343
45,100
8.8
9.1
10.1
12.5
25.6
20.7
8.1
6.4
35.3
34.4
0.9
0.8
Rane Brake Lining
Buy
375
465
297
454
511
11.5
12.0
25.2
31.0
14.9
12.1
2.2
2.0
14.9
16.6
0.8
0.7
Setco Automotive
Neutral
31
-
415
594
741
12.7
13.7
1.7
3.2
18.3
9.7
1.9
1.7
10.4
16.9
1.1
0.9
Tata Motors
Neutral
410
-
118,231
259,686
273,957
13.0
13.4
25.9
29.5
15.8
13.9
2.1
1.8
8.0
9.0
0.6
0.6
TVS Motor
Accumulate
288
330
13,678
11,263
13,122
6.9
8.5
9.2
15.0
31.3
19.2
7.1
5.7
22.7
29.6
1.2
1.0
Amara Raja Batteries
Accumulate
956
1,076
16,336
4,892
5,871
17.4
17.6
28.8
37.1
33.2
25.8
7.8
6.2
23.4
24.1
3.3
2.7
Exide Industries
Accumulate
144
162
12,253
6,950
7,784
14.4
14.8
6.6
7.3
21.8
19.8
2.8
2.5
12.6
12.8
1.5
1.3
Apollo Tyres
Buy
158
183
8,066
12,056
12,714
17.2
16.4
23.0
20.3
6.9
7.8
1.2
1.1
17.7
13.6
0.7
0.7
Ceat
Neutral
1,097
-
4,437
6,041
6,597
14.1
13.7
99.5
111.9
11.0
9.8
2.2
1.8
19.6
18.5
0.9
0.8
JK Tyres
Neutral
83
-
1,881
7,446
7,669
15.2
14.0
19.6
18.4
4.2
4.5
1.1
0.9
25.2
19.5
0.7
0.6
Swaraj Engines
Neutral
1,134
-
1,408
552
630
14.2
14.7
44.6
54.1
25.4
21.0
5.9
5.4
23.2
25.6
2.4
2.1
Subros
Neutral
93
-
555
1,293
1,527
11.8
11.9
4.2
6.7
22.0
13.8
1.7
1.5
7.7
11.5
0.7
0.6
Indag Rubber
Neutral
182
-
479
283
329
17.0
17.2
13.0
15.4
14.1
11.8
3.1
2.6
21.8
21.6
1.4
1.2
Capital Goods
ACE
Neutral
40
-
393
660
839
4.7
8.2
1.0
3.9
39.7
10.2
1.2
1.1
3.2
11.3
0.7
0.6
BEML
Buy
915
1,157
3,812
3,277
4,006
6.0
8.9
36.2
64.3
25.3
14.2
1.8
1.6
5.7
11.7
1.3
1.0
Bharat Electronics
Buy
1,176
1,414
28,222
7,737
8,634
16.8
17.2
54.0
61.5
21.8
19.1
3.1
2.8
39.3
45.6
2.8
2.4
Stock Watch
May 04, 2016
Company Name
Reco
CMP
Target
Mkt Cap
Sales ( Čcr )
OPM(%)
EPS (Č)
PER(x)
P/BV(x)
RoE(%)
EV/Sales(x)
(Č)
Price ( Č)
( Č cr )
FY16E
FY17E
FY16E
FY17E
FY16E
FY17E
FY16E
FY17E
FY16E
FY17E
FY16E
FY17E
FY16E
FY17E
Capital Goods
Voltas
Buy
297
353
9,831
5,363
5,963
8.0
9.1
11.0
13.8
27.0
21.5
4.1
3.6
16.2
17.9
1.8
1.6
BGR Energy
Neutral
118
-
849
3,615
3,181
9.5
9.4
16.7
12.4
7.0
9.5
0.7
0.7
10.0
7.0
0.6
0.8
BHEL
Neutral
125
-
30,473
33,722
35,272
10.8
11.7
10.5
14.2
11.9
8.8
0.9
0.8
7.0
9.0
1.0
0.9
Blue Star
Accumulate
423
481
3,807
3,548
3,977
6.3
6.9
13.7
17.2
30.9
24.7
7.8
5.1
26.1
25.4
1.2
1.0
Crompton Greaves
Neutral
57
-
3,563
13,484
14,687
4.9
6.2
4.5
7.1
12.6
8.0
0.9
0.8
7.2
10.8
0.4
0.4
Greaves Cotton
Neutral
134
-
3,264
1,655
1,755
16.6
16.8
7.4
7.8
18.1
17.1
3.6
3.4
21.1
20.6
1.9
1.8
Inox Wind
Buy
283
458
6,278
4,980
5,943
17.0
17.5
26.6
31.6
10.6
9.0
3.2
2.3
35.0
30.0
1.4
1.1
KEC International
Neutral
129
-
3,306
8,791
9,716
6.1
6.8
5.4
8.2
23.8
15.7
2.4
2.2
10.0
14.0
0.6
0.6
Thermax
Neutral
738
-
8,799
6,413
7,525
7.4
8.5
30.5
39.3
24.2
18.8
3.7
3.2
15.0
17.0
1.3
1.1
VATech Wabag
Neutral
588
-
3,202
2,722
3,336
7.9
8.1
19.5
24.6
30.1
23.9
3.2
2.8
11.1
12.4
1.3
1.0
Cement
ACC
Neutral
1,421
-
26,686
13,151
14,757
16.4
18.3
63.9
83.4
22.2
17.0
2.9
2.6
13.3
16.1
1.9
1.6
Ambuja Cements
Neutral
219
-
33,948
11,564
12,556
19.4
20.7
8.9
10.1
24.6
21.7
3.1
2.9
12.8
13.8
2.6
2.3
HeidelbergCement
Neutral
96
-
2,174
1,772
1,926
13.3
15.4
1.0
3.0
96.0
32.0
2.4
2.3
2.6
7.9
1.8
1.6
India Cements
Neutral
91
-
2,795
4,216
4,840
18.0
19.5
4.0
9.9
22.8
9.2
0.9
0.8
4.0
9.5
1.0
0.8
JK Cement
Neutral
591
-
4,131
3,661
4,742
10.1
15.8
7.5
28.5
78.8
20.7
2.4
2.1
7.5
22.9
1.6
1.2
J K Lakshmi Cement
Neutral
348
-
4,097
2,947
3,616
16.7
19.9
11.5
27.2
30.3
12.8
2.9
2.5
9.8
20.8
1.8
1.4
Mangalam Cements
Neutral
266
-
709
1,053
1,347
10.5
13.3
8.4
26.0
31.6
10.2
1.3
1.2
4.3
12.5
1.1
0.8
Orient Cement
Neutral
148
-
3,041
1,854
2,524
21.2
22.2
7.7
11.1
19.3
13.4
2.8
2.4
13.3
15.7
2.4
1.7
Ramco Cements
Neutral
471
-
11,217
4,036
4,545
20.8
21.3
15.1
18.8
31.2
25.1
3.8
3.4
12.9
14.3
3.3
2.9
Shree Cement^
Neutral
12,399
-
43,196
7,150
8,742
26.7
28.6
228.0
345.5
54.4
35.9
8.0
6.7
15.7
20.3
5.8
4.7
UltraTech Cement
Neutral
3,214
-
88,208
24,669
29,265
18.2
20.6
82.0
120.0
39.2
26.8
4.2
3.7
11.3
14.7
3.6
3.1
Construction
ITNL
Buy
76
93
2,497
7,360
8,825
34.0
35.9
7.0
9.0
10.8
8.4
0.4
0.4
3.2
3.7
3.7
3.6
KNR Constructions
Accumulate
531
603
1,493
937
1,470
14.3
14.0
44.2
38.6
12.0
13.8
2.4
2.1
15.4
15.4
1.7
1.1
Larsen & Toubro
Neutral
1,251
-
116,559
58,870
65,708
8.3
10.3
42.0
53.0
29.8
23.6
2.1
1.9
8.8
11.2
2.2
2.0
Gujarat Pipavav Port
Neutral
169
-
8,189
629
684
51.0
52.2
6.4
5.9
26.5
28.7
3.5
3.2
15.9
12.7
12.7
11.5
MBL Infrastructures
Buy
145
285
600
2,313
2,797
12.2
14.6
19.0
20.0
7.6
7.2
0.8
0.7
11.3
10.6
1.0
0.9
Nagarjuna Const.
Neutral
78
-
4,350
7,892
8,842
8.8
9.1
3.0
5.3
26.1
14.8
1.3
1.2
5.0
8.5
0.8
0.7
PNC Infratech
Accumulate
527
558
2,701
1,873
2,288
13.2
13.5
24.0
32.0
21.9
16.5
2.1
1.9
12.1
12.3
1.5
1.3
Simplex Infra
Neutral
261
-
1,293
5,955
6,829
10.3
10.5
16.0
31.0
16.3
8.4
0.9
0.8
5.3
9.9
0.7
0.6
Stock Watch
May 04, 2016
Company Name
Reco
CMP
Target
Mkt Cap
Sales ( Čcr )
OPM(%)
EPS (Č)
PER(x)
P/BV(x)
RoE(%)
EV/Sales(x)
(Č)
Price ( Č)
( Č cr )
FY16E
FY17E
FY16E
FY17E
FY16E
FY17E
FY16E
FY17E
FY16E
FY17E
FY16E
FY17E
FY16E
FY17E
Construction
Power Mech Projects
Neutral
588
-
866
1,539
1,801
12.8
12.7
59.0
72.1
10.0
8.2
1.5
1.3
18.6
16.8
0.6
0.5
Sadbhav Engineering
Accumulate
259
289
4,443
3,481
4,219
10.7
10.8
8.2
11.7
31.6
22.1
3.0
2.6
10.3
13.5
1.5
1.3
NBCC
Accumulate
1,008
1,089
12,099
5,816
7,382
6.9
7.7
29.6
39.8
34.1
25.3
6.1
4.8
24.1
26.7
1.8
1.4
MEP Infra
Neutral
41
-
670
1,956
1,876
28.1
30.5
1.3
3.0
31.7
13.7
6.7
4.5
21.2
32.8
1.8
1.7
SIPL
Neutral
101
-
3,557
675
1,042
62.4
64.7
-
-
3.8
4.3
-
-
16.9
11.4
Engineers India
Neutral
181
-
6,085
1,667
1,725
13.5
16.0
9.7
11.4
18.6
15.8
2.2
2.1
11.7
13.4
2.4
2.5
Financials
Allahabad Bank
Neutral
56
-
3,462
8,569
9,392
2.8
2.9
16.3
27.5
3.5
2.1
0.3
0.3
7.6
11.9
-
-
Axis Bank
Accumulate
470
494
111,986
26,473
31,527
3.5
3.6
35.7
43.5
13.1
10.8
2.2
1.9
17.9
18.9
-
-
Bank of Baroda
Neutral
153
-
35,231
18,485
21,025
1.9
2.0
13.5
21.1
11.4
7.2
0.9
0.8
7.3
10.6
-
-
Bank of India
Neutral
88
-
7,173
15,972
17,271
1.9
2.0
15.3
33.4
5.7
2.6
0.3
0.2
3.6
7.6
-
-
Canara Bank
Neutral
196
-
10,662
15,441
16,945
2.0
2.1
46.6
70.4
4.2
2.8
0.4
0.3
8.0
11.2
-
-
Dena Bank
Neutral
29
-
1,957
3,440
3,840
2.1
2.3
7.3
10.0
4.1
2.9
0.3
0.3
6.1
7.9
-
-
Dewan Housing Finance Buy
204
270
5,953
1,892
2,277
2.9
2.9
25.9
30.8
7.9
6.6
1.2
1.1
15.3
15.9
-
-
Federal Bank
Neutral
47
-
8,066
3,477
3,999
3.0
3.0
5.0
6.2
9.4
7.5
0.9
0.9
10.6
11.9
-
-
HDFC
Neutral
1,100
-
173,703
10,358
11,852
3.3
3.3
41.1
47.0
26.8
23.4
5.1
4.6
24.7
24.9
-
-
HDFC Bank
Accumulate
1,117
1,262
282,629
38,309
47,302
4.3
4.3
49.3
61.1
22.7
18.3
3.9
3.4
18.5
19.7
-
-
ICICI Bank
Accumulate
221
254
128,718
34,279
39,262
3.3
3.3
21.0
24.4
10.6
9.1
1.8
1.5
14.4
14.7
-
-
IDBI Bank
Neutral
68
-
13,979
9,625
10,455
1.8
1.8
8.5
14.2
8.0
4.8
0.5
0.5
5.9
9.3
-
-
Indian Bank
Neutral
96
-
4,630
6,160
6,858
2.5
2.5
24.5
29.8
3.9
3.2
0.3
0.3
7.7
8.6
-
-
LIC Housing Finance
Buy
455
592
22,955
3,101
3,745
2.5
2.5
33.0
40.2
13.8
11.3
2.6
2.2
19.7
20.5
-
-
Oriental Bank
Neutral
87
-
2,796
7,643
8,373
2.4
2.4
37.2
45.4
2.3
1.9
0.2
0.2
8.2
9.4
-
-
Punjab Natl.Bank
Neutral
83
-
16,268
23,638
26,557
2.8
2.8
17.9
27.2
4.6
3.0
0.5
0.4
8.5
12.0
-
-
South Ind.Bank
Neutral
18
-
2,424
1,965
2,185
2.5
2.5
2.5
3.3
7.2
5.4
0.7
0.6
9.5
11.7
-
-
St Bk of India
Neutral
184
-
142,990
79,958
86,061
2.6
2.6
13.4
20.7
13.8
8.9
1.1
1.1
11.5
12.8
-
-
Union Bank
Neutral
124
-
8,548
12,646
14,129
2.3
2.4
31.0
39.1
4.0
3.2
0.4
0.4
9.8
11.4
-
-
Vijaya Bank
Neutral
31
-
2,919
3,536
3,827
1.9
1.9
5.5
6.7
5.7
4.7
0.5
0.4
7.8
8.8
-
-
Yes Bank
Neutral
932
-
39,214
7,190
9,011
3.2
3.3
58.2
69.7
16.0
13.4
2.9
2.4
19.2
19.6
-
-
FMCG
Asian Paints
Neutral
872
-
83,599
16,553
19,160
16.0
16.2
17.7
21.5
49.3
40.5
13.1
11.8
29.4
31.2
4.9
4.2
Britannia
Neutral
2,847
-
34,163
8,481
9,795
14.0
14.1
65.5
78.3
43.5
36.4
20.6
16.9
38.3
41.2
4.0
3.4
Stock Watch
May 04, 2016
Company Name
Reco
CMP
Target
Mkt Cap
Sales ( Čcr )
OPM(%)
EPS (Č)
PER(x)
P/BV(x)
RoE(%)
EV/Sales(x)
(Č)
Price ( Č)
( Č cr )
FY16E FY17E
FY16E
FY17E
FY16E
FY17E
FY16E
FY17E
FY16E
FY17E
FY16E
FY17E
FY16E
FY17E
FMCG
Colgate
Neutral
852
-
23,180
4,136
4,632
22.5
23.3
22.2
25.3
38.4
33.7
23.4
20.8
68.6
67.5
5.5
4.9
Dabur India
Neutral
290
-
51,041
9,370
10,265
17.6
17.3
7.3
8.1
39.6
35.8
10.3
9.4
31.7
30.6
5.3
4.8
GlaxoSmith Con*
Accumulate
5,822
6,118
24,485
4,519
5,142
19.6
19.8
164.3
191.2
35.4
30.5
9.8
8.4
30.8
29.9
4.8
4.2
Godrej Consumer
Neutral
1,362
-
46,367
9,003
10,335
18.1
18.7
34.1
41.8
39.9
32.6
8.6
7.4
23.9
24.8
5.3
4.6
HUL
Neutral
851
-
184,043
33,299
35,497
17.1
17.1
18.9
20.0
45.0
42.5
22.8
26.2
87.6
80.8
5.3
5.0
ITC
Accumulate
317
359
255,016
36,804
38,776
37.9
37.9
12.2
12.9
26.0
24.6
7.2
6.4
27.7
25.8
6.5
6.2
Marico
Neutral
255
-
32,925
6,151
6,966
17.2
17.3
5.4
6.4
47.3
39.9
14.8
11.7
33.2
32.4
5.2
4.6
Nestle*
Neutral
5,605
-
54,043
9,393
10,507
22.2
22.3
106.8
121.8
52.5
46.0
18.4
16.6
34.8
36.7
5.6
4.9
Tata Global
Accumulate
119
137
7,539
8,635
9,072
9.8
9.9
5.8
7.2
20.6
16.6
1.8
1.8
6.8
7.4
0.9
0.9
Procter & Gamble
Accumulate
6,438
7,369
20,898
2,588
2,939
23.3
23.2
130.2
146.2
49.4
44.1
98.6
94.5
27.6
25.3
7.7
6.7
Hygiene
IT
HCL Tech^
Buy
729
1,038
102,872
42,038
47,503
21.2
21.5
51.5
57.7
14.2
12.6
3.1
2.4
21.5
18.8
2.1
1.6
Infosys
Buy
1,181
1,374
272,097
62,441
70,558
27.5
27.5
59.0
65.3
20.0
18.1
4.0
3.7
22.2
22.4
3.8
3.3
TCS
Buy
2,480
3,004
488,715
108,646
122,770
28.3
28.3
123.7
141.0
20.1
17.6
6.6
6.1
33.1
34.6
4.0
3.5
Tech Mahindra
Accumulate
467
530
45,323
26,524
29,177
16.2
17.0
28.8
33.6
16.2
13.9
3.1
2.7
19.3
19.1
1.5
1.3
Wipro
Buy
544
680
134,296
50,808
56,189
23.7
23.8
37.3
40.7
14.6
13.4
2.8
2.5
19.2
17.7
2.1
1.8
Media
D B Corp
Accumulate
333
356
6,119
2,025
2,187
27.4
27.4
17.4
18.9
19.1
17.7
4.3
3.9
22.9
23.7
3.0
2.8
HT Media
Neutral
88
-
2,037
2,495
2,673
12.9
13.2
6.8
7.2
12.9
12.2
1.0
1.0
7.5
7.8
0.4
0.3
Jagran Prakashan
Buy
163
205
5,324
2,170
2,355
27.2
26.2
8.9
9.9
18.3
16.5
3.8
3.4
20.9
20.5
2.3
2.2
Sun TV Network
Neutral
364
-
14,358
2,510
2,763
71.8
71.5
21.9
24.8
16.6
14.7
3.9
3.6
22.8
24.3
5.2
4.7
Hindustan Media
Neutral
268
-
1,965
914
1,016
21.7
21.5
21.9
23.3
12.2
11.5
2.2
1.9
18.0
16.2
1.6
1.3
Ventures
Metals & Mining
Coal India
Buy
280
380
176,763
76,167
84,130
19.9
22.3
22.4
25.8
12.5
10.8
4.5
4.4
35.5
41.0
1.7
1.5
Hind. Zinc
Neutral
173
-
73,014
14,641
14,026
50.4
50.4
17.7
16.0
9.8
10.8
1.5
1.4
16.2
13.2
2.6
2.5
Hindalco
Neutral
97
-
20,020
104,356
111,186
8.7
9.5
6.7
11.1
14.4
8.8
0.5
0.5
3.5
5.9
0.7
0.7
JSW Steel
Neutral
1,356
-
32,784
42,308
45,147
16.4
20.7
(10.3)
49.5
27.4
1.5
1.5
(1.0)
5.6
1.8
1.7
NMDC
Neutral
97
-
38,597
8,237
10,893
46.6
44.5
10.0
11.7
9.8
8.4
1.1
1.0
12.5
13.0
4.5
3.4
SAIL
Neutral
46
-
19,040
45,915
53,954
7.2
10.5
1.5
4.4
30.6
10.5
0.4
0.4
2.3
4.1
1.1
0.9
Vedanta
Neutral
110
-
32,612
71,445
81,910
26.2
26.3
12.9
19.2
8.5
5.7
0.6
0.5
7.2
8.9
0.9
0.7
Tata Steel
Neutral
348
-
33,842
126,760
137,307
8.9
11.3
6.4
23.1
54.8
15.1
1.1
1.1
2.0
7.1
0.8
0.8
Oil & Gas
Cairn India
Neutral
145
-
27,261
11,323
12,490
49.4
51.0
20.7
20.7
7.0
7.0
0.5
0.4
6.4
6.1
1.5
0.8
Stock Watch
May 04, 2016
Company Name
Reco
CMP
Target
Mkt Cap
Sales ( Čcr )
OPM(%)
EPS (Č)
PER(x)
P/BV(x)
RoE(%)
EV/Sales(x)
(Č)
Price ( Č)
( Č cr )
FY16E FY17E
FY16E
FY17E
FY16E
FY17E
FY16E
FY17E
FY16E
FY17E
FY16E
FY17E
FY16E
FY17E
Oil & Gas
GAIL
Neutral
363
-
46,065
64,856
70,933
9.1
9.6
24.0
28.9
15.2
12.6
1.3
1.2
8.8
9.6
0.9
0.8
ONGC
Neutral
215
-
184,200
154,564
145,998
36.8
37.4
20.8
22.6
10.4
9.5
1.0
0.9
10.1
9.7
1.4
1.5
Petronet LNG
Neutral
272
-
20,400
29,691
31,188
5.8
6.2
12.8
13.4
21.3
20.3
3.2
2.8
15.8
14.8
0.8
0.7
Indian Oil Corp
Accumulate
420
455
101,901
359,607
402,760
5.9
6.1
42.5
48.7
9.9
8.6
1.3
1.2
14.1
14.4
0.4
0.3
Reliance Industries
Buy
976
1,150
316,277
304,775
344,392
12.6
13.4
91.3
102.6
10.7
9.5
1.2
1.1
11.8
12.0
1.0
0.8
Pharmaceuticals
Alembic Pharma
Neutral
598
-
11,269
3,274
3,802
26.9
19.4
35.0
28.7
17.1
20.8
7.6
5.7
55.6
31.2
3.4
2.9
Aurobindo Pharma
Accumulate
802
856
46,928
14,923
17,162
22.0
23.0
35.7
42.8
22.5
18.7
6.6
5.0
34.0
30.2
3.5
3.0
Aventis*
Neutral
4,400
-
10,133
2,082
2,371
17.4
20.8
118.2
151.5
37.2
29.0
5.4
4.4
19.9
25.5
4.5
3.8
Cadila Healthcare
Accumulate
321
352
32,857
10,224
11,840
21.0
22.0
14.6
17.6
22.0
18.2
6.0
4.7
30.8
29.0
3.3
2.7
Cipla
Accumulate
536
605
43,086
13,979
16,447
20.2
18.6
25.7
27.5
20.9
19.5
3.4
2.9
17.6
16.1
3.1
2.6
Dr Reddy's
Buy
2,968
3,933
50,620
16,838
19,575
25.0
23.1
167.5
178.8
17.7
16.6
3.7
3.1
23.1
20.4
2.9
2.5
Dishman Pharma
Neutral
171
-
2,761
1,733
1,906
21.5
21.5
17.0
19.9
10.1
8.6
1.0
0.9
10.5
11.2
2.1
1.8
GSK Pharma*
Neutral
3,627
-
30,719
2,870
3,158
20.0
22.1
59.5
68.3
61.0
53.1
18.0
18.5
28.5
34.3
10.2
9.3
Indoco Remedies
Neutral
269
-
2,482
1,033
1,199
15.9
18.2
9.4
13.6
28.7
19.8
4.3
3.6
15.7
19.7
2.5
2.2
Ipca labs
Buy
494
900
6,227
3,363
3,909
12.9
18.6
13.4
28.0
36.8
17.6
2.6
2.3
7.4
14.0
2.1
1.8
Lupin
Neutral
1,579
-
71,172
13,092
16,561
25.0
27.0
50.4
68.3
31.3
23.1
6.5
5.1
22.8
24.7
5.2
4.0
Sun Pharma
Buy
798
950
192,136
28,163
32,610
25.8
30.7
17.4
26.9
45.9
29.7
4.4
3.8
13.0
16.6
6.3
5.2
Power
Tata Power
Neutral
71
-
19,230
35,923
37,402
22.6
22.8
4.1
5.2
17.5
13.8
1.3
1.3
7.5
9.3
1.5
1.4
NTPC
Accumulate
137
146
112,674
87,271
99,297
23.5
23.5
11.8
13.3
11.6
10.3
1.3
1.2
11.5
12.2
2.3
2.1
Power Grid
Buy
145
170
75,832
20,702
23,361
86.7
86.4
12.1
13.2
12.0
11.0
1.8
1.6
15.6
15.1
8.6
8.0
Real Estate
MLIFE
Buy
433
554
1,777
697
1,011
14.9
19.3
13.8
20.1
31.4
21.6
1.2
1.1
3.8
5.3
3.8
2.6
Telecom
Bharti Airtel
Neutral
367
-
146,705
101,748
109,191
32.1
31.7
12.0
12.5
30.6
29.4
2.1
2.0
6.9
6.7
2.1
1.9
Idea Cellular
Neutral
120
-
43,134
34,282
36,941
32.0
31.5
5.9
6.2
20.3
19.3
1.9
1.7
9.9
9.3
1.8
1.7
zOthers
Abbott India
Neutral
4,663
-
9,910
2,715
3,153
14.5
14.1
134.3
152.2
34.7
30.6
8.7
7.1
27.4
25.6
3.4
2.8
Bajaj Electricals
Neutral
229
-
2,315
4,719
5,287
5.2
5.8
8.6
12.7
26.8
18.1
3.1
2.7
11.4
14.8
0.5
0.4
Finolex Cables
Neutral
282
-
4,309
2,520
2,883
12.2
12.0
12.7
14.2
22.2
19.8
3.0
2.7
13.6
13.5
1.5
1.2
Goodyear India*
Buy
501
582
1,155
1,800
1,600
11.7
11.5
58.7
52.9
8.5
9.5
1.9
1.7
24.6
18.7
0.4
0.4
Hitachi
Neutral
1,363
-
3,706
1,779
2,081
7.8
8.8
21.8
33.4
62.5
40.8
10.1
8.2
17.4
22.1
2.1
1.8
Jyothy Laboratories
Neutral
301
-
5,451
1,620
1,847
11.5
11.5
7.3
8.5
41.3
35.5
5.3
4.9
13.3
14.4
3.2
2.8
Stock Watch
May 04, 2016
Company Name
Reco
CMP
Target
Mkt Cap
Sales ( Čcr )
OPM(%)
EPS (Č)
PER(x)
P/BV(x)
RoE(%)
EV/Sales(x)
(Č)
Price ( Č)
( Č cr )
FY16E
FY17E
FY16E
FY17E
FY16E
FY17E
FY16E
FY17E
FY16E
FY17E
FY16E
FY17E
FY16E
FY17E
zOthers
MRF
Buy
33,450
45,575
14,187
20,316
14,488
21.4
21.1
5,488.0
3,798.0
6.1
8.8
2.1
1.7
41.1
21.2
0.6
0.9
Page Industries
Neutral
12,629
-
14,087
1,929
2,450
19.8
20.1
229.9
299.0
54.9
42.3
24.2
16.8
52.1
47.1
7.3
5.8
Relaxo Footwears
Neutral
496
-
5,954
1,767
2,152
12.3
12.5
19.3
25.1
25.8
19.8
6.3
4.9
27.7
27.8
3.4
2.8
Siyaram Silk Mills
Buy
1,013
1,354
950
1,636
1,815
11.5
11.5
89.9
104.1
11.3
9.7
1.9
1.6
17.9
17.8
0.7
0.7
Styrolution ABS India* Neutral
616
-
1,084
1,271
1,440
8.6
9.2
32.0
41.1
19.2
15.0
2.0
1.8
10.7
12.4
0.8
0.7
TVS Srichakra
Buy
2,362
3,217
1,808
2,035
2,252
15.9
15.3
248.6
268.1
9.5
8.8
4.1
3.0
43.6
33.9
0.9
0.8
HSIL
Neutral
309
-
2,231
2,123
2,384
16.1
16.5
15.0
18.9
20.5
16.4
1.6
1.5
8.0
9.4
1.4
1.2
Kirloskar Engines India
Neutral
234
-
3,384
2,403
2,554
8.6
9.9
9.2
10.5
25.5
22.3
2.4
2.3
9.7
10.7
1.1
1.0
Ltd
M M Forgings
Buy
488
614
589
511
615
21.7
21.6
43.1
55.8
11.3
8.8
2.1
1.7
19.9
21.2
1.4
1.0
Banco Products (India) Neutral
131
-
938
1,208
1,353
11.0
12.3
10.8
14.5
12.2
9.1
1.4
1.2
11.9
14.5
0.7
0.6
Competent Automobiles Neutral
151
-
93
1,040
1,137
3.2
3.1
25.7
28.0
5.9
5.4
0.9
0.8
15.0
14.3
0.1
0.1
Nilkamal
Neutral
1,243
-
1,855
1,871
2,031
10.7
10.5
63.2
69.8
19.7
17.8
3.2
2.8
17.6
16.6
1.0
0.9
Visaka Industries
Buy
121
143
192
1,020
1,120
8.7
9.1
13.9
20.1
8.7
6.0
0.6
0.5
6.4
8.7
0.4
0.4
Transport Corporation of
Neutral
264
-
2,010
2,830
3,350
8.8
9.0
14.4
18.3
18.4
14.4
2.8
2.5
15.4
17.1
0.8
0.7
India
Elecon Engineering
Neutral
64
-
694
1,359
1,482
10.3
13.7
0.8
3.9
79.3
16.4
1.3
1.3
1.6
7.8
0.9
0.8
Surya Roshni
Buy
150
201
656
2,992
3,223
8.1
8.4
14.7
18.3
10.2
8.2
1.0
0.9
9.7
11.0
0.5
0.5
MT Educare
Neutral
166
-
660
286
366
18.3
17.7
7.7
9.4
21.5
17.7
4.5
4.0
20.2
21.1
2.2
1.7
Radico Khaitan
Buy
90
156
1,191
1,517
1,635
12.7
13.4
5.8
7.1
15.4
12.6
1.3
1.2
8.6
9.6
1.3
1.2
Garware Wall Ropes
Buy
353
473
773
862
974
11.2
11.2
24.9
29.6
14.2
12.0
2.1
1.8
15.1
15.4
0.9
0.8
Wonderla Holidays
Neutral
381
-
2,151
206
308
44.0
43.6
9.0
12.9
42.3
29.5
5.8
5.2
13.7
17.8
10.3
6.9
Linc Pen & Plastics
Neutral
191
-
283
340
371
8.3
8.9
10.8
13.2
17.7
14.5
2.8
2.5
16.0
17.1
0.9
0.8
The Byke Hospitality
Neutral
153
-
612
222
287
20.5
20.5
5.6
7.6
27.1
20.2
5.1
4.2
18.9
20.8
2.8
2.2
Interglobe Aviation
Neutral
1,059
-
38,169
17,022
21,122
20.7
14.5
63.9
53.7
16.6
19.7
24.8
20.4
149.9
103.2
2.3
1.8
Coffee Day Enterprises
Neutral
262
-
5,391
2,692
2,964
17.0
18.6
-
4.7
-
55.2
3.2
3.0
0.2
5.5
2.4
2.2
Ltd
Navneet Education
Neutral
89
-
2,126
998
1,062
24.1
24.0
5.8
6.1
15.5
14.7
3.4
3.0
22.0
20.6
2.2
2.1
Navkar Corporation
Buy
182
265
2,591
365
436
38.3
37.5
5.6
5.9
32.2
30.9
2.0
1.9
6.3
6.1
7.9
6.8
UFO Moviez
Neutral
515
-
1,416
558
619
32.0
33.2
22.5
30.0
22.9
17.2
2.8
2.4
12.0
13.8
2.4
2.0
VRL Logistics
Neutral
400
-
3,645
1,725
1,902
16.5
16.7
12.2
14.6
32.8
27.4
6.8
6.0
20.8
21.9
2.3
2.0
Team Lease Serv.
Neutral
942
-
1,611
2,565
3,229
1.3
1.5
15.2
22.8
62.1
41.4
5.0
4.4
8.0
10.7
0.5
0.4
Stock Watch
May 04, 2016
Company Name
Reco
CMP
Target Mkt Cap
Sales ( Čcr )
OPM(%)
EPS (Č)
PER(x)
P/BV(x)
RoE(%)
EV/Sales(x)
(Č)
Price ( Č)
( Č cr )
FY16E FY17E FY16E FY17E FY16E FY17E FY16E FY17E FY16E FY17E FY16E FY17E FY16E FY17E
zOthers
S H Kelkar & Co.
Neutral
227
-
3,282
928
1,036
15.3
15.1
4.9
6.1
46.0
37.2
4.3
4.0
9.4
10.7
3.4
3.0
Quick Heal
Neutral
265
-
1,859
339
408
27.8
27.3
7.1
7.7
37.5
34.3
3.2
3.2
8.5
9.3
4.4
3.7
Narayana Hrudaya
Neutral
297
-
6,060
1,603
1,873
10.9
11.5
1.0
2.6
311.3
112.1
7.5
6.9
2.4
6.1
3.9
3.3
Manpasand Bever.
Neutral
530
-
2,652
540
836
19.9
19.6
10.2
16.9
51.7
31.4
4.2
3.8
8.1
12.0
4.6
2.9
Source: Company, Angel Research; Note: *December year end; #September year end; &October year end; Price as on May 03, 2016
Market Outlook
May 04, 2016
Research Team Tel: 022 - 39357800
DISCLAIMER
Angel Broking Private Limited (hereinafter referred to as “Angel”) is a registered Member of National Stock Exchange of India Limited,
Bombay Stock Exchange Limited and Metropolitian Stock Exchange of India Limited. It is also registered as a Depository Participant with
CDSL and Portfolio Manager with SEBI. It also has registration with AMFI as a Mutual Fund Distributor. Angel Broking Private Limited is a
registered entity with SEBI for Research Analyst in terms of SEBI (Research Analyst) Regulations, 2014 vide registration number
INH000000164. Angel or its associates has not been debarred/ suspended by SEBI or any other regulatory authority for accessing
/dealing in securities Market. Angel or its associates including its relatives/analyst do not hold any financial interest/beneficial ownership
of more than 1% in the company covered by Analyst. Angel or its associates/analyst has not received any compensation / managed or co
-managed public offering of securities of the company covered by Analyst during the past twelve months. Angel/analyst has not served as
an officer, director or employee of company covered by Analyst and has not been engaged in market making activity of the company
covered by Analyst.
This document is solely for the personal information of the recipient, and must not be singularly used as the basis of any investment
decision. Nothing in this document should be construed as investment or financial advice. Each recipient of this document should make
such investigations as they deem necessary to arrive at an independent evaluation of an investment in the securities of the companies
referred to in this document (including the merits and risks involved), and should consult their own advisors to determine the merits and
risks of such an investment.
Reports based on technical and derivative analysis center on studying charts of a stock's price movement, outstanding positions and
trading volume, as opposed to focusing on a company's fundamentals and, as such, may not match with a report on a company's
fundamentals.
The information in this document has been printed on the basis of publicly available information, internal data and other reliable sources
believed to be true, but we do not represent that it is accurate or complete and it should not be relied on as such, as this document is for
general guidance only. Angel Broking Pvt. Limited or any of its affiliates/ group companies shall not be in any way responsible for any
loss or damage that may arise to any person from any inadvertent error in the information contained in this report. Angel Broking Pvt.
Limited has not independently verified all the information contained within this document. Accordingly, we cannot testify, nor make any
representation or warranty, express or implied, to the accuracy, contents or data contained within this document. While Angel Broking
Pvt. Limited endeavors to update on a reasonable basis the information discussed in this material, there may be regulatory, compliance,
or other reasons that prevent us from doing so.
This document is being supplied to you solely for your information, and its contents, information or data may not be reproduced,
redistributed or passed on, directly or indirectly.
Neither Angel Broking Pvt. Limited, nor its directors, employees or affiliates shall be liable for any loss or damage that may arise from or
in connection with the use of this information.
Note: Please refer to the important ‘Stock Holding Disclosure' report on the Angel website (Research Section). Also, please refer to the
latest update on respective stocks for the disclosure status in respect of those stocks. Angel Broking Pvt. Limited and its affiliates may have
investment positions in the stocks recommended in this report.