Market Outlook
March 4, 2016
Market Cues
Domestic Indices
Chg (%)
(Pts)
(Close)
Indian markets are expected to open on Positive note tracking SGX Nifty.
BSE Sensex
1.5
364
24,607
Nifty
1.4
107
7,476
US markets finished higher on Thursday following strong economic data released,
Mid Cap
0.6
59
10,110
with eagerly anticipated February jobs data. US data releases showed modestly
Small Cap
1.3
136
10,210
slower services sector activity in Feb and modest increase in industrial orders in Jan.
Initial jobless claims rose slightly last week, but remained at low level. Most of the
Bankex
0.5
85
17,265
commodity and oil linked stocks were higher as prices of copper and some other
industrial commodities rose higher. Among the major gainers in Dow were
Global Indices
Chg (%)
(Pts)
(Close)
Caterpillar (up 3.4%), Transocean (up 10.1%) and Apache (up 7.4%).
Dow Jones
0.3
45
16,944
Glencore, world’s largest copper supplier surged 5.6% to emerge as second best
Nasdaq
0.1
4
4,707
performer on FTSE. Fresh Chinese stimulus has raised hopes of turn-around in
FTSE
(0.3)
(17)
6,130
fortunes of industrial metals, resulting in gains for metal stocks like, Anglo American,
Nikkei
1.3
214
16,960
BHP Billiton, Rio Tinto. Admiral was the biggest gainer in FTSE.
Hang Seng
(0.3)
(62)
19,942
Rally across Indian stocks continued for 3rd consecutive session on Thursday. Hopes
Shanghai Com
0.4
10
2,860
of rate cut and some of the important bills, like GST getting passed in the ongoing
Budget session contributed to the rally. Infra, healthcare, technology, metals, auto
Advances / Declines
BSE
NSE
and select banks stocks led benchmarks higher. Metals stocks topped the rally, with
Vedanta and Tata Steel climbing over 7% and Hindalco gaining 6%.
Advances
1,727
1,257
Declines
925
323
News & Result Analysis
Unchanged
134
42
JSPL in advanced talks with Adani to sell its power unit
Detailed analysis on Pg2
Volumes (` Cr)
Investor’s Ready Reckoner
BSE
2,870
Key Domestic & Global Indicators
NSE
18,721
Stock Watch: Latest investment recommendations on 150+ stocks
Refer Pg4 onwards
Net Inflows (` Cr)
Net
Mtd
Ytd
FII
3,017
3,017
(25,910)
Top Picks
MFs
1,016
5,946
81,343
CMP
Target
Upside
Company
Sector
Rating
(`)
(`)
(%)
Amara Raja Batteries Auto & Auto Ancillary
Buy
870
1,040
19.6
Top Gainers
Price (`)
Chg (%)
HCL Tech
IT
Buy
859
1,038
20.8
Justdial
658
17.9
LIC Housing Finance Financials
Buy
447
592
32.5
Jubilant
370
16.0
Bharat Electronics
Capital Goods
Buy
1,075
1,414
31.5
Deltacorp
64
12.8
Navkar Corporation Others
Buy
155
265
71.4
Jindalstel
63
10.2
More Top Picks on Pg3
Natcopharm
479
9.4
Key Upcoming Events
Previous
Consensus
Date
Region
Event Description
Reading
Expectations
Top Losers
Price (`)
Chg (%)
Mar 4 US
Change in Nonfarm Payroll
151.00
195.00
Apollohosp
1,428
(4.9)
US
Unemployment rate
4.90
4.90
Bajajfinsv
1,679
(2.9)
Mar 7 US
Consumer Credit (Jan)
21.27B
18.60B
Sksmicro
520
(2.9)
JPY
GDP (YoY)
-1.4%
6.(
Bajfinance
6,203
(2.7)
Ipcalab
572
(2.6)
As on March 3, 2016
Market Outlook
March 4, 2016
JSPL in advanced talks with Adani to sell its power unit
As per the media reports, Jindal Steel & Power Limited (JSPL) is in advanced
discussions with Adani Group to sell its power generating subsidiary- Jindal Power
(JPL). This transaction, values Power business at ~`18,000-20,000cr. The ongoing
negotiations are expected to end in Q1FY2017.
The proposed sale is aimed to de-leverage the consol. balance sheet and a major
portion of it may be intended to retire the debt of its parent's steel arm.
At FY15-end, Jindal group's consol. debt stood at `45,500cr and if this deal goes
through then debt could reduce by half.
JPL’s financial health in last few years has been deteriorating. From a net profit of
`1,765cr (on sales of `3,040cr) in FY2012, owing to falling merchant tariff rates
and de-allocation of its captive coal mines, JPL reported net loss of `171cr (on a
turnover of `3,228cr) in FY2015.
Jindal Power has an installed capacity of 3,400MW, with a total debt of `5,120cr.
Profitability has been impacted due to coal linkage issues, falling realisation and
no material improvement in the utilization of recently commissioned assets. JPL has
1,000MW power plant (250MW*4) at Raigarh, Chhattisgarh and the second one
at 2,400MW (600MW*4) Tamnar, Chhattisgarh. JSPL has another 1,649MW of
captive units in Chhattisgarh and Odisha. This transaction values the transaction at
`5.2-5.7cr/MW, which is attractive, given that the assets are ready.
Power assets of JPL have been impacted owing to supply chain inefficiencies, and
current lower merchant rates. In such a scenario, this divestment if happens would
be a positive development for JSPL, as it would lower their balance sheet leverage.
Economic and Political News
Slow-down hits non-major ports as cargo volumes drop
Centre mulls advance transfer of kerosene subsidy under DBTK
Services PMI cools to 3-month low, rate cut hopes brighten
Budgetary allocations for PSUs squeezed in 2016-17
Panel for over 70% reduction in Bt cotton licence fee for 2016
Corporate News
Central bank switches `37,300cr of bonds for longer security
HDFC to raise `1,000cr for refinancing needs
RIL may miss fuel outlet deadline
M&M Fin Serv to raise `500cr via retail bonds
Market Outlook
March 4, 2016
Top Picks ★★★★★
Large Cap
Market Cap
CMP
Target
Upside
Company
Rationale
(` Cr)
(`)
(`)
(%)
To outpace battery industry growth due to better technological
Amara Raja Batteries
14,855
870
1,040
19.6
products leading to market share gains in both the automotive
OEM and replacement segments.
Earnings to grow strongly given the MHCV cyclical upturn.
Ashok Leyland
26,723
94
111
18.2
Focus on exports and LCV's provides additional growth
avenue.
Uptick in defense capex by government when coupled with
Bharat Electronics
25,804
1,075
1,414
31.5
BELs strong market positioning, indicate that good times are
ahead for BEL.
The stock is trading at attractive valuations and is factoring all
HCL Tech
121,122
859
1,038
20.8
the bad news.
Strong visibility for a robust 20% earnings trajectory, coupled
HDFC Bank
256,108
1,014
1,262
24.5
with high quality of earnings on account of high quality retail
business and strategic focus on highly rated corporates.
Back on the growth trend, expect a long term growth of 14%
Infosys
268,547
1,169
1,347
15.2
to be a US$20bn in FY2020.
LICHF continues to grow its retail loan book at a healthy pace
with improvement in asset quality. We expect the company to
LIC Housing Finance
22,543
447
592
32.5
post a healthy loan book which is likely to reflect in a strong
earnings growth.
Huge bid pipeline of re-development works at Delhi and other
NBCC
11,099
925
1,089
17.7
State Governments and opportunity from Smart City, positions
NBCC to report strong growth, going forward.
New launches to enable outpace industry growth; margins
TVS Motors
13,633
287
330
15.0
expansion to boost earnings.
Source: Company, Angel Research
Mid Cap
Market Cap
CMP
Target
Upside
Company
Rationale
(` Cr)
(`)
(`)
(%)
Favourable outlook for the AC industry to augur well for
Cooling products business which is out pacing the market
Blue Star
3,032
337
439
30.2
growth. EMPPAC division's profitability to improve once
operating environment turns around.
Economic recovery to have favourable impact on advertising &
circulation revenue growth. Further, the acquisition of a radio
Jagran Prakashan
5,190
159
189
19.1
business (Radio City) would also boost the company's revenue
growth.
Massive capacity expansion along with rail advantage at ICD
Navkar Corporation
2,205
155
265
71.4
as well CFS augurs well for the company
Earnings boost on back of stable material prices and
Radico Khaitan
1,362
102
156
52.4
favourable pricing environment. Valuation discount to peers
provides additional comfort
Strong brands and distribution network would boost growth
Siyaram Silk Mills
918
980
1,354
38.2
going ahead. Stock currently trades at an inexpensive
valuation.
Source: Company, Angel Research
Market Outlook
March 4, 2016
Macro watch
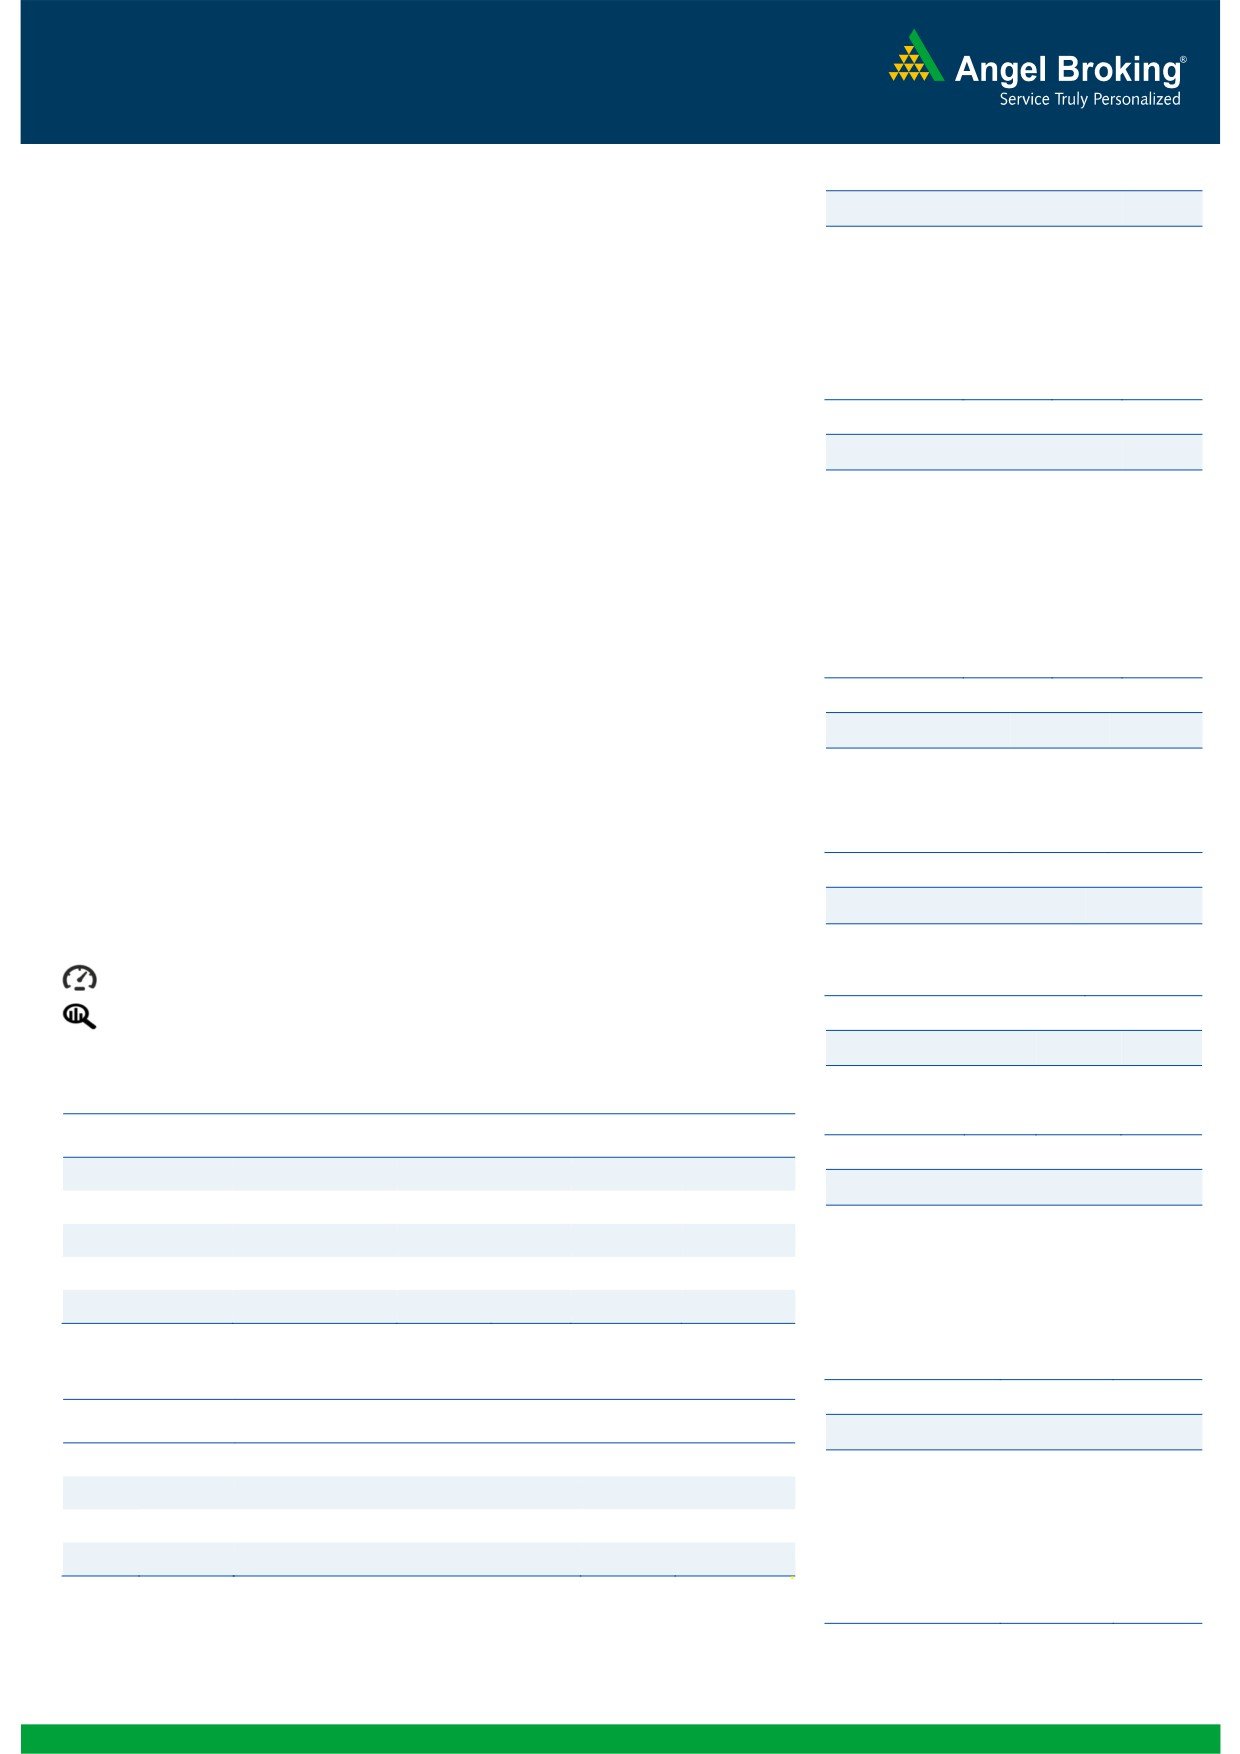
Exhibit 1: Quarterly GDP trends
Exhibit 2: IIP trends
(%)
(%)
9.0
12.0
8.3
9.9
7.8
7.6
7.7
10.0
8.0
7.5
7.3
8.0
6.3
6.7
6.6
6.7
7.0
6.4
4.8
6.0
4.2
4.3
3.7
5.8
3.0
4.0
2.5
2.5
6.0
2.0
5.0
4.5
-
4.0
(2.0)
(1.3)
(4.0)
3.0
(3.4)
(6.0)
Source: CSO, Angel Research
Source: MOSPI, Angel Research
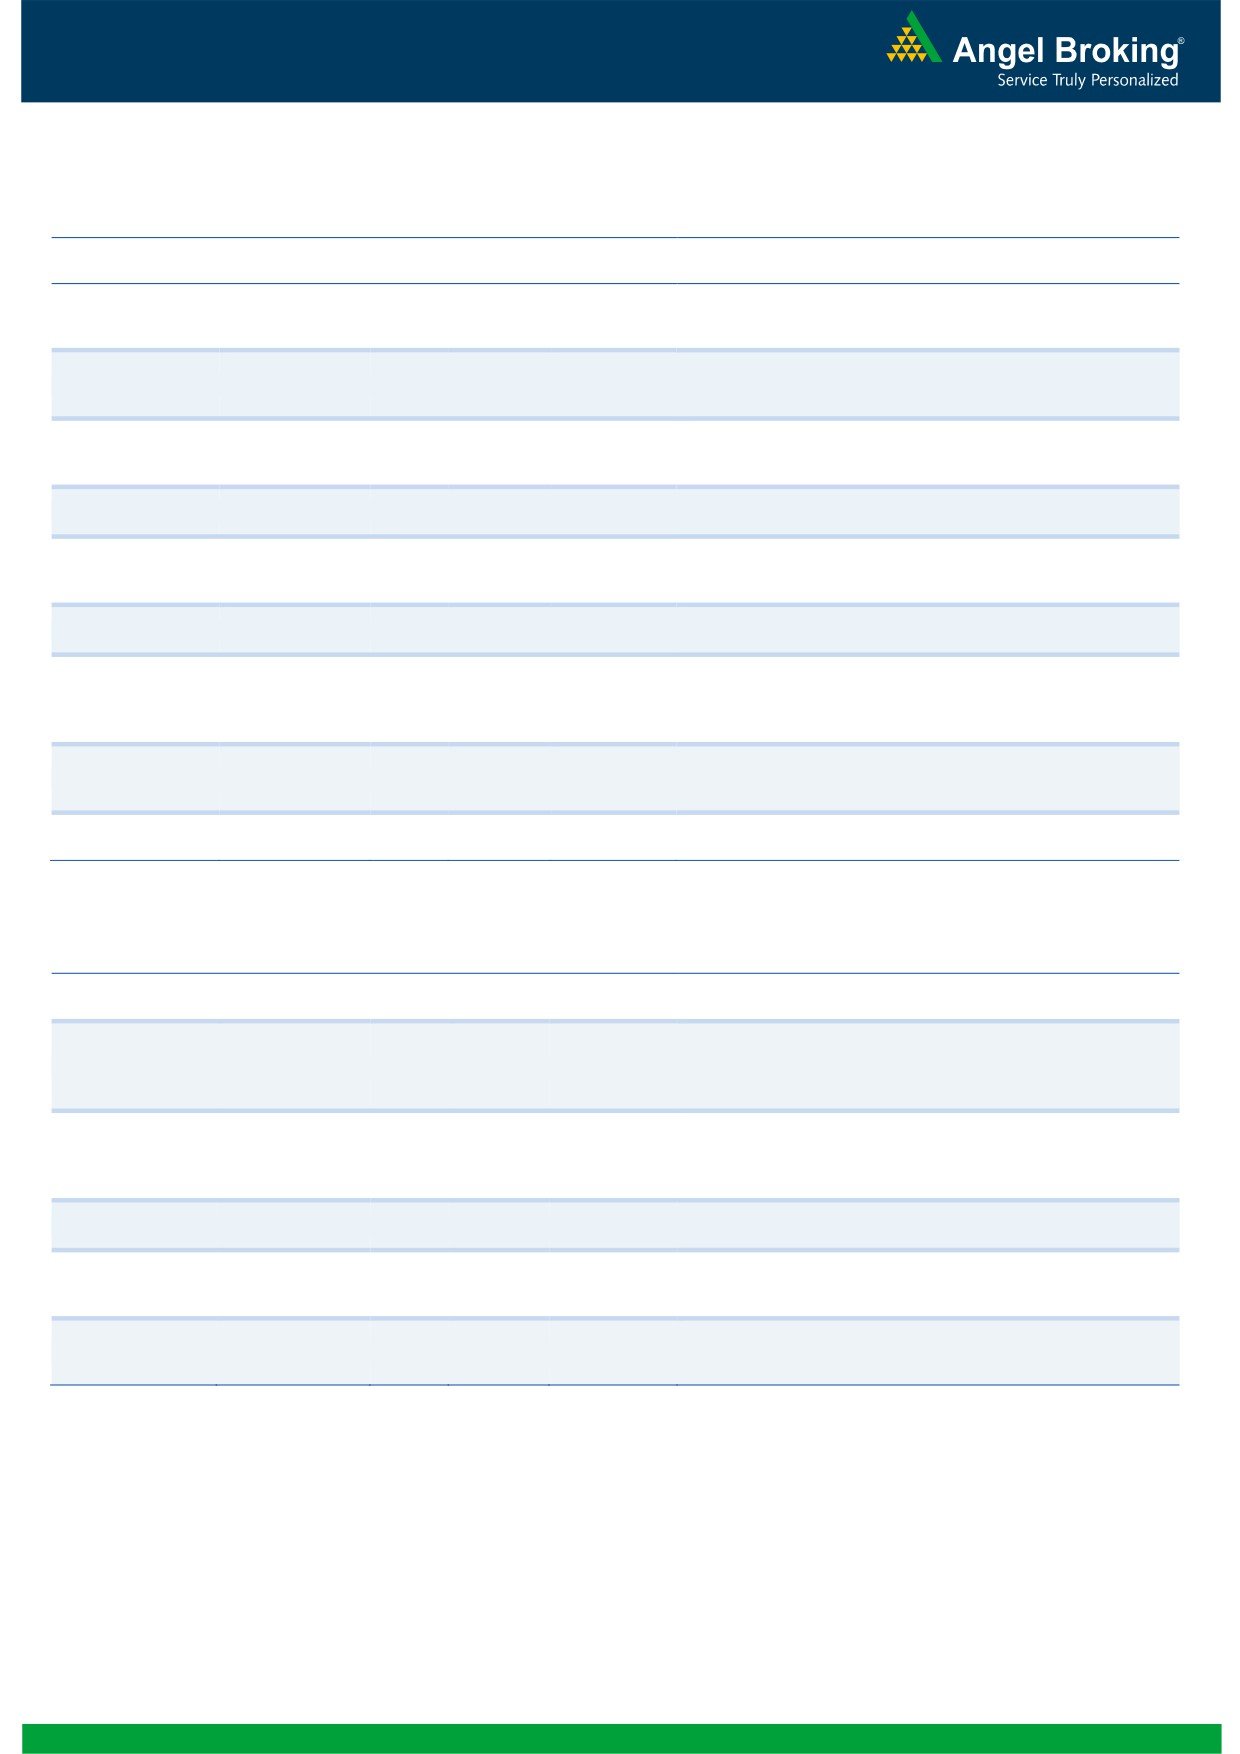
Exhibit 3: Monthly CPI inflation trends
Exhibit 4: Manufacturing and services PMI
Mfg. PMI
Services PMI
(%)
56.0
5.6
5.7
6.0
5.4
5.4
5.4
5.3
4.9
5.0
5.0
54.0
5.0
4.4
3.7
3.7
52.0
4.0
50.0
3.0
2.0
48.0
1.0
46.0
-
44.0
Source: MOSPI, Angel Research
Source: Market, Angel Research; Note: Level above 50 indicates expansion
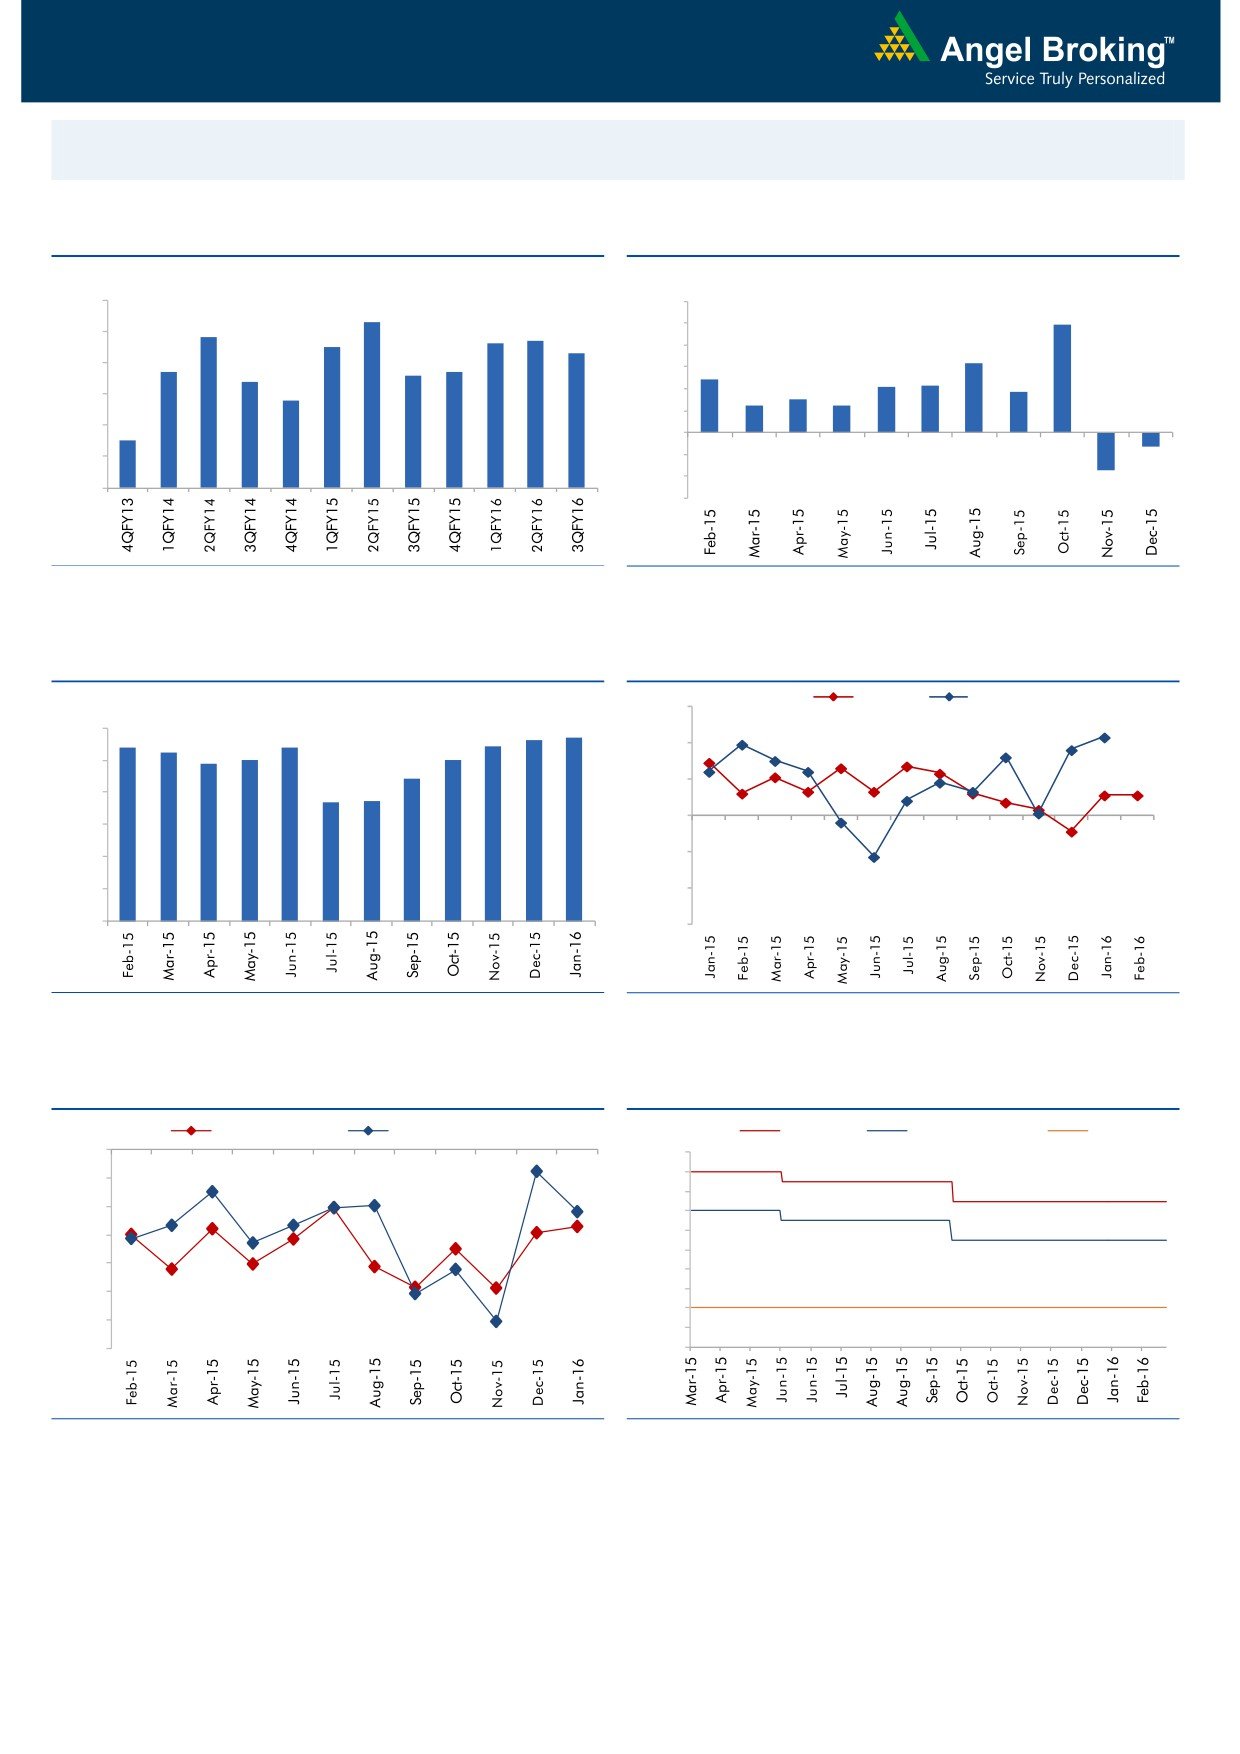
Exhibit 5: Exports and imports growth trends
Exhibit 6: Key policy rates
(%)
Exports yoy growth
Imports yoy growth
(%)
Repo rate
Reverse Repo rate
CRR
0.0
8.00
7.50
(5.0)
7.00
(10.0)
6.50
6.00
(15.0)
5.50
(20.0)
5.00
(25.0)
4.50
4.00
(30.0)
3.50
(35.0)
3.00
Source: Bloomberg, Angel Research
Source: RBI, Angel Research
Market Outlook
March 4, 2016
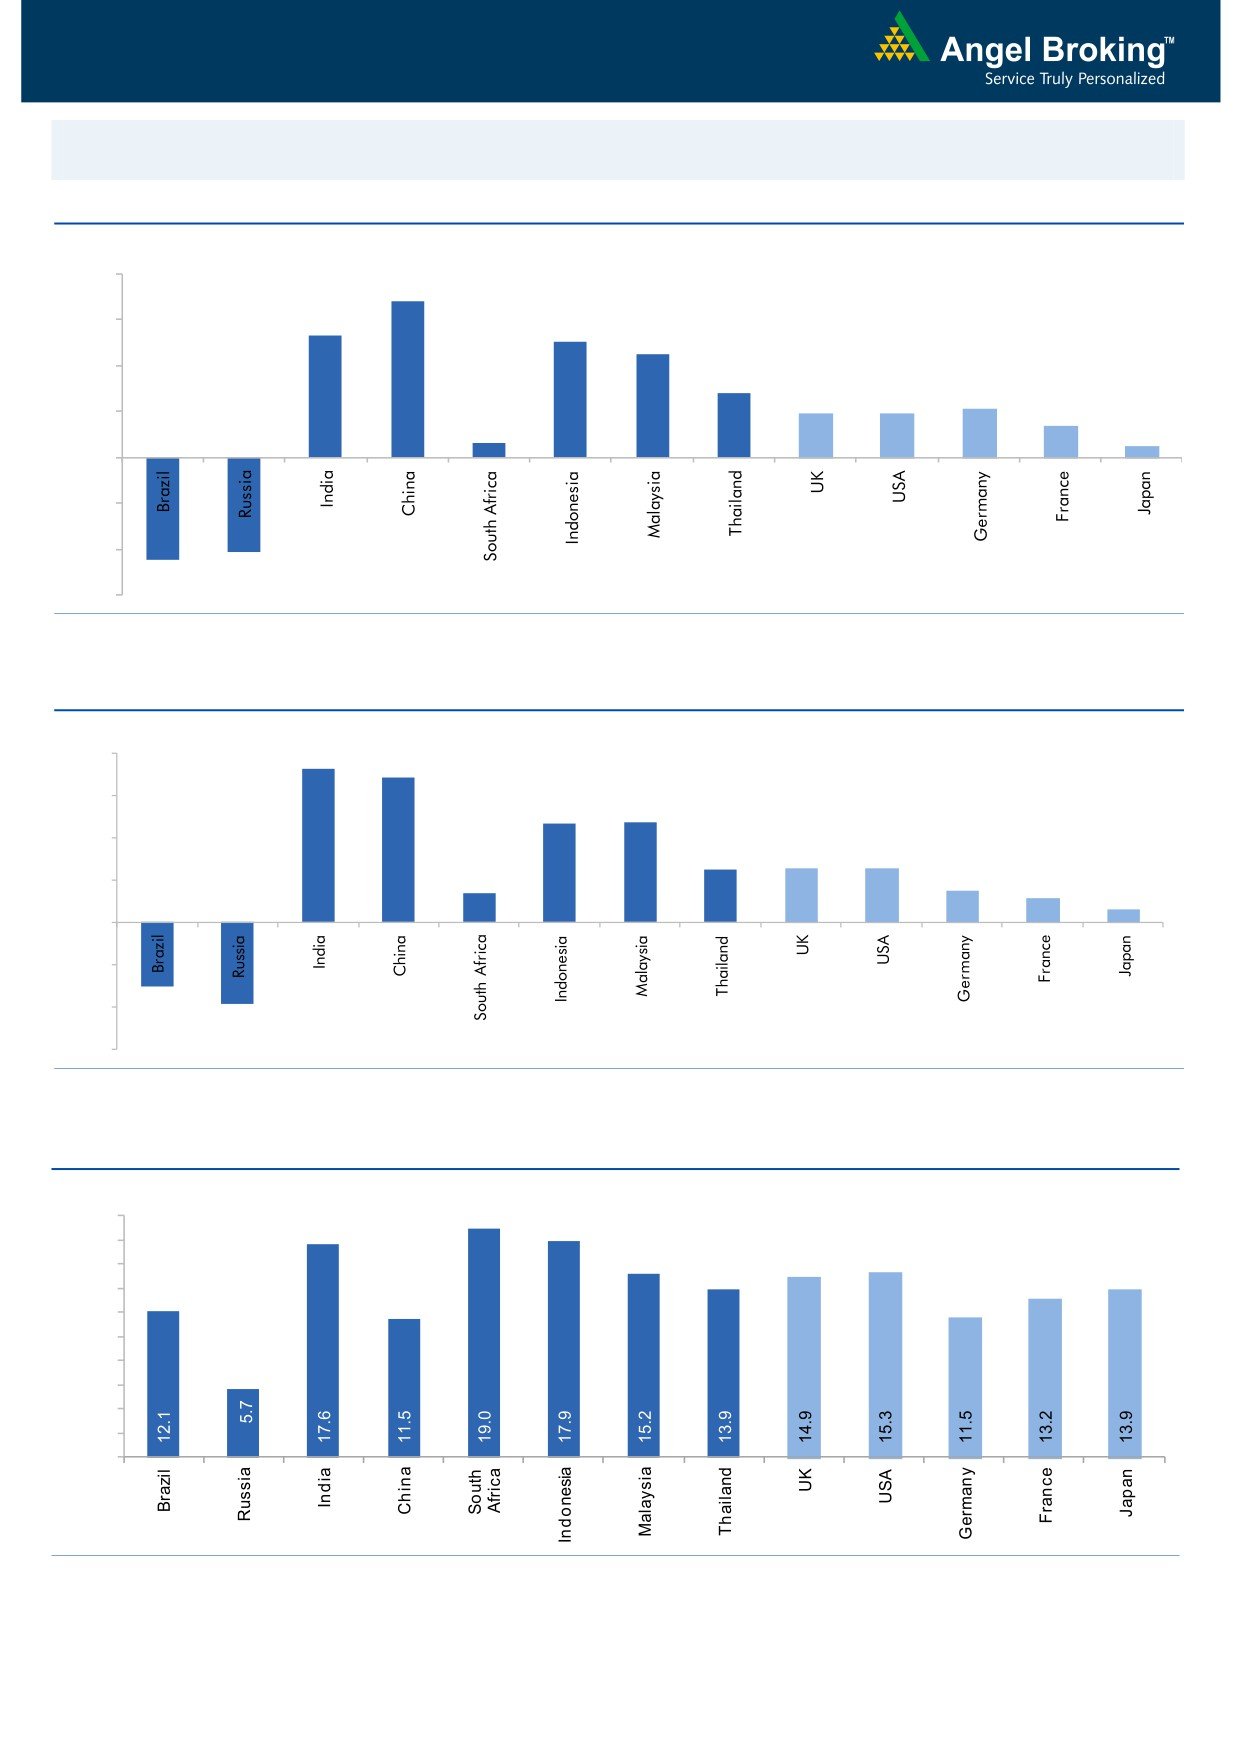
Global watch
Exhibit 1: Latest quarterly GDP Growth (%, yoy) across select developing and developed countries
(%)
8.0
6.8
6.0
5.3
5.0
4.5
4.0
2.8
1.9
1.9
2.1
1.4
2.0
0.6
0.5
-
(2.0)
(4.0)
(4.1)
(4.5)
(6.0)
Source: Bloomberg, Angel Research
Exhibit 2: 2015 GDP Growth projection by IMF (%, yoy) across select developing and developed countries
(%)
8.0
7.3
6.8
6.0
4.7
4.7
4.0
2.5
2.5
2.6
1.4
1.5
2.0
1.2
0.6
-
(2.0)
(3.0)
(4.0)
(3.8)
(6.0)
Source: IMF, Angel Research
Exhibit 3: One year forward P-E ratio across select developing and developed countries
(x)
20.0
18.0
16.0
14.0
12.0
10.0
8.0
6.0
4.0
2.0
-
Source: IMF, Angel Research
Market Outlook
March 4, 2016
Exhibit 4: Relative performance of indices across globe
Returns (%)
Country
Name of index
Closing price
1M
3M
1YR
Brazil
Bovespa
47,193
16.8
0.7
(9.0)
Russia
Micex
1,859
4.8
3.5
2.8
India
Nifty
7,476
0.3
(5.7)
(16.0)
China
Shanghai Composite
2,860
4.2
(17.1)
(11.7)
South Africa
Top 40
45,946
6.9
(0.8)
(1.7)
Mexico
Mexbol
44,742
3.8
1.7
3.3
Indonesia
LQ45
850
7.2
8.1
(9.9)
Malaysia
KLCI
1,688
3.3
0.2
(7.0)
Thailand
SET 50
891
8.4
2.1
(15.8)
USA
Dow Jones
16,944
3.0
(4.4)
(6.6)
UK
FTSE
6,130
3.5
(4.1)
(11.3)
Japan
Nikkei
16,960
(5.1)
(14.7)
(8.8)
Germany
DAX
9,752
1.8
(14.3)
(15.6)
France
CAC
4,416
3.1
(10.0)
(11.6)
Source: Bloomberg, Angel Research
Stock Watch
March 04, 2016
Company Name
Reco
CMP
Target
Mkt Cap
Sales ( Čcr )
OPM(%)
EPS (Č)
PER(x)
P/BV(x)
RoE(%)
EV/Sales(x)
(Č)
Price ( Č)
( Č cr )
FY16E FY17E
FY16E
FY17E
FY16E
FY17E
FY16E
FY17E
FY16E
FY17E
FY16E
FY17E
FY16E
FY17E
Agri / Agri Chemical
Rallis
Neutral
152
-
2,950
2,097
2,415
14.4
14.4
9.5
11.0
16.0
13.8
3.2
2.7
21.1
21.3
1.4
1.2
United Phosphorus
Buy
424
480
18,179
12,500
14,375
18.3
18.3
29.8
35.9
14.2
11.8
2.6
2.2
20.0
20.3
1.4
1.1
Auto & Auto Ancillary
Ashok Leyland
Buy
94
111
26,723
17,995
21,544
11.4
11.6
3.4
4.7
27.6
20.0
4.8
4.5
17.7
22.2
1.3
1.1
Bajaj Auto
Buy
2,279
2,585
65,954
22,709
25,860
20.9
20.1
129.0
143.6
17.7
15.9
5.4
4.7
30.7
29.4
2.3
2.0
Bharat Forge
Buy
827
875
19,246
7,351
8,318
19.9
19.7
31.2
36.5
26.5
22.7
4.7
4.0
19.3
19.2
2.5
2.2
Eicher Motors
Accumulate
19,325
20,044
52,489
15,556
16,747
15.5
17.3
464.8
597.5
41.6
32.3
15.2
11.2
36.2
34.3
3.2
2.9
Gabriel India
Buy
82
101
1,184
1,415
1,544
8.7
9.0
4.6
5.4
17.9
15.3
3.2
2.9
18.1
18.9
0.7
0.7
Hero Motocorp
Accumulate
2,825
2,864
56,407
28,244
30,532
15.5
15.9
156.7
168.5
18.0
16.8
7.2
6.1
39.9
36.4
1.6
1.5
Jamna Auto Industries Buy
134
160
1,072
1,281
1,473
11.2
11.5
7.6
9.2
17.7
14.6
4.5
3.7
25.4
25.2
0.8
0.7
L G Balakrishnan & Bros Neutral
444
-
696
1,254
1,394
11.6
11.8
35.9
41.7
12.4
10.7
1.7
1.5
13.5
13.8
0.6
0.6
Mahindra and Mahindra Accumulate
1,215
1,364
75,484
38,416
42,904
13.7
13.9
54.8
63.4
22.2
19.2
3.4
3.0
15.4
15.8
1.6
1.4
Maruti
Neutral
3,611
-
109,087
57,865
68,104
16.4
16.7
176.3
225.5
20.5
16.0
4.0
3.4
19.4
21.2
1.5
1.2
Minda Industries
Buy
843
1,047
1,337
2,523
2,890
8.7
9.0
55.0
65.4
15.3
12.9
3.0
2.4
19.3
18.7
0.6
0.5
Motherson Sumi
Buy
250
313
33,035
39,343
45,100
8.8
9.1
10.1
12.5
24.7
20.0
7.8
6.1
35.3
34.4
0.8
0.7
Rane Brake Lining
Buy
371
465
294
454
511
11.5
12.0
25.2
31.0
14.7
12.0
2.2
2.0
14.9
16.6
0.7
0.7
Setco Automotive
Neutral
32
-
430
594
741
12.7
13.7
1.7
3.2
18.9
10.1
2.0
1.7
10.4
16.9
1.2
1.0
Tata Motors
Buy
336
371
97,111
259,686
273,957
13.0
13.4
25.9
29.5
13.0
11.4
1.7
1.5
8.0
9.0
0.5
0.5
TVS Motor
Buy
287
330
13,633
11,263
13,122
6.9
8.5
9.2
15.0
31.2
19.1
7.1
5.7
22.7
29.6
1.1
0.9
Amara Raja Batteries
Buy
870
1,040
14,855
4,892
5,871
17.4
17.6
28.8
37.1
30.2
23.4
7.1
5.6
23.4
24.1
2.9
2.4
Exide Industries
Buy
132
162
11,190
6,950
7,784
14.4
14.8
6.6
7.3
20.0
18.0
2.5
2.3
12.6
12.8
1.3
1.2
Apollo Tyres
Buy
166
183
8,447
12,056
12,714
17.2
16.4
23.0
20.3
7.2
8.2
1.3
1.1
17.7
13.6
0.7
0.7
Ceat
Buy
1,085
1,119
4,388
6,041
6,597
14.1
13.7
99.5
111.9
10.9
9.7
2.1
1.8
19.6
18.5
0.8
0.7
JK Tyres
Neutral
82
-
1,855
7,446
7,669
15.2
14.0
19.6
18.4
4.2
4.5
1.1
0.9
25.2
19.5
0.6
0.5
Swaraj Engines
Accumulate
864
919
1,073
552
630
14.2
14.7
44.6
54.1
19.4
16.0
4.5
4.1
23.2
25.6
1.7
1.4
Subros
Neutral
84
-
505
1,293
1,527
11.8
11.9
4.2
6.7
20.1
12.6
1.5
1.4
7.7
11.5
0.7
0.6
Indag Rubber
Neutral
162
-
424
283
329
17.0
17.2
13.0
15.4
12.5
10.5
2.7
2.3
21.8
21.6
1.1
0.9
Capital Goods
ACE
Neutral
38
-
375
660
839
4.7
8.2
1.0
3.9
38.0
9.7
1.2
1.1
3.2
11.3
0.7
0.5
BEML
Buy
1,044
1,157
4,350
3,277
4,006
6.0
8.9
36.2
64.3
28.9
16.2
2.0
1.8
5.7
11.7
1.3
1.0
Bharat Electronics
Buy
1,075
1,414
25,804
7,737
8,634
16.8
17.2
54.0
61.5
19.9
17.5
2.8
2.5
39.3
45.6
2.3
1.9
Stock Watch
March 04, 2016
Company Name
Reco
CMP
Target
Mkt Cap
Sales ( Čcr )
OPM(%)
EPS (Č)
PER(x)
P/BV(x)
RoE(%)
EV/Sales(x)
(Č)
Price ( Č)
( Č cr )
FY16E
FY17E
FY16E
FY17E
FY16E
FY17E
FY16E
FY17E
FY16E
FY17E
FY16E
FY17E
FY16E
FY17E
Capital Goods
Voltas
Buy
245
353
8,092
5,363
5,963
8.0
9.1
11.0
13.8
22.2
17.7
3.4
3.0
16.2
17.9
1.3
1.2
BGR Energy
Neutral
100
-
721
3,615
3,181
9.5
9.4
16.7
12.4
6.0
8.1
0.6
0.6
10.0
7.0
0.6
0.8
BHEL
Neutral
103
-
25,235
33,722
35,272
10.8
11.7
10.5
14.2
9.8
7.3
0.7
0.7
7.0
9.0
0.7
0.7
Blue Star
Buy
337
439
3,032
3,548
3,977
6.3
6.9
13.7
17.2
24.6
19.7
6.2
4.0
26.1
25.4
0.9
0.8
Crompton Greaves
Neutral
137
-
8,593
13,484
14,687
4.9
6.2
4.5
7.1
30.5
19.3
2.2
2.0
7.2
10.8
0.7
0.7
Greaves Cotton
Neutral
126
-
3,086
1,655
1,755
16.6
16.8
7.4
7.8
17.1
16.2
3.4
3.2
21.1
20.6
1.7
1.6
Inox Wind
Buy
284
458
6,309
4,980
5,943
17.0
17.5
26.6
31.6
10.7
9.0
3.2
2.4
35.0
30.0
1.1
0.9
KEC International
Neutral
115
-
2,955
8,791
9,716
6.1
6.8
5.4
8.2
21.3
14.0
2.1
2.0
10.0
14.0
0.5
0.5
Thermax
Neutral
763
-
9,089
6,413
7,525
7.4
8.5
30.5
39.3
25.0
19.4
3.9
3.4
15.0
17.0
1.4
1.1
Cement
ACC
Neutral
1,254
-
23,543
13,151
14,757
16.4
18.3
63.9
83.4
19.6
15.0
2.5
2.3
13.3
16.1
1.5
1.3
Ambuja Cements
Neutral
200
-
31,022
11,564
12,556
19.4
20.7
8.9
10.1
22.5
19.8
2.8
2.7
12.8
13.8
2.2
2.0
HeidelbergCement
Neutral
66
-
1,499
1,772
1,926
13.3
15.4
1.0
3.0
66.2
22.1
1.7
1.6
2.6
7.9
1.4
1.2
India Cements
Neutral
74
-
2,279
4,216
4,840
18.0
19.5
4.0
9.9
18.6
7.5
0.7
0.7
4.0
9.5
0.8
0.6
JK Cement
Buy
551
605
3,849
3,661
4,742
10.1
15.8
7.5
28.5
73.4
19.3
2.2
2.0
7.5
22.9
1.4
1.0
J K Lakshmi Cement
Neutral
289
-
3,397
2,947
3,616
16.7
19.9
11.5
27.2
25.1
10.6
2.4
2.1
9.8
20.8
1.5
1.2
Mangalam Cements
Neutral
186
-
497
1,053
1,347
10.5
13.3
8.4
26.0
22.2
7.2
0.9
0.9
4.3
12.5
0.8
0.6
Orient Cement
Neutral
136
-
2,792
1,854
2,524
21.2
22.2
7.7
11.1
17.7
12.3
2.5
2.2
13.3
15.7
2.3
1.6
Ramco Cements
Neutral
375
-
8,921
4,036
4,545
20.8
21.3
15.1
18.8
24.8
19.9
3.0
2.7
12.9
14.3
2.6
2.3
Shree Cement^
Neutral
11,239
-
39,152
7,150
8,742
26.7
28.6
228.0
345.5
49.3
32.5
7.3
6.1
15.7
20.3
4.7
3.7
UltraTech Cement
Accumulate
2,954
3,107
81,063
24,669
29,265
18.2
20.6
82.0
120.0
36.0
24.6
3.9
3.4
11.3
14.7
3.1
2.7
Construction
ITNL
Neutral
73
-
2,395
7,360
8,825
34.0
35.9
7.0
9.0
10.4
8.1
0.4
0.3
3.2
3.7
3.7
3.6
KNR Constructions
Buy
505
603
1,419
937
1,470
14.3
14.0
44.2
38.6
11.4
13.1
2.3
2.0
15.4
15.4
1.5
1.0
Larsen & Toubro
Buy
1,206
1,310
112,350
58,870
65,708
8.3
10.3
42.0
53.0
28.7
22.8
2.0
1.8
8.8
11.2
1.9
1.7
Gujarat Pipavav Port
Neutral
155
-
7,508
629
684
51.0
52.2
6.4
5.9
24.3
26.3
3.2
2.9
15.9
12.7
11.0
9.9
MBL Infrastructures
Buy
137
285
568
2,313
2,797
12.2
14.6
19.0
20.0
7.2
6.9
0.8
0.7
11.3
10.6
0.9
0.8
Nagarjuna Const.
Neutral
72
-
3,986
7,892
8,842
8.8
9.1
3.0
5.3
23.9
13.5
1.2
1.1
5.0
8.5
0.7
0.6
PNC Infratech
Buy
478
558
2,453
1,873
2,288
13.2
13.5
24.0
32.0
19.9
14.9
1.9
1.7
12.1
12.3
1.4
1.2
Simplex Infra
Neutral
218
-
1,078
5,955
6,829
10.3
10.5
16.0
31.0
13.6
7.0
0.7
0.7
5.3
9.9
0.7
0.6
Power Mech Projects
Neutral
572
-
841
1,539
1,801
12.8
12.7
59.0
72.1
9.7
7.9
1.5
1.2
18.6
16.8
0.6
0.5
Stock Watch
March 04, 2016
Company Name
Reco
CMP
Target
Mkt Cap
Sales ( Čcr )
OPM(%)
EPS (Č)
PER(x)
P/BV(x)
RoE(%)
EV/Sales(x)
(Č)
Price ( Č)
( Č cr )
FY16E
FY17E
FY16E
FY17E
FY16E
FY17E
FY16E
FY17E
FY16E
FY17E
FY16E
FY17E
FY16E
FY17E
Construction
Sadbhav Engineering
Buy
247
289
4,239
3,481
4,219
10.7
10.8
8.2
11.7
30.1
21.1
2.9
2.5
10.3
13.5
1.3
1.1
NBCC
Buy
925
1,089
11,099
5,816
7,382
6.9
7.7
29.6
39.8
31.3
23.2
5.6
4.4
24.1
26.7
1.5
1.2
MEP Infra
Neutral
41
-
667
1,956
1,876
28.1
30.5
1.3
3.0
31.5
13.7
6.6
4.5
21.2
32.8
1.7
1.7
SIPL
Neutral
94
-
3,297
675
1,042
62.4
64.7
-
-
3.5
4.0
-
-
15.7
10.6
Financials
Allahabad Bank
Neutral
48
-
2,898
8,569
9,392
2.8
2.9
16.3
27.5
3.0
1.8
0.3
0.2
7.6
11.9
-
-
Axis Bank
Buy
417
494
99,232
26,473
31,527
3.5
3.6
35.7
43.5
11.7
9.6
2.0
1.7
17.9
18.9
-
-
Bank of Baroda
Neutral
145
-
33,445
18,485
21,025
1.9
2.0
13.5
21.1
10.8
6.9
0.9
0.8
7.3
10.6
-
-
Bank of India
Neutral
93
-
7,539
15,972
17,271
1.9
2.0
15.3
33.4
6.1
2.8
0.3
0.2
3.6
7.6
-
-
Canara Bank
Neutral
178
-
9,690
15,441
16,945
2.0
2.1
46.6
70.4
3.8
2.5
0.3
0.3
8.0
11.2
-
-
Dena Bank
Neutral
27
-
1,768
3,440
3,840
2.1
2.3
7.3
10.0
3.8
2.7
0.3
0.2
6.1
7.9
-
-
Federal Bank
Neutral
49
-
8,494
3,477
3,999
3.0
3.0
5.0
6.2
9.9
7.9
1.0
0.9
10.6
11.9
-
-
HDFC
Neutral
1,124
-
177,454
10,358
11,852
3.3
3.3
41.1
47.0
27.4
23.9
5.2
4.7
24.7
24.9
-
-
HDFC Bank
Buy
1,014
1,262
256,108
38,309
47,302
4.3
4.3
49.3
61.1
20.6
16.6
3.6
3.1
18.5
19.7
-
-
ICICI Bank
Buy
218
254
126,667
34,279
39,262
3.3
3.3
21.0
24.4
10.4
8.9
1.8
1.5
14.4
14.7
-
-
IDBI Bank
Neutral
65
-
12,426
9,625
10,455
1.8
1.8
8.5
14.2
7.7
4.6
0.5
0.4
5.9
9.3
-
-
Indian Bank
Neutral
92
-
4,397
6,160
6,858
2.5
2.5
24.5
29.8
3.7
3.1
0.3
0.3
7.7
8.6
-
-
LIC Housing Finance
Buy
447
592
22,543
3,101
3,745
2.5
2.5
33.0
40.2
13.6
11.1
2.5
2.2
19.7
20.5
-
-
Oriental Bank
Neutral
86
-
2,564
7,643
8,373
2.4
2.4
37.2
45.4
2.3
1.9
0.2
0.2
8.2
9.4
-
-
Punjab Natl.Bank
Neutral
79
-
15,532
23,638
26,557
2.8
2.8
17.9
27.2
4.4
2.9
0.4
0.4
8.5
12.0
-
-
South Ind.Bank
Neutral
18
-
2,397
1,965
2,185
2.5
2.5
2.5
3.3
7.1
5.4
0.7
0.6
9.5
11.7
-
-
St Bk of India
Accumulate
183
177
141,671
79,958
86,061
2.6
2.6
13.4
20.7
13.6
8.8
1.1
1.0
11.5
12.8
-
-
Union Bank
Neutral
121
-
8,328
12,646
14,129
2.3
2.4
31.0
39.1
3.9
3.1
0.4
0.4
9.8
11.4
-
-
Vijaya Bank
Neutral
33
-
2,835
3,536
3,827
1.9
1.9
5.5
6.7
6.0
5.0
0.5
0.4
7.8
8.8
-
-
Yes Bank
Accumulate
757
767
31,820
7,190
9,011
3.2
3.3
58.2
69.7
13.0
10.9
2.3
2.0
19.2
19.6
-
-
FMCG
Asian Paints
Neutral
880
-
84,419
16,553
19,160
16.0
16.2
17.7
21.5
49.8
40.9
13.2
11.9
29.4
31.2
4.8
4.1
Britannia
Neutral
2,840
-
34,072
8,481
9,795
14.0
14.1
65.5
78.3
43.4
36.3
20.5
16.8
38.3
41.2
3.8
3.3
Colgate
Neutral
836
-
22,733
4,836
5,490
19.5
19.7
48.5
53.2
17.2
15.7
12.6
11.0
99.8
97.5
4.5
4.0
Dabur India
Accumulate
245
267
43,152
9,370
10,265
17.1
17.2
7.3
8.1
33.4
30.3
10.1
8.2
33.7
30.6
4.4
4.0
GlaxoSmith Con*
Accumulate
5,623
6,118
23,647
4,919
5,742
17.2
17.4
168.3
191.2
33.4
29.4
9.5
8.1
28.8
28.9
4.3
3.7
Stock Watch
March 04, 2016
Company Name
Reco
CMP
Target
Mkt Cap
Sales ( Čcr )
OPM(%)
EPS (Č)
PER(x)
P/BV(x)
RoE(%)
EV/Sales(x)
(Č)
Price ( Č)
( Č cr )
FY16E FY17E
FY16E
FY17E
FY16E
FY17E
FY16E
FY17E
FY16E
FY17E
FY16E
FY17E
FY16E
FY17E
FMCG
Godrej Consumer
Neutral
1,244
-
42,345
10,168
12,886
16.1
16.1
32.1
38.4
38.8
32.4
7.9
7.3
19.7
21.0
4.1
3.2
HUL
Neutral
848
-
183,572
34,940
38,957
17.5
17.7
20.8
24.7
40.8
34.4
45.4
36.3
110.5
114.2
4.9
4.4
ITC
Buy
318
359
255,215
36,804
38,776
37.9
37.9
12.2
12.9
26.0
24.6
7.2
6.4
27.7
25.8
6.0
5.7
Marico
Neutral
239
-
30,783
6,551
7,766
15.7
16.0
10.4
12.5
23.0
19.1
6.7
5.6
33.2
32.4
4.6
3.9
Nestle*
Buy
5,214
6,646
50,266
11,291
12,847
22.2
22.3
158.9
184.6
32.8
28.2
17.2
15.4
55.0
57.3
4.1
3.6
Tata Global
Buy
110
144
6,911
8,635
9,072
9.8
9.9
6.5
7.6
16.9
14.4
1.7
1.6
6.8
7.4
0.7
0.7
IT
HCL Tech^
Buy
859
1,038
121,122
42,038
47,503
21.2
21.5
51.5
57.7
16.7
14.9
3.6
2.8
21.5
18.8
2.3
1.9
Infosys
Buy
1,169
1,347
268,547
61,850
69,981
27.5
27.5
59.4
65.7
19.7
17.8
4.2
3.6
21.2
20.1
3.3
2.8
TCS
Buy
2,377
2,854
468,430
108,487
122,590
28.3
28.5
122.8
138.4
19.4
17.2
7.4
6.7
38.0
38.9
3.6
3.1
Tech Mahindra
Buy
461
530
44,616
26,524
29,177
16.2
17.0
28.8
33.6
16.0
13.7
3.1
2.6
19.3
19.1
1.3
1.1
Wipro
Buy
542
680
133,931
50,808
56,189
23.7
23.8
37.3
40.7
14.5
13.3
2.8
2.5
19.2
17.7
2.0
1.6
Media
D B Corp
Buy
311
356
5,720
2,241
2,495
27.8
27.9
21.8
25.6
14.3
12.2
3.7
3.3
26.7
28.5
2.5
2.2
HT Media
Neutral
80
-
1,855
2,495
2,603
11.2
11.2
7.3
8.6
10.9
9.3
0.9
0.8
7.4
8.1
0.2
0.2
Jagran Prakashan
Buy
159
189
5,190
2,170
2,355
27.2
26.2
8.9
9.9
17.8
16.0
3.7
3.3
20.9
20.5
2.1
2.0
Sun TV Network
Neutral
348
-
13,714
2,779
3,196
70.2
70.5
22.8
27.3
15.3
12.8
3.8
3.4
26.7
28.3
4.3
3.7
Hindustan Media
Neutral
260
-
1,905
920
1,031
20.0
20.0
19.2
20.9
13.5
12.4
2.2
1.9
16.4
15.3
1.6
1.4
Ventures
Metals & Mining
Coal India
Buy
315
380
198,839
76,167
84,130
19.9
22.3
22.4
25.8
14.0
12.2
5.1
4.9
35.5
41.0
1.9
1.7
Hind. Zinc
Accumulate
170
175
71,915
14,641
14,026
50.4
50.4
17.7
16.0
9.6
10.6
1.5
1.3
16.2
13.2
2.2
2.1
Hindalco
Neutral
79
-
16,375
104,356
111,186
8.7
9.5
6.7
11.1
11.8
7.2
0.4
0.4
3.5
5.9
0.7
0.6
JSW Steel
Neutral
1,160
-
28,045
42,308
45,147
16.4
20.7
(10.3)
49.5
23.4
1.3
1.3
(1.0)
5.6
1.7
1.6
NMDC
Neutral
88
-
34,969
8,237
10,893
46.6
44.5
10.0
11.7
8.9
7.6
1.0
0.9
12.5
13.0
3.7
2.8
SAIL
Neutral
40
-
16,376
45,915
53,954
7.2
10.5
1.5
4.4
26.3
9.1
0.4
0.4
2.3
4.1
1.0
0.9
Vedanta
Neutral
84
-
24,889
71,445
81,910
26.2
26.3
12.9
19.2
6.5
4.4
0.5
0.4
7.2
8.9
0.7
0.6
Tata Steel
Neutral
286
-
27,806
126,760
137,307
8.9
11.3
6.4
23.1
45.0
12.4
0.9
0.9
2.0
7.1
0.8
0.7
Oil & Gas
Cairn India
Neutral
130
-
24,345
11,323
12,490
49.4
51.0
20.7
20.7
6.3
6.3
0.4
0.4
6.4
6.1
1.0
0.4
GAIL
Neutral
342
-
43,395
64,856
70,933
9.1
9.6
24.0
28.9
14.3
11.9
1.2
1.1
8.8
9.6
0.8
0.7
ONGC
Neutral
198
-
169,014
154,564
167,321
36.8
37.4
28.6
32.5
6.9
6.1
0.9
0.8
12.7
13.5
1.3
1.2
Petronet LNG
Neutral
250
-
18,773
29,691
31,188
5.8
6.2
12.8
13.4
19.6
18.6
2.9
2.6
15.8
14.8
0.7
0.6
Indian Oil Corp
Buy
395
455
95,783
359,607
402,760
5.9
6.1
42.5
48.7
9.3
8.1
1.2
1.1
14.1
14.4
0.4
0.3
Stock Watch
March 04, 2016
Company Name
Reco
CMP
Target
Mkt Cap
Sales ( Čcr )
OPM(%)
EPS (Č)
PER(x)
P/BV(x)
RoE(%)
EV/Sales(x)
(Č)
Price ( Č)
( Č cr )
FY16E FY17E
FY16E
FY17E
FY16E
FY17E
FY16E
FY17E
FY16E
FY17E
FY16E
FY17E
FY16E
FY17E
Oil & Gas
Reliance Industries
Buy
1,013
1,150
328,006
304,775
344,392
12.6
13.4
91.3
102.6
11.1
9.9
1.3
1.1
11.8
12.0
1.0
0.8
Pharmaceuticals
Alembic Pharma
Neutral
640
-
12,071
3,274
3,802
26.9
19.4
35.0
28.7
18.3
22.3
8.1
6.1
55.6
31.2
3.5
3.0
Aurobindo Pharma
Buy
697
856
40,747
14,923
17,162
22.0
23.0
35.7
42.8
19.5
16.3
5.7
4.3
34.0
30.2
2.9
2.5
Aventis*
Neutral
4,394
-
10,119
2,082
2,371
17.4
20.8
118.2
151.5
37.2
29.0
5.4
4.4
19.9
25.5
4.4
3.7
Cadila Healthcare
Accumulate
333
352
34,080
10,224
11,840
21.0
22.0
14.6
17.6
22.8
18.9
6.3
4.9
30.8
29.0
3.2
2.7
Cipla
Buy
528
605
42,434
13,979
16,447
20.2
18.6
25.7
27.5
20.6
19.2
3.4
2.9
17.6
16.1
3.0
2.5
Dr Reddy's
Buy
3,188
3,933
54,373
16,838
19,575
25.0
23.1
167.5
178.8
19.0
17.8
4.0
3.4
23.1
20.4
3.0
2.5
Dishman Pharma
Neutral
342
-
2,761
1,733
1,906
21.5
21.5
17.0
19.9
20.1
17.2
2.0
1.8
10.5
11.2
1.9
1.6
GSK Pharma*
Neutral
3,188
-
27,003
2,870
3,158
20.0
22.1
59.5
68.3
53.6
46.7
15.8
16.2
28.5
34.3
8.8
8.1
Indoco Remedies
Neutral
276
-
2,543
1,033
1,199
15.9
18.2
9.4
13.6
29.4
20.3
4.4
3.7
15.7
19.7
2.5
2.2
Ipca labs
Buy
572
900
7,221
3,363
3,909
12.9
18.6
13.4
28.0
42.7
20.4
3.1
2.7
7.4
14.0
2.4
2.1
Lupin
Neutral
1,787
-
80,513
13,092
16,561
25.0
27.0
50.4
68.3
35.5
26.2
7.3
5.8
22.8
24.7
5.7
4.4
Sun Pharma
Accumulate
870
950
209,464
28,163
32,610
25.8
30.7
17.4
26.9
50.0
32.4
4.7
4.1
13.0
16.6
6.8
5.6
Power
Tata Power
Neutral
60
-
16,093
35,923
37,402
22.6
22.8
4.1
5.2
14.7
11.6
1.1
1.1
7.5
9.3
1.4
1.3
NTPC
Buy
126
146
104,223
87,271
99,297
23.5
23.5
11.8
13.3
10.8
9.5
1.2
1.1
11.5
12.2
2.2
1.9
Power Grid
Buy
136
170
70,888
20,702
23,361
86.7
86.4
12.1
13.2
11.2
10.3
1.7
1.5
15.6
15.1
8.2
7.7
Telecom
Bharti Airtel
Neutral
333
-
133,293
101,748
109,191
32.1
31.7
12.0
12.5
27.8
26.7
1.9
1.8
6.9
6.7
1.9
1.7
Idea Cellular
Neutral
108
-
38,975
34,282
36,941
32.0
31.5
5.9
6.2
18.4
17.5
1.7
1.5
9.9
9.3
1.7
1.6
zOthers
Abbott India
Neutral
5,086
-
10,808
2,715
3,153
14.5
14.1
134.3
152.2
37.9
33.4
9.5
7.8
27.4
25.6
3.5
2.9
Bajaj Electricals
Buy
174
237
1,751
4,719
5,287
5.2
5.8
8.6
12.7
20.3
13.7
2.3
2.0
11.4
14.8
0.3
0.3
Finolex Cables
Neutral
238
-
3,636
2,520
2,883
12.2
12.0
12.7
14.2
18.8
16.7
2.6
2.3
13.6
13.5
1.2
1.0
Goodyear India*
Buy
479
582
1,105
1,800
1,600
11.7
11.5
58.7
52.9
8.2
9.1
1.8
1.6
24.6
18.7
0.3
0.3
Hitachi
Neutral
1,165
-
3,169
1,779
2,081
7.8
8.8
21.8
33.4
53.5
34.9
8.6
7.0
17.4
22.1
1.6
1.3
Jyothy Laboratories
Neutral
278
-
5,030
1,620
1,847
11.5
11.5
7.3
8.5
38.1
32.8
4.9
4.6
13.3
14.4
2.7
2.3
MRF
Buy
34,049
45,575
14,440
20,316
14,488
21.4
21.1
5,488.0
3,798.0
6.2
9.0
2.1
1.7
41.1
21.2
0.6
0.8
Page Industries
Neutral
10,332
-
11,524
1,929
2,450
19.8
20.1
229.9
299.0
44.9
34.6
19.8
13.8
52.1
47.1
5.7
4.5
Relaxo Footwears
Neutral
415
-
4,976
1,767
2,152
12.3
12.5
19.3
25.1
21.5
16.5
5.3
4.1
27.7
27.8
2.7
2.2
Siyaram Silk Mills
Buy
980
1,354
918
1,636
1,815
11.5
11.5
89.9
104.1
10.9
9.4
1.8
1.6
17.9
17.8
0.7
0.6
Styrolution ABS India*
Neutral
568
-
999
1,271
1,440
8.6
9.2
32.0
41.1
17.7
13.8
1.8
1.6
10.7
12.4
0.7
0.6
Stock Watch
March 04, 2016
Company Name
Reco
CMP
Target
Mkt Cap
Sales ( Čcr )
OPM(%)
EPS (Č)
PER(x)
P/BV(x)
RoE(%)
EV/Sales(x)
(Č)
Price ( Č)
( Č cr )
FY16E
FY17E
FY16E
FY17E
FY16E
FY17E
FY16E
FY17E
FY16E
FY17E
FY16E
FY17E
FY16E
FY17E
zOthers
TVS Srichakra
Buy
2,200
3,217
1,684
2,035
2,252
15.9
15.3
248.6
268.1
8.9
8.2
3.9
2.8
43.6
33.9
0.8
0.7
HSIL
Buy
260
302
1,882
2,123
2,384
16.1
16.5
15.0
18.9
17.3
13.8
1.3
1.3
8.0
9.4
1.2
1.0
Kirloskar Engines India
Neutral
225
-
3,254
2,403
2,554
8.6
9.9
9.2
10.5
24.5
21.5
2.4
2.2
9.7
10.7
0.9
0.8
Ltd
M M Forgings
Buy
428
614
517
511
615
21.7
21.6
43.1
55.8
9.9
7.7
1.8
1.5
19.9
21.2
1.1
0.8
Banco Products (India) Neutral
102
-
728
1,208
1,353
11.0
12.3
10.8
14.5
9.4
7.0
1.1
1.0
11.9
14.5
0.5
0.5
Competent Automobiles Neutral
130
-
80
1,040
1,137
3.2
3.1
25.7
28.0
5.1
4.6
0.8
0.7
15.0
14.3
0.1
0.1
Nilkamal
Neutral
1,064
-
1,587
1,871
2,031
10.7
10.5
63.2
69.8
16.8
15.3
2.7
2.4
17.6
16.6
0.8
0.7
Visaka Industries
Buy
105
144
167
1,086
1,197
9.9
10.3
21.5
28.8
4.9
3.7
0.5
0.4
9.6
11.6
0.4
0.3
Transport Corporation of
Neutral
247
-
1,879
2,830
3,350
8.8
9.0
14.4
18.3
17.2
13.5
2.7
2.3
15.4
17.1
0.7
0.6
India
Elecon Engineering
Neutral
51
-
558
1,359
1,482
10.3
13.7
0.8
3.9
63.8
13.2
1.1
1.0
1.6
7.8
0.7
0.6
Surya Roshni
Buy
134
201
589
2,992
3,223
8.1
8.4
14.7
18.3
9.2
7.3
0.9
0.8
9.7
11.0
0.5
0.4
MT Educare
Neutral
157
-
624
286
366
18.3
17.7
7.7
9.4
20.3
16.7
4.3
3.7
20.2
21.1
1.8
1.4
Radico Khaitan
Buy
102
156
1,362
1,517
1,635
12.7
13.4
5.8
7.1
17.6
14.4
1.5
1.4
8.6
9.6
1.3
1.2
Garware Wall Ropes
Buy
295
473
645
862
974
11.2
11.2
24.9
29.6
11.8
10.0
1.8
1.5
15.1
15.4
0.7
0.6
Wonderla Holidays
Neutral
368
-
2,079
206
308
44.0
43.6
9.0
12.9
40.9
28.5
5.6
5.1
13.7
17.8
9.6
6.4
Linc Pen & Plastics
Accumulate
189
185
279
340
371
8.3
8.9
10.8
13.2
17.5
14.3
2.8
2.4
16.0
17.1
0.8
0.7
The Byke Hospitality
Neutral
157
-
629
222
287
20.5
20.5
5.6
7.6
27.8
20.8
5.2
4.3
18.9
20.8
2.8
2.1
Interglobe Aviation
Neutral
852
-
30,693
17,022
21,122
20.7
14.5
63.9
53.7
13.3
15.9
20.0
16.4
149.9
103.2
1.8
1.4
Coffee Day Enterprises
Neutral
232
-
4,783
2,692
2,964
17.0
18.6
-
4.7
-
49.0
2.8
2.7
0.2
5.5
2.1
2.0
Ltd
Navneet Education
Neutral
81
-
1,921
998
1,062
24.1
24.0
5.8
6.1
14.0
13.2
3.1
2.7
22.0
20.6
2.1
2.0
Navkar Corporation
Buy
155
265
2,205
365
436
38.3
37.5
5.6
5.9
27.4
26.3
1.7
1.6
6.3
6.1
6.7
5.8
Source: Company, Angel Research; Note: *December year end; #September year end; &October year end; Price as on March 03, 2016
Market Outlook
March 04, 2016
Research Team Tel: 022 - 39357800
DISCLAIMER
Angel Broking Private Limited (hereinafter referred to as “Angel”) is a registered Member of National Stock Exchange of India Limited,
Bombay Stock Exchange Limited and Metropolitian Stock Exchange of India Limited. It is also registered as a Depository Participant with
CDSL and Portfolio Manager with SEBI. It also has registration with AMFI as a Mutual Fund Distributor. Angel Broking Private Limited is a
registered entity with SEBI for Research Analyst in terms of SEBI (Research Analyst) Regulations, 2014 vide registration number
INH000000164. Angel or its associates has not been debarred/ suspended by SEBI or any other regulatory authority for accessing
/dealing in securities Market. Angel or its associates including its relatives/analyst do not hold any financial interest/beneficial ownership
of more than 1% in the company covered by Analyst. Angel or its associates/analyst has not received any compensation / managed or co
-managed public offering of securities of the company covered by Analyst during the past twelve months. Angel/analyst has not served as
an officer, director or employee of company covered by Analyst and has not been engaged in market making activity of the company
covered by Analyst.
This document is solely for the personal information of the recipient, and must not be singularly used as the basis of any investment
decision. Nothing in this document should be construed as investment or financial advice. Each recipient of this document should make
such investigations as they deem necessary to arrive at an independent evaluation of an investment in the securities of the companies
referred to in this document (including the merits and risks involved), and should consult their own advisors to determine the merits and
risks of such an investment.
Reports based on technical and derivative analysis center on studying charts of a stock's price movement, outstanding positions and
trading volume, as opposed to focusing on a company's fundamentals and, as such, may not match with a report on a company's
fundamentals.
The information in this document has been printed on the basis of publicly available information, internal data and other reliable sources
believed to be true, but we do not represent that it is accurate or complete and it should not be relied on as such, as this document is for
general guidance only. Angel Broking Pvt. Limited or any of its affiliates/ group companies shall not be in any way responsible for any
loss or damage that may arise to any person from any inadvertent error in the information contained in this report. Angel Broking Pvt.
Limited has not independently verified all the information contained within this document. Accordingly, we cannot testify, nor make any
representation or warranty, express or implied, to the accuracy, contents or data contained within this document. While Angel Broking
Pvt. Limited endeavors to update on a reasonable basis the information discussed in this material, there may be regulatory, compliance,
or other reasons that prevent us from doing so.
This document is being supplied to you solely for your information, and its contents, information or data may not be reproduced,
redistributed or passed on, directly or indirectly.
Neither Angel Broking Pvt. Limited, nor its directors, employees or affiliates shall be liable for any loss or damage that may arise from or
in connection with the use of this information.
Note: Please refer to the important ‘Stock Holding Disclosure' report on the Angel website (Research Section). Also, please refer to the
latest update on respective stocks for the disclosure status in respect of those stocks. Angel Broking Pvt. Limited and its affiliates may have
investment positions in the stocks recommended in this report.