Market Outlook
December 3, 2015
Market Cues
Domestic Indices
Chg (%)
(Pts)
(Close)
Indian markets are expected to open on a negative note tracking the SGX Nifty and
BSE Sensex
(0.2)
(52)
26,118
most Asian markets.
Nifty
(0.3)
(24)
7,931
The U.S. markets ended Wednesday's session in the red. The weakness that
Mid Cap
0.2
22
11,098
emerged on market was partly due to a sharp drop by the price of crude oil. Further,
Small Cap
0.0
1
11,690
concerns about the outlook for monetary policy also weighed on the markets.
Bankex
(1.0)
(204)
19,654
The European markets ended Wednesday's session with mixed results. Trading
action was choppy, as investors have turned nervous ahead of Thursday's
Global Indices
Chg (%)
(Pts)
(Close)
announcement from the European Central Bank. The disappointing Eurozone
inflation data released on Wednesday contributed to those concerns.
Dow Jones
(0.9)
(159)
17,730
Nasdaq
(0.6)
(33)
5,123
The Indian market closed on negative note mainly due to a decline in the banking
shares.
FTSE
0.4
25
6,421
Nikkei
(0.4)
(74)
19,938
News & Result Analysis
Hang Seng
0.4
98
22,480
Aurobindo gets approval for anti-allergy injection
Shanghai Com
2.3
81
3,537
Natco Pharma suspends work at Chennai plant due to flood
Detailed analysis on Pg2
Advances / Declines
BSE
NSE
Investor’s Ready Reckoner
Advances
1,470
752
Key Domestic & Global Indicators
Declines
1,325
761
Stock Watch: Latest investment recommendations on 150+ stocks
Unchanged
142
69
Refer P4 onwards
Top Picks
Volumes (` Cr)
CMP
Target
Upside
Company
Sector
Rating
BSE
3,031
(`)
(`)
(%)
NSE
16,135
Axis Bank
Financials
Buy
459
630
37.1
HCL Tech
IT
Buy
860
1,132
31.7
ICICI Bank
Financials
Buy
270
357
31.9
Net Inflows (` Cr)
Net
Mtd
Ytd
Ashok Leyland
Automobiles
Buy
93
111
19.5
FII
60
-5,651
-20,471
Larsen & Toubro
Construction
Buy
1,354
1,646
21.5
MFs
78
592
56,347
More Top Picks on Pg3
Top Gainers
Price (`)
Chg (%)
Key Upcoming Events
Previous
Consensus
104
10.9
Date
Region
Event Description
Indhotel
Reading
Expectations
563
10.1
Jetairways
Dec 3
UK
Services PMI (Nov)
54.9
55.0
18
7.3
Dec 3
Eurozone
ECB Interest Rate Decision
0.05%
0.05%
Gmrinfra
234
6.8
Dec 3
US
ISM Non-Manufacturing PMI (Nov)
59.1
58.0
Aban
112
5.6
Dec 4
US
Unemployment Rate (Nov)
5%
5%
Jktyre
Top Losers
Price (`)
Chg (%)
289
(4.9)
Tvsmotor
11
(4.3)
Rtnpower
155
(4.2)
Frl
2
(4.0)
Kailash
43
(3.8)
Fsl
As on December 02, 2015
Market Outlook
December 3, 2015
Aurobindo gets approval for anti-allergy injection
Aurobindo Pharma Limited announced that it has received final approval form the
US Food and Drug Administration(USFDA) to manufacture and market
Dexamethasone Sodium Phosphate Injection. The product is expected to be
launched by the fourth quarter of the current financial year.
The drug product is a bio-equivalent equivalent and therapeutically equivalent to
the reference listed drug product of Luitpold Pharmaceuticals Inc. The approved
product has an estimated market size of $ 31 million for the twelve month period
ending September 2015, according to a company press release.
Dexamethasone Sodium Phosphate injection is used in the treatment of various
conditions including allergic reactions, arthritiis among other diseases.
Aurobindo now has 17 abbreviated new drug applications(ANDAs) approved out
of Unit IV formulation facility in Hyderabad for manufacturing general injectable
products. The company now has a total of 220 ANDA approvals, including 192
final approvals, from the USFDA.
Natco Pharma suspends work at Chennai plant due to flood
Drug firm Natco Pharma said its active pharmaceuticals ingredient plant at
Chennai has suspended operations due to flooding caused by rains.
The company's "wholly owned subsidiary's active pharmaceuticals ingredient (API)
plant has temporarily suspended operations due to folding caused by incessant
rains in the plant area.
The unit manufactures few oncology related API's at the plant. The company
believes that this temporary shutdown should not impact or impair its pipeline
launches from the plant.
Economic and Political News
RBI to buy up to `10,000 crores of govt bonds via OMO on Dec 7
Govt says no plan to disinvest in BSNL, MTNL
Gold imports 528 tonnes worth `1.12 lakh crore in April-September
Corporate News
Coal India production jumps 8.8% to 321 mn tonnes in Apr-Nov
Tata Steel Singapore arm executes $1.5 bn pacts to refinance debt
Coal India 's 3.25 MT capacity project in Maharashtra to start by month-end
Market Outlook
December 3, 2015
Top Picks ★★★★★
Large Cap
Market Cap
CMP
Target
Upside
Company
Rationale
(` Cr)
(`)
(`)
(%)
To outpace battery industry growth due to better technological
Amara Raja Batteries
14,991
878
1,040
18.5
products leading to market share gains in both the automotive
OEM and replacement segments.
Earnings to grow strongly given the MHCV cyclical upturn.
Ashok Leyland
26,424
93
111
19.5
Focus on exports and LCV's provides additional growth
avenue.
Healthy pace of branch expansion, backed by distribution
Axis Bank
1,09,191
459
630
37.1
network, will be the driving force for the bank’s retail business
and overall earnings.
The stock is trading at attractive valuations and is factoring all
HCL Tech
1,20,871
860
1,132
31.7
the bad news.
Strong visibility for a robust 20% earnings trajectory, coupled
HDFC Bank
2,70,744
1,075
1,262
17.4
with high quality of earnings on account of high quality retail
business and strategic focus on highly rated corporates.
Due to its robust franchise and capital adequacy position, the
bank is well positioned to grow by at least a few percentage
ICICI Bank
1,56,982
270
357
31.9
points higher than the average industry growth rate from a
structural point of view.
Back on the growth trend, expect a long term growth of 14%
Infosys
2,43,522
1,060
1,306
23.2
to be a US$20bn in FY2020.
Well positioned to benefit from such expected gradual
recovery in the overall domestic capex cycle, given its presence
Larsen & Toubro
1,26,030
1,354
1,646
21.5
across various infrastructure segments, its execution
capabilities, and its strong balance sheet.
LICHF continues to grow its retail loan book at a healthy pace
with improvement in asset quality. We expect the company to
LIC Housing Finance
24,176
479
571
19.2
post a healthy loan book which is likely to reflect in a strong
earnings growth.
Source: Company, Angel Research
Mid Cap
Market Cap
CMP
Target
Upside
Company
Rationale
(` Cr)
(`)
(`)
(%)
Government thrust on Renewable sector and strong order
Inox Wind
8,036
362
505
39.5
book would drive future growth.
Change in business focus towards high-margin chronic and
Ipca labs
9,711
770
900
16.9
lifestyle segments and increasing penetration in Europe and
US
Economic recovery to have favourable impact on advertising &
circulation revenue growth. Further, the acquisition of a radio
Jagran Prakashan
5,059
155
169
9.2
business (Radio City) would also boost the company's revenue
growth.
Strong brand & quality teaching with innovative technologies &
MT Educare
548
138
169
22.7
higher government educational spending to boost growth
Earnings boost on back of stable material prices and
Radico Khaitan
1,499
113
156
38.5
favourable pricing environment. Valuation discount to peers
provides additional comfort
Strong brands and distribution network would boost growth
Siyaram Silk Mills
894
954
1,145
20.1
going ahead. Stock currently trades at an inexpensive
valuation.
Structural shift in the Lighting industry towards LED lighting will
Surya Roshni
607
138
183
32.2
drive growth.
Source: Company, Angel Research
Market Outlook
December 3, 2015
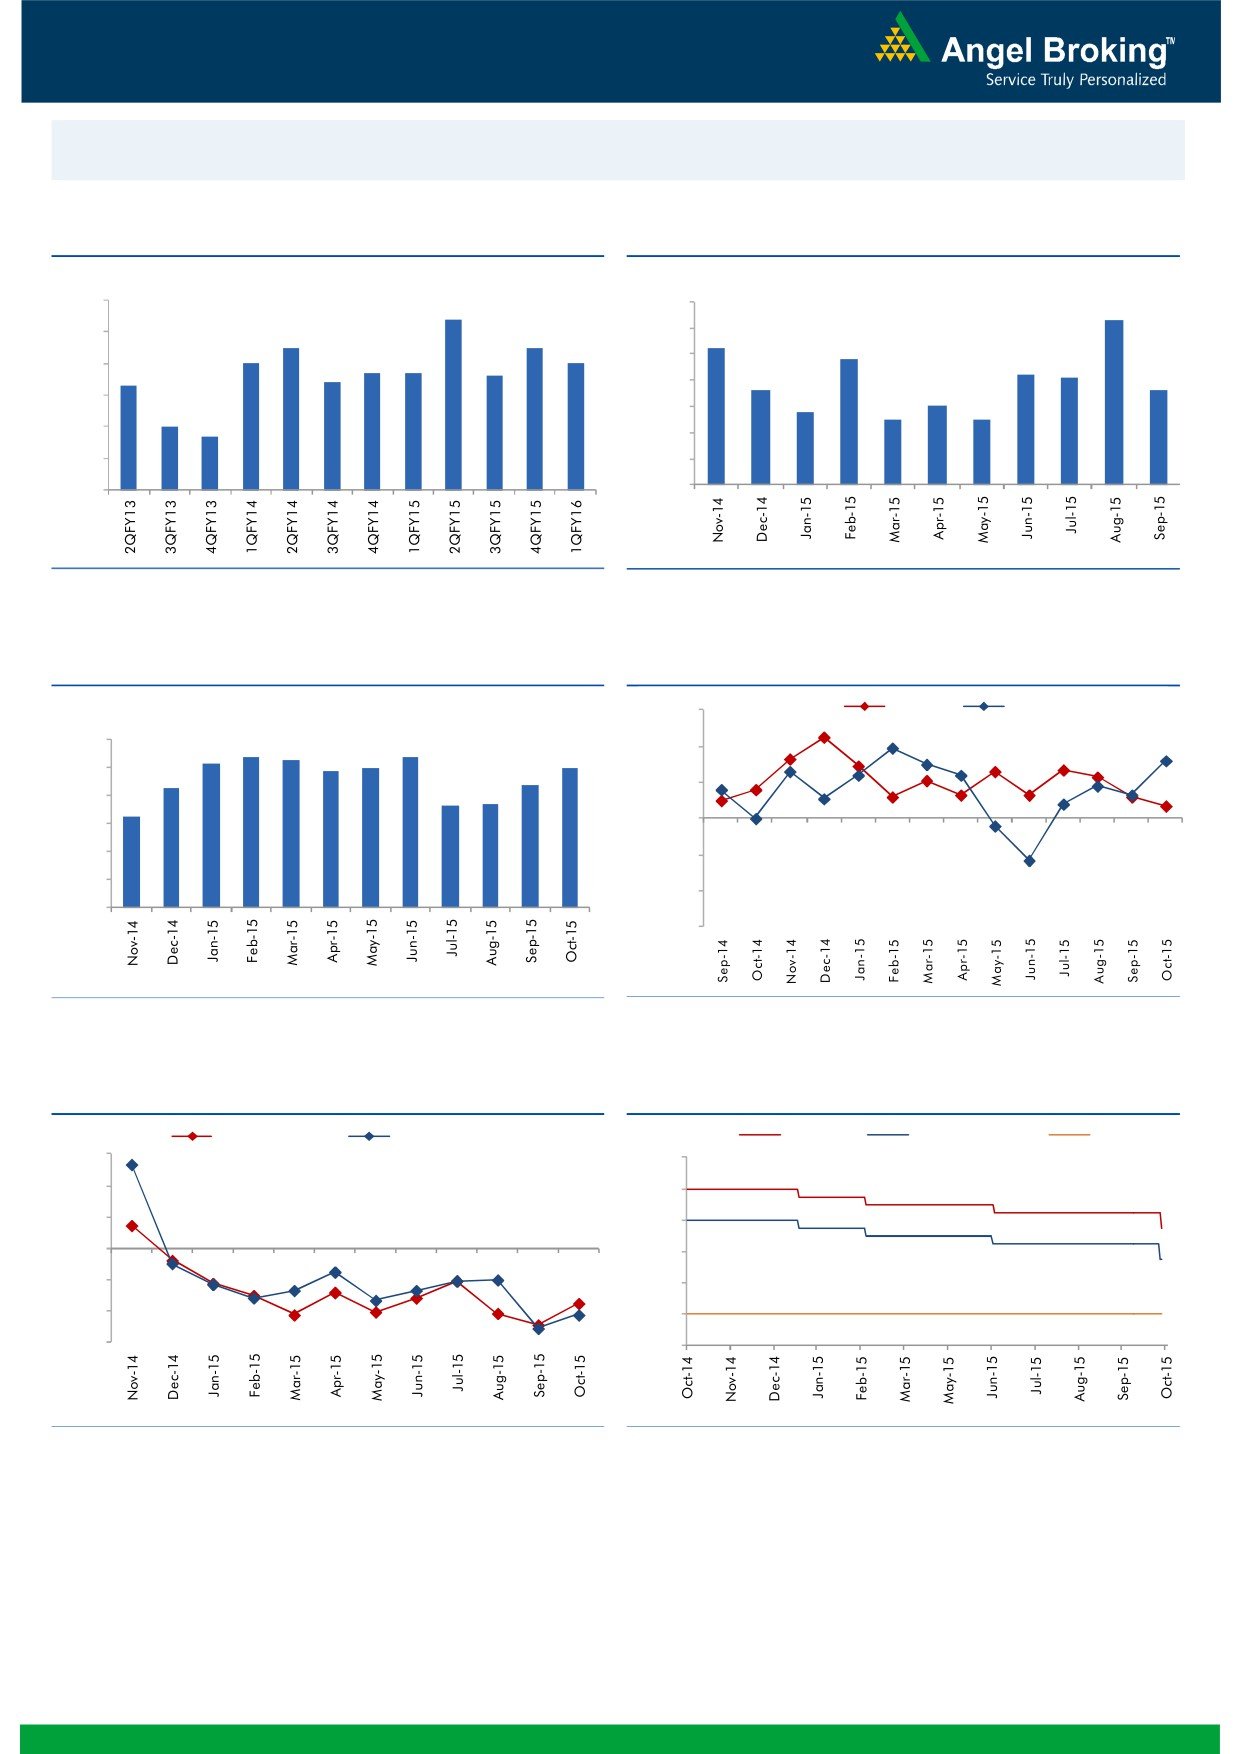
Macro watch
Exhibit 1: Quarterly GDP trends
Exhibit 2: IIP trends
(%)
(%)
9.0
8.4
7.0
6.3
8.0
7.5
7.5
6.0
5.2
7.0
7.0
4.8
6.7
6.7
5.0
7.0
6.4
6.6
4.2
4.1
6.3
3.6
3.6
4.0
6.0
2.8
3.0
2.5
2.5
5.0
3.0
4.7
5.0
2.0
4.0
1.0
3.0
-
Source: CSO, Angel Research
Source: MOSPI, Angel Research
Exhibit 3: Monthly CPI inflation trends
Exhibit 4: Manufacturing and services PMI
(%)
56.0
Mfg. PMI
Services PMI
6.0
5.4
5.3
5.4
5.2
5.0
5.0
54.0
4.9
5.0
4.3
4.4
3.7
3.7
52.0
4.0
3.3
50.0
3.0
2.0
48.0
1.0
46.0
-
44.0
Source: MOSPI, Angel Research
Source: Market, Angel Research; Note: Level above 50 indicates expansion
Exhibit 5: Exports and imports growth trends
Exhibit 6: Key policy rates
(%)
Exports yoy growth
Imports yoy growth
(%)
Repo rate
Reverse Repo rate
CRR
30.0
9.00
20.0
8.00
10.0
7.00
0.0
6.00
(10.0)
5.00
(20.0)
4.00
(30.0)
3.00
Source: Bloomberg, Angel Research
Source: RBI, Angel Research
Market Outlook
December 3, 2015
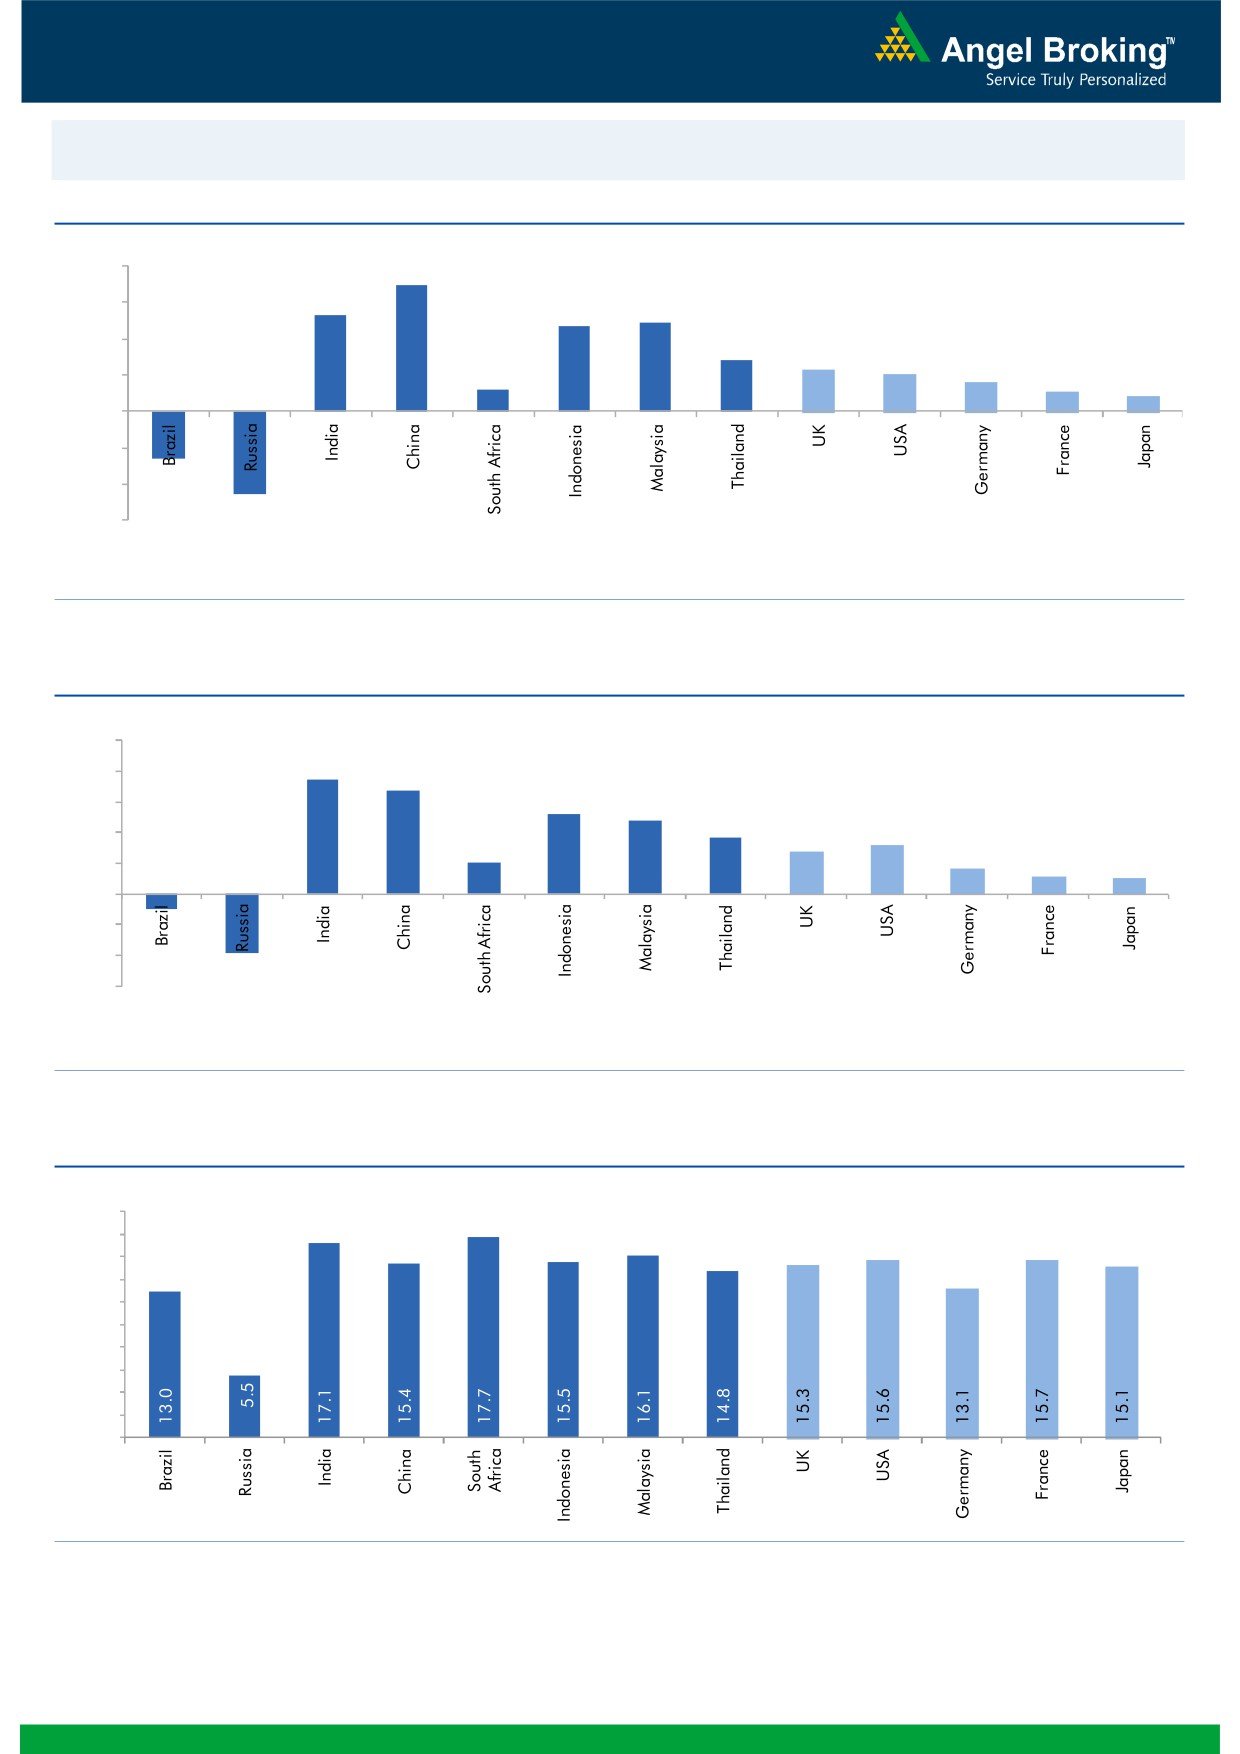
Global watch
Exhibit 1: Latest quarterly GDP Growth (%, yoy) across select developing and developed countries
(%)
8.0
6.9
6.0
5.3
4.9
4.7
4.0
2.8
2.3
2.0
1.6
2.0
1.2
1.1
0.8
(2.6)
-
(2.0)
(4.0)
(4.6)
(6.0)
Source: Bloomberg, Angel Research
Exhibit 2: 2015 GDP Growth projection by IMF (%, yoy) across select developing and developed countries
(%)
10.0
7.5
8.0
6.8
5.2
6.0
4.8
3.7
3.1
4.0
2.7
2.0
1.6
1.2
1.0
2.0
-
(2.0)
(4.0)
(1.0)
(3.8)
(6.0)
Source: IMF, Angel Research
Exhibit 3: One year forward P-E ratio across select developing and developed countries
(x)
20.0
18.0
16.0
14.0
12.0
10.0
8.0
6.0
4.0
2.0
-
Source: IMF, Angel Research
Market Outlook
December 3, 2015
Exhibit 4: Relative performance of indices across globe
Returns (%)
Country
Name of index
Closing price
1M
1YR
Brazil
Bovespa
45,915
(5.)
(13.0)
Russia
Micex
1,770
2.0
11.8
India
Nifty
7,932
(1.6)
(7.1)
China
Shanghai Composite
3,530
6.4
27.1
South Africa
Top 40
46,330
(4.1)
5.6
Mexico
Mexbol
44,985
(1.3)
2.3
Indonesia
LQ45
780
0.3
(12.4)
Malaysia
KLCI
1,676
0.9
(4.7)
Thailand
SET 50
857
(6.2)
(19.8)
USA
Dow Jones
17,730
(1.1)
(1.0)
UK
FTSE
6,421
0.6
(4.4)
Japan
Nikkei
19,880
6.4
12.2
Germany
DAX
11,190
3.8
13.0
France
CAC
4,906
2.2
12.7
Source: Bloomberg, Angel Research
Stock Watch
December 03, 2015
Company Name
Reco
CMP
Target
Mkt Cap
Sales ( Čcr )
OPM(%)
EPS (Č)
PER(x)
P/BV(x)
RoE(%)
EV/Sales(x)
(Č)
Price ( Č)
( Č cr )
FY16E FY17E
FY16E
FY17E
FY16E
FY17E
FY16E
FY17E
FY16E
FY17E
FY16E
FY17E
FY16E
FY17E
Agri / Agri Chemical
Rallis
Neutral
186
-
3,614
2,075
2,394
14.4
14.4
9.5
11.0
19.6
16.9
3.9
3.4
21.1
21.3
1.8
1.5
United Phosphorus
Buy
424
510
18,192
13,698
15,752
17.6
17.6
32.1
38.5
13.2
11.0
2.6
2.2
21.4
21.3
1.4
1.2
Auto & Auto Ancillary
Ashok Leyland
Buy
93
111
26,424
18,763
22,357
11.1
11.2
3.6
4.8
25.8
19.3
4.8
4.4
18.7
22.6
1.4
1.1
Bajaj Auto
Accumulate
2,499
2,672
72,324
24,115
27,600
21.3
21.0
136.8
157.2
18.3
15.9
5.9
5.0
32.2
31.5
2.6
2.2
Bharat Forge
Buy
847
1,016
19,714
8,013
9,250
20.0
20.3
35.2
43.1
24.1
19.7
4.7
3.9
21.6
21.8
2.6
2.2
Eicher Motors
Buy
16,344
19,036
44,361
15,379
16,498
15.6
16.6
473.2
574.8
34.5
28.4
12.8
9.5
36.7
33.2
2.8
2.6
Hero Motocorp
Neutral
2,676
-
53,433
28,561
31,559
14.7
14.7
151.1
163.2
17.7
16.4
6.9
5.8
38.7
35.6
1.7
1.5
Jamna Auto Industries Accumulate
237
258
4,731
1,292
1,486
9.3
9.8
12.0
15.0
19.7
15.8
4.1
3.5
20.7
21.8
3.7
3.3
L G Balakrishnan & Bros Neutral
489
-
768
1,254
1,394
11.6
11.8
35.9
41.7
13.6
11.8
1.9
1.6
13.5
13.8
0.7
0.6
Mahindra and Mahindra Neutral
1,369
-
85,012
38,513
43,579
13.6
13.7
56.1
65.1
24.4
21.0
3.8
3.4
15.7
16.2
1.9
1.6
Maruti
Accumulate
4,620
4,960
139,556
57,865
68,104
16.4
16.7
176.3
225.5
26.2
20.5
5.1
4.3
19.4
21.2
2.2
1.8
Minda Industries
Neutral
892
-
1,414
2,567
2,965
8.0
8.3
46.1
57.8
19.3
15.4
3.2
2.7
16.7
17.3
0.7
0.5
Motherson Sumi
Accumulate
284
313
37,519
39,343
45,100
8.8
9.1
10.1
12.5
28.1
22.7
8.9
7.0
35.3
34.4
1.0
0.9
Rane Brake Lining
Accumulate
339
366
268
454
511
11.1
11.4
23.8
28.1
14.2
12.1
2.0
1.8
14.2
15.3
0.7
0.7
Setco Automotive
Neutral
222
-
594
594
741
12.7
13.7
8.4
15.8
26.5
14.1
2.8
2.4
10.4
16.9
1.4
1.2
Tata Motors
Neutral
413
-
119,155
255,254
301,772
12.9
13.4
23.7
37.3
17.4
11.1
2.1
1.8
7.4
12.1
0.7
0.6
TVS Motor
Accumulate
289
313
13,740
11,845
14,040
7.2
9.0
10.4
17.4
27.8
16.6
7.0
5.3
25.1
32.0
1.1
0.9
Amara Raja Batteries
Buy
878
1,040
14,991
4,892
5,871
17.4
17.6
28.8
37.1
30.5
23.7
7.1
5.7
23.4
24.1
3.0
2.5
Exide Industries
Accumulate
145
162
12,342
6,950
7,784
14.4
14.8
6.6
7.3
22.0
19.9
2.8
2.5
12.6
12.8
1.5
1.3
Apollo Tyres
Neutral
164
-
8,353
12,146
12,689
16.8
16.0
21.2
19.0
7.7
8.6
1.3
1.1
16.5
13.0
0.8
0.8
Ceat
Neutral
1,067
-
4,318
6,041
6,597
14.1
13.7
99.5
111.9
10.7
9.5
2.1
1.8
19.6
18.5
0.9
0.7
JK Tyres
Neutral
112
-
2,539
7,446
7,669
15.2
14.0
19.6
18.4
5.7
6.1
1.4
1.2
25.2
19.5
0.7
0.6
Swaraj Engines
Neutral
919
-
1,141
552
630
14.2
14.7
44.6
54.1
20.6
17.0
4.8
4.4
23.2
25.6
1.9
1.6
Subros
Neutral
97
-
580
1,268
1,488
11.6
11.9
3.7
6.6
26.1
14.7
1.8
1.6
6.8
11.4
0.8
0.6
Indag Rubber
Neutral
233
-
611
283
329
17.0
17.2
13.0
15.4
18.0
15.1
3.9
3.3
21.8
21.6
1.9
1.6
Capital Goods
ACE
Neutral
46
-
455
660
839
4.7
8.2
1.0
3.9
46.0
11.8
1.4
1.3
3.2
11.3
0.8
0.7
BEML
Neutral
1,098
-
4,573
3,277
4,006
6.0
8.9
29.2
64.3
37.6
17.1
2.1
1.9
5.7
11.7
1.5
1.2
BGR Energy
Neutral
124
-
898
3,615
3,181
9.5
9.4
16.7
12.4
7.5
10.0
0.7
0.7
10.0
7.0
0.7
0.8
BHEL
Neutral
173
-
42,368
33,722
35,272
10.8
11.7
10.5
14.2
16.5
12.2
1.2
1.2
7.0
9.0
1.3
1.3
Stock Watch
December 03, 2015
Company Name
Reco
CMP
Target
Mkt Cap
Sales ( Čcr )
OPM(%)
EPS (Č)
PER(x)
P/BV(x)
RoE(%)
EV/Sales(x)
(Č)
Price ( Č)
( Č cr )
FY16E
FY17E
FY16E
FY17E
FY16E
FY17E
FY16E
FY17E
FY16E
FY17E
FY16E
FY17E
FY16E
FY17E
Capital Goods
Blue Star
Accumulate
355
382
3,192
3,624
4,157
5.3
6.0
9.6
14.5
36.9
24.5
6.7
5.8
18.6
25.4
1.0
0.8
Crompton Greaves
Neutral
197
-
12,347
13,484
14,687
4.9
6.2
4.5
7.1
43.8
27.8
3.1
2.9
7.2
10.8
1.0
1.0
Inox Wind
Buy
362
505
8,036
4,980
5,943
17.0
17.5
26.6
31.6
13.6
11.5
4.1
3.0
35.0
30.0
1.8
1.4
KEC International
Neutral
154
-
3,964
8,791
9,716
6.1
6.8
5.4
8.2
28.6
18.8
2.9
2.6
10.0
14.0
0.7
0.6
Thermax
Neutral
858
-
10,221
6,413
7,525
7.4
8.5
30.5
39.3
28.1
21.8
4.3
3.8
15.0
17.0
1.6
1.3
Cement
ACC
Buy
1,359
1,630
25,516
13,151
14,757
16.4
18.3
63.9
83.4
21.3
16.3
2.7
2.5
13.3
16.1
1.8
1.5
Ambuja Cements
Buy
200
233
31,108
11,564
12,556
19.4
20.7
8.9
10.1
22.5
19.9
2.8
2.7
12.8
13.8
2.3
2.1
HeidelbergCement
Neutral
76
-
1,721
1,772
1,926
13.3
15.4
1.0
3.0
76.0
25.3
1.9
1.8
2.6
7.9
1.5
1.3
India Cements
Buy
88
112
2,717
4,216
4,840
18.0
19.5
4.0
9.9
22.1
8.9
0.9
0.8
4.0
9.5
1.0
0.8
JK Cement
Accumulate
680
744
4,754
3,661
4,742
10.1
15.8
18.0
61.0
37.8
11.2
2.7
2.4
7.5
22.9
1.8
1.3
J K Lakshmi Cement
Buy
352
430
4,143
2,947
3,616
16.7
19.9
11.5
27.2
30.6
12.9
2.9
2.5
9.8
20.8
1.8
1.4
Mangalam Cements
Neutral
200
-
534
1,053
1,347
10.5
13.3
8.4
26.0
23.8
7.7
1.0
0.9
4.3
12.5
0.9
0.7
Orient Cement
Accumulate
168
183
3,437
1,854
2,524
21.2
22.2
7.7
11.1
21.8
15.1
3.1
2.7
13.3
15.7
2.6
1.8
Ramco Cements
Neutral
380
-
9,046
4,036
4,545
20.8
21.3
15.1
18.8
25.2
20.2
3.1
2.7
12.9
14.3
2.8
2.4
Shree Cement^
Neutral
11,357
-
39,564
7,150
8,742
26.7
28.6
228.0
345.5
49.8
32.9
7.3
6.2
15.7
20.3
5.3
4.2
UltraTech Cement
Buy
2,846
3,282
78,095
25,021
30,023
19.1
21.6
89.0
132.0
32.0
21.6
3.7
3.2
12.2
15.9
3.2
2.7
Construction
ITNL
Neutral
87
-
2,877
7,360
8,825
34.0
35.9
7.0
9.0
12.5
9.7
0.4
0.4
3.2
3.7
3.8
3.6
KNR Constructions
Accumulate
615
673
1,728
937
1,470
14.3
14.0
33.5
38.6
18.3
15.9
2.8
2.4
15.4
15.4
1.9
1.2
Larsen & Toubro
Buy
1,354
1,646
126,030
65,065
77,009
11.5
11.7
61.5
65.6
22.0
20.6
2.2
2.0
13.4
14.0
2.1
1.8
Gujarat Pipavav Port
Neutral
163
-
7,878
629
684
51.0
52.2
6.4
5.9
25.5
27.6
3.4
3.1
15.9
12.7
12.2
11.0
MBL Infrastructures
Buy
216
285
895
2,313
2,797
12.2
14.6
19.0
20.0
11.4
10.8
1.2
1.1
11.3
10.6
1.1
1.0
Nagarjuna Const.
Neutral
77
-
4,292
7,892
8,842
8.8
9.1
3.0
5.3
25.7
14.6
1.3
1.2
5.0
8.5
0.8
0.7
PNC Infratech
Neutral
542
-
2,780
1,873
2,288
13.2
13.5
24.0
32.0
22.6
16.9
2.2
2.0
12.1
12.3
1.6
1.3
Simplex Infra
Neutral
332
-
1,644
5,955
6,829
10.3
10.5
16.0
31.0
20.8
10.7
1.1
1.0
5.3
9.9
0.8
0.7
Power Mech Projects
Neutral
615
-
905
1,539
1,801
12.8
12.7
59.0
72.1
10.4
8.5
1.6
1.3
18.6
16.8
0.6
0.5
Sadbhav Engineering
Neutral
351
-
6,023
3,481
4,219
10.7
10.8
8.0
12.0
43.9
29.3
4.1
3.6
10.3
13.5
2.0
1.7
NBCC
Accumulate
996
1,089
11,946
7,382
9,506
7.7
8.6
39.8
54.4
25.0
18.3
6.0
4.8
26.7
29.1
1.4
1.0
SIPL
Neutral
100
-
3,519
675
1,042
62.4
64.7
-
-
3.7
4.3
-
-
16.9
11.4
Financials
Allahabad Bank
Neutral
76
-
4,561
8,332
9,259
2.8
2.8
21.0
25.6
3.6
3.0
0.4
0.3
9.8
10.9
-
-
Stock Watch
December 03, 2015
Company Name
Reco
CMP
Target
Mkt Cap
Sales ( Čcr )
OPM(%)
EPS (Č)
PER(x)
P/BV(x)
RoE(%)
EV/Sales(x)
(Č)
Price ( Č)
( Č cr )
FY16E
FY17E
FY16E
FY17E
FY16E
FY17E
FY16E
FY17E
FY16E
FY17E
FY16E
FY17E
FY16E
FY17E
Financials
Axis Bank
Buy
459
630
109,191
26,473
31,527
3.5
3.6
35.7
43.5
12.9
10.6
2.5
2.2
17.9
18.9
-
-
Bank of Baroda
Neutral
174
-
40,035
19,105
21,474
2.0
2.0
19.1
24.8
9.1
7.0
0.9
0.8
10.2
12.1
-
-
Bank of India
Neutral
127
-
10,089
15,972
17,271
1.9
2.0
15.3
33.4
8.3
3.8
0.4
0.3
3.6
7.6
-
-
Canara Bank
Neutral
264
-
14,346
15,251
16,725
2.0
2.0
59.3
68.6
4.5
3.9
0.5
0.4
10.1
10.7
-
-
Dena Bank
Neutral
44
-
2,458
3,440
3,840
2.1
2.3
7.3
10.0
6.0
4.4
0.5
0.4
6.1
7.9
-
-
Federal Bank
Neutral
57
-
9,835
3,477
3,999
3.0
3.0
5.0
6.2
11.4
9.2
1.2
1.0
10.6
11.9
-
-
HDFC
Neutral
1,211
-
191,081
10,358
11,852
3.3
3.3
41.1
47.0
29.5
25.8
5.6
5.1
24.7
24.9
-
-
HDFC Bank
Buy
1,075
1,262
270,744
38,309
47,302
4.3
4.3
49.3
61.1
21.8
17.6
3.8
3.2
18.5
19.7
-
-
ICICI Bank
Buy
270
357
156,982
35,168
40,517
3.4
3.4
21.4
25.2
12.6
10.7
2.2
1.8
14.7
15.2
-
-
IDBI Bank
Neutral
92
-
14,821
9,625
10,455
1.8
1.8
8.5
14.2
10.8
6.5
0.7
0.6
5.9
9.3
-
-
Indian Bank
Neutral
130
-
6,234
6,160
6,858
2.5
2.5
24.5
29.8
5.3
4.4
0.4
0.4
7.7
8.6
-
-
LIC Housing Finance
Buy
479
571
24,176
3,101
3,745
2.5
2.5
33.0
40.2
14.5
11.9
2.7
2.3
19.7
20.5
-
-
Oriental Bank
Neutral
151
-
4,535
7,643
8,373
2.4
2.4
37.2
45.4
4.1
3.3
0.4
0.3
8.2
9.4
-
-
Punjab Natl.Bank
Neutral
140
-
27,412
23,638
26,557
2.8
2.8
17.9
27.2
7.8
5.1
0.8
0.6
8.5
12.0
-
-
South Ind.Bank
Neutral
21
-
2,822
1,965
2,185
2.5
2.5
2.5
3.3
8.4
6.3
0.8
0.8
9.5
11.7
-
-
St Bk of India
Buy
245
283
189,994
82,520
93,299
2.7
2.8
20.0
24.5
12.2
10.0
1.3
1.2
11.5
12.8
-
-
Union Bank
Neutral
170
-
11,717
12,646
14,129
2.3
2.4
31.0
39.1
5.5
4.4
0.6
0.5
9.8
11.4
-
-
Vijaya Bank
Neutral
35
-
3,016
3,536
3,827
1.9
1.9
5.5
6.7
6.4
5.3
0.5
0.5
7.8
8.8
-
-
Yes Bank
Buy
750
914
31,389
7,228
9,043
3.2
3.3
57.7
69.4
13.0
10.8
2.3
2.0
19.1
19.6
-
-
FMCG
Asian Paints
Neutral
849
-
81,431
16,553
19,160
16.0
16.2
17.7
21.5
48.0
39.5
12.8
11.5
29.4
31.2
4.8
4.1
Britannia
Neutral
2,959
-
35,497
8,065
9,395
9.6
10.2
47.2
65.5
62.7
45.2
20.8
19.7
38.3
41.2
4.3
3.6
Colgate
Neutral
980
-
26,661
4,836
5,490
19.5
19.7
48.5
53.2
20.2
18.4
14.8
12.9
99.8
97.5
5.4
4.8
Dabur India
Neutral
283
-
49,700
9,370
10,265
17.1
17.2
7.3
8.1
38.6
34.9
11.6
9.5
33.7
30.6
5.2
4.8
GlaxoSmith Con*
Neutral
6,036
-
25,383
4,919
5,742
17.2
17.4
168.3
191.2
35.9
31.6
10.2
8.7
28.8
28.9
4.7
4.0
Godrej Consumer
Neutral
1,262
-
42,989
10,168
12,886
16.1
16.1
32.1
38.4
39.3
32.9
8.0
7.4
19.7
21.0
4.3
3.4
HUL
Neutral
829
-
179,460
34,940
38,957
17.5
17.7
20.8
24.7
39.9
33.6
44.4
35.4
110.5
114.2
4.9
4.4
ITC
Buy
350
409
280,887
41,068
45,068
37.8
37.4
13.9
15.9
25.1
22.0
8.4
7.4
34.1
33.8
6.5
5.9
Marico
Neutral
432
-
27,848
6,551
7,766
15.7
16.0
10.4
12.5
41.6
34.5
12.1
10.0
33.2
32.4
4.2
3.5
Nestle*
Accumulate
5,871
6,646
56,603
11,291
12,847
22.2
22.3
158.9
184.6
36.9
31.8
19.3
17.4
55.0
57.3
4.9
4.2
Stock Watch
December 03, 2015
Company Name
Reco
CMP
Target
Mkt Cap
Sales ( Čcr )
OPM(%)
EPS (Č)
PER(x)
P/BV(x)
RoE(%)
EV/Sales(x)
(Č)
Price ( Č)
( Č cr )
FY16E FY17E
FY16E
FY17E
FY16E
FY17E
FY16E
FY17E
FY16E
FY17E
FY16E
FY17E
FY16E
FY17E
FMCG
Tata Global
Accumulate
136
144
8,580
8,635
9,072
9.8
9.9
6.5
7.6
20.9
17.9
2.1
2.0
6.8
7.4
0.9
0.9
IT
HCL Tech^
Buy
860
1,132
120,871
42,038
47,503
23.2
23.5
55.8
62.9
15.4
13.7
3.5
2.7
23.0
19.8
2.5
2.0
Infosys
Buy
1,060
1,306
243,522
60,250
66,999
28.0
28.0
58.3
63.7
18.2
16.6
3.8
3.3
20.9
19.7
3.4
2.9
TCS
Buy
2,365
3,165
466,055
111,274
126,852
28.4
28.7
125.4
143.9
18.9
16.4
7.5
6.9
39.9
42.2
3.8
3.3
Tech Mahindra
Buy
541
646
52,065
25,566
28,890
16.0
17.0
26.3
31.9
20.6
17.0
3.7
3.2
17.9
18.6
1.8
1.5
Wipro
Buy
578
719
142,698
52,414
58,704
23.7
23.8
38.4
42.3
15.1
13.7
2.9
2.6
19.5
18.0
2.3
1.9
Media
D B Corp
Accumulate
333
356
6,119
2,241
2,495
27.8
27.9
21.8
25.6
15.3
13.0
4.0
3.5
26.7
28.5
2.7
2.4
HT Media
Neutral
82
-
1,913
2,495
2,603
11.2
11.2
7.3
8.6
11.3
9.6
0.9
0.8
7.4
8.1
0.3
0.3
Jagran Prakashan
Accumulate
155
169
5,059
2,170
2,355
27.0
27.6
12.8
10.3
12.1
15.1
3.4
3.2
21.8
19.4
2.1
1.8
Sun TV Network
Neutral
400
-
15,761
2,779
3,196
70.2
70.5
22.8
27.3
17.5
14.7
4.3
3.9
26.7
28.3
5.4
4.7
Hindustan Media
Neutral
289
-
2,123
920
1,031
20.0
20.0
19.2
20.9
15.1
13.9
2.5
2.1
16.4
15.3
1.8
1.6
Ventures
Metals & Mining
Coal India
Accumulate
338
380
213,588
76,167
84,130
19.9
22.3
22.4
25.8
15.1
13.1
5.4
5.3
35.5
41.0
2.1
1.9
Hind. Zinc
Buy
144
175
61,014
14,641
14,026
50.4
50.4
17.7
16.0
8.2
9.0
1.3
1.1
16.2
13.2
1.8
1.6
Hindalco
Neutral
80
-
16,592
104,356
111,186
8.7
9.5
6.7
11.1
12.0
7.3
0.4
0.4
3.5
5.9
0.7
0.6
JSW Steel
Neutral
981
-
23,706
42,308
45,147
16.4
20.7
(10.3)
49.5
19.8
1.1
1.1
(1.0)
5.6
1.6
1.5
NMDC
Neutral
94
-
37,407
8,237
10,893
46.6
44.5
10.0
11.7
9.5
8.1
1.1
0.9
12.5
13.0
4.3
3.3
SAIL
Neutral
48
-
19,659
45,915
53,954
7.2
10.5
1.5
4.4
31.6
10.9
0.5
0.5
2.3
4.1
1.1
1.0
Vedanta
Neutral
94
-
27,942
71,445
81,910
26.2
26.3
12.9
19.2
7.3
4.9
0.5
0.5
7.2
8.9
0.8
0.6
Tata Steel
Neutral
244
-
23,649
126,760
137,307
8.9
11.3
6.4
23.1
38.3
10.6
0.8
0.7
2.0
7.1
0.8
0.7
Oil & Gas
Cairn India
Neutral
137
-
25,770
11,323
12,490
49.4
51.0
20.7
20.7
6.6
6.7
0.4
0.4
6.4
6.1
1.3
0.7
GAIL
Neutral
360
-
45,716
64,856
70,933
9.1
9.6
24.0
28.9
15.0
12.5
1.3
1.2
8.8
9.6
0.9
0.8
ONGC
Neutral
236
-
201,738
154,564
167,321
36.8
37.4
28.6
32.5
8.2
7.3
1.1
1.0
12.7
13.5
1.5
1.4
Petronet LNG
Neutral
238
-
17,824
29,691
31,188
5.8
6.2
12.8
13.4
18.6
17.7
2.8
2.5
15.8
14.8
0.7
0.6
Indian Oil Corp
Accumulate
431
455
104,669
359,607
402,760
5.9
6.1
42.5
48.7
10.2
8.9
1.4
1.2
14.1
14.4
0.4
0.3
Reliance Industries
Accumulate
977
1,050
316,265
304,775
344,392
12.6
13.4
91.3
102.6
10.7
9.5
1.2
1.1
11.8
12.0
1.0
0.8
Pharmaceuticals
Alembic Pharma
Neutral
697
-
13,144
2,658
3,112
24.1
20.2
24.6
23.9
28.3
29.2
10.2
7.8
42.5
30.2
4.9
4.2
Aurobindo Pharma
Accumulate
825
872
48,171
14,923
17,162
23.0
23.0
38.2
43.6
21.6
18.9
6.7
5.0
36.0
30.2
3.6
3.0
Aventis*
Neutral
4,377
-
10,081
2,082
2,371
17.4
20.8
118.2
151.5
37.0
28.9
5.4
4.4
19.9
25.5
4.5
3.8
Cadila Healthcare
Neutral
406
-
41,579
10,224
11,840
21.0
22.0
14.6
17.6
27.8
23.1
7.6
6.0
30.8
29.0
4.1
3.5
Stock Watch
December 03, 2015
Company Name
Reco
CMP
Target
Mkt Cap
Sales ( Čcr )
OPM(%)
EPS (Č)
PER(x)
P/BV(x)
RoE(%)
EV/Sales(x)
(Č)
Price ( Č)
( Č cr )
FY16E FY17E
FY16E
FY17E
FY16E
FY17E
FY16E
FY17E
FY16E
FY17E
FY16E
FY17E
FY16E
FY17E
Pharmaceuticals
Cipla
Neutral
657
-
52,784
14,211
16,611
20.6
19.0
27.0
28.9
24.3
22.7
4.1
3.5
18.4
16.8
3.7
3.1
Dr Reddy's
Buy
3,252
3,933
55,450
16,838
19,575
25.0
23.1
167.5
178.8
19.4
18.2
4.1
3.4
23.1
20.4
3.2
2.7
Dishman Pharma
Neutral
319
-
2,577
1,733
1,906
21.5
21.5
17.0
19.9
18.8
16.1
1.9
1.7
10.5
11.2
2.0
1.7
GSK Pharma*
Neutral
3,299
-
27,942
2,870
3,158
20.0
22.1
59.5
68.3
55.4
48.3
16.4
16.8
28.5
34.3
9.2
8.4
Indoco Remedies
Neutral
324
-
2,989
1,033
1,199
15.9
18.2
9.4
13.6
34.5
23.9
5.1
4.4
15.7
19.7
3.0
2.6
Ipca labs
Buy
770
900
9,711
3,363
3,909
12.9
18.6
13.4
28.0
57.4
27.5
7.5
6.0
7.4
14.0
3.2
2.7
Lupin
Neutral
1,871
-
84,220
13,092
16,561
25.0
27.0
50.4
68.3
37.1
27.4
7.7
6.1
22.8
24.7
6.2
4.7
Sun Pharma
Buy
733
950
176,452
28,163
32,610
25.8
30.7
17.4
26.9
42.1
27.3
4.0
3.5
13.0
16.6
5.7
4.7
Power
Tata Power
Neutral
66
-
17,918
35,923
37,402
22.6
22.8
4.1
5.2
16.3
12.9
1.3
1.2
7.5
9.3
1.4
1.3
NTPC
Buy
133
157
109,747
87,064
98,846
23.5
23.5
11.7
13.2
11.4
10.1
1.3
1.2
11.4
12.1
2.3
2.0
Power Grid
Buy
135
170
70,574
20,702
23,361
86.7
86.4
12.1
13.2
11.2
10.2
1.6
1.5
15.6
15.1
8.3
7.8
Telecom
Bharti Airtel
Neutral
323
-
129,096
101,748
109,191
32.1
31.7
12.0
12.5
26.9
25.8
1.9
1.7
6.9
6.7
1.9
1.7
Idea Cellular
Neutral
140
-
50,431
34,282
36,941
32.0
31.5
5.9
6.2
23.8
22.6
2.2
2.0
9.9
9.3
2.0
1.9
zOthers
Abbott India
Neutral
5,138
-
10,918
2,715
3,153
14.5
14.1
134.3
152.2
38.3
33.8
9.6
7.9
27.4
25.6
3.7
3.2
Bajaj Electricals
Buy
218
341
2,204
4,719
5,287
5.2
5.8
8.6
12.7
25.5
17.3
2.9
2.6
11.4
14.8
0.5
0.4
Finolex Cables
Neutral
247
-
3,781
2,520
2,883
12.2
12.0
12.7
14.2
19.5
17.4
2.7
2.4
13.6
13.5
1.2
1.1
Goodyear India*
Accumulate
567
622
1,307
1,888
1,680
12.1
11.9
62.2
56.6
9.1
10.0
2.1
1.8
25.9
19.7
0.5
0.5
Hitachi
Neutral
1,338
-
3,639
1,779
2,081
7.8
8.8
21.8
33.4
61.4
40.0
9.9
8.0
17.4
22.1
2.1
1.8
Jyothy Laboratories
Neutral
317
-
5,739
1,620
1,847
11.5
11.5
7.3
8.5
43.5
37.4
5.6
5.2
13.3
14.4
3.4
2.9
MRF
Buy
39,246
45,575
16,645
20,316
14,488
21.4
21.1
5,488.0
3,798.0
7.2
10.3
2.4
2.0
41.1
21.2
0.8
1.0
Page Industries
Neutral
12,961
-
14,456
1,929
2,450
19.8
20.1
229.9
299.0
56.4
43.4
24.9
17.3
52.1
47.1
7.5
5.9
Relaxo Footwears
Neutral
501
-
6,015
1,767
2,152
12.3
12.5
19.3
25.1
26.0
20.0
6.4
4.9
27.7
27.8
3.5
2.8
Siyaram Silk Mills
Buy
954
1,145
894
1,636
1,815
11.5
11.5
89.9
104.1
10.6
9.2
1.8
1.5
17.9
17.8
0.7
0.6
Styrolution ABS India*
Neutral
728
-
1,281
1,271
1,440
8.6
9.2
32.0
41.1
22.7
17.7
2.3
2.1
10.7
12.4
1.0
0.8
TVS Srichakra
Accumulate
2,855
3,240
2,186
2,101
2,338
15.7
15.0
248.6
270.0
11.5
10.6
5.0
3.6
43.6
34.0
1.1
0.9
HSIL
Neutral
318
-
2,300
2,123
2,384
16.1
16.5
15.0
18.9
21.2
16.9
1.6
1.5
8.0
9.4
1.4
1.3
Kirloskar Engines India
Neutral
266
-
3,845
2,471
2,826
8.8
10.4
9.1
13.3
29.1
19.9
2.8
2.6
9.7
13.4
1.2
1.0
Ltd
M M Forgings
Buy
528
614
637
511
615
21.7
21.6
43.1
55.8
12.2
9.5
2.2
1.8
19.9
21.2
1.5
1.1
Banco Products (India)
Neutral
137
-
982
1,208
1,353
11.0
12.3
10.8
14.5
12.7
9.5
1.5
1.3
11.9
14.5
0.8
0.7
Stock Watch
December 03, 2015
Company Name
Reco
CMP
Target Mkt Cap
Sales ( Čcr )
OPM(%)
EPS (Č)
PER(x)
P/BV(x)
RoE(%)
EV/Sales(x)
(Č)
Price ( Č)
( Č cr )
FY16E FY17E FY16E FY17E FY16E FY17E FY16E FY17E FY16E FY17E FY16E FY17E FY16E FY17E
zOthers
Competent Automobiles Neutral
148
-
91
1,040
1,137
3.2
3.1
25.7
28.0
5.8
5.3
0.9
0.8
15.0
14.3
0.1
0.1
Nilkamal
Neutral
1,072
-
1,600
1,910
2,083
10.5
10.3
63.3
69.2
16.9
15.5
2.8
2.4
17.6
16.5
0.9
0.8
Visaka Industries
Accumulate
130
144
207
1,086
1,197
9.9
10.3
21.5
28.8
6.1
4.5
0.6
0.5
9.6
11.6
0.4
0.3
Transport Corporation of
Neutral
317
-
2,413
2,830
3,350
8.8
9.0
14.4
18.3
22.1
17.3
3.4
3.0
15.4
17.1
1.0
0.8
India
Elecon Engineering
Neutral
91
-
988
1,369
1,533
13.7
14.9
3.3
6.1
27.3
15.0
1.8
1.7
6.6
11.4
1.1
0.9
Surya Roshni
Buy
138
183
607
2,992
3,223
8.1
8.4
14.7
18.3
9.4
7.6
0.9
0.8
9.7
11.0
0.5
0.4
MT Educare
Buy
138
169
548
286
366
18.3
17.7
7.7
9.4
17.8
14.7
3.8
3.3
20.2
21.1
1.8
1.4
Radico Khaitan
Buy
113
156
1,499
1,565
1,687
12.2
13.0
5.7
7.1
19.8
15.9
1.7
1.5
8.3
9.6
1.4
1.3
Garware Wall Ropes
Neutral
403
-
882
861
967
10.9
10.9
24.0
28.2
16.8
14.3
2.5
2.1
14.6
14.9
1.0
0.9
Wonderla Holidays
Neutral
358
-
2,023
206
308
44.0
43.6
9.0
12.9
39.8
27.8
5.4
4.9
13.7
17.8
9.7
6.5
Linc Pen & Plastics
Neutral
184
-
273
340
371
8.3
8.9
10.8
13.2
17.1
14.0
2.7
2.4
16.0
17.1
0.8
0.8
The Byke Hospitality
Accumulate
170
181
681
222
287
20.5
20.5
5.6
7.6
30.1
22.5
5.7
4.7
18.9
20.8
3.1
2.4
Interglobe Aviation
Neutral
1,099
-
39,612
17,022
21,122
20.7
14.5
63.9
53.7
17.2
20.5
25.8
21.1
149.9
103.2
2.4
1.9
Coffee Day Enterprises
Neutral
257
-
5,294
2,692
2,964
17.0
18.6
-
4.7
-
54.2
3.1
3.0
0.2
5.5
2.4
2.2
Ltd
Navneet Education
Accumulate
86
97
431
998
1,062
24.1
24.0
5.8
6.1
15.0
14.1
3.3
2.9
22.0
20.6
0.5
0.5
Source: Company, Angel Research; Note: *December year end; #September year end; &October year end; Price as on December 02, 2015
Market Outlook
December 03, 2015
Research Team Tel: 022 - 39357800
DISCLAIMER
Angel Broking Private Limited (hereinafter referred to as “Angel”) is a registered Member of National Stock Exchange of India Limited,
Bombay Stock Exchange Limited and Metropolitian Stock Exchange of India Limited. It is also registered as a Depository Participant with
CDSL and Portfolio Manager with SEBI. It also has registration with AMFI as a Mutual Fund Distributor. Angel Broking Private Limited is a
registered entity with SEBI for Research Analyst in terms of SEBI (Research Analyst) Regulations, 2014 vide registration number
INH000000164. Angel or its associates has not been debarred/ suspended by SEBI or any other regulatory authority for accessing
/dealing in securities Market. Angel or its associates including its relatives/analyst do not hold any financial interest/beneficial ownership
of more than 1% in the company covered by Analyst. Angel or its associates/analyst has not received any compensation / managed or co
-managed public offering of securities of the company covered by Analyst during the past twelve months. Angel/analyst has not served as
an officer, director or employee of company covered by Analyst and has not been engaged in market making activity of the company
covered by Analyst.
This document is solely for the personal information of the recipient, and must not be singularly used as the basis of any investment
decision. Nothing in this document should be construed as investment or financial advice. Each recipient of this document should make
such investigations as they deem necessary to arrive at an independent evaluation of an investment in the securities of the companies
referred to in this document (including the merits and risks involved), and should consult their own advisors to determine the merits and
risks of such an investment.
Reports based on technical and derivative analysis center on studying charts of a stock's price movement, outstanding positions and
trading volume, as opposed to focusing on a company's fundamentals and, as such, may not match with a report on a company's
fundamentals.
The information in this document has been printed on the basis of publicly available information, internal data and other reliable sources
believed to be true, but we do not represent that it is accurate or complete and it should not be relied on as such, as this document is for
general guidance only. Angel Broking Pvt. Limited or any of its affiliates/ group companies shall not be in any way responsible for any
loss or damage that may arise to any person from any inadvertent error in the information contained in this report. Angel Broking Pvt.
Limited has not independently verified all the information contained within this document. Accordingly, we cannot testify, nor make any
representation or warranty, express or implied, to the accuracy, contents or data contained within this document. While Angel Broking
Pvt. Limited endeavors to update on a reasonable basis the information discussed in this material, there may be regulatory, compliance,
or other reasons that prevent us from doing so.
This document is being supplied to you solely for your information, and its contents, information or data may not be reproduced,
redistributed or passed on, directly or indirectly.
Neither Angel Broking Pvt. Limited, nor its directors, employees or affiliates shall be liable for any loss or damage that may arise from or
in connection with the use of this information.
Note: Please refer to the important ‘Stock Holding Disclosure' report on the Angel website (Research Section). Also, please refer to the
latest update on respective stocks for the disclosure status in respect of those stocks. Angel Broking Pvt. Limited and its affiliates may have
investment positions in the stocks recommended in this report.