Market Outlook
June 03, 2016
Market Cues
Domestic Indices
Chg (%)
(Pts)
(Close)
Indian Markets are expected to open on a Positive note tracking the SGX Nifty and
BSE Sensex
0.5
129
26,843
Global Markets.
Nifty
0.5
39
8,219
US Markets closed higher Thursday as oil prices rebounded from its lows and job
Mid Cap
0.7
74
11,407
data indicated a tightening labor market. Oil prices came under pressure after
Small Cap
0.3
33
11,196
OPEC countries failed to reach an agreement to cap oil production but later
Bankex
0.9
183
20,055
recovered after Energy Information Administration said that stockpiles and
production both declined. Markets also improved on reports from payroll processor
ADP where employment rose by 173,000 jobs in May against 166,000 in April and
Global Indices
Chg (%)
(Pts)
(Close)
on decline in Initial Jobless Claims.
Dow Jones
0.3
49
17,839
European markets ended Thursday's session on a mixed note. Oil and gas shares
Nasdaq
0.4
19
4,971
were the top losers as OPEC failed to change its output policy. Markets awaited
FTSE
(0.1)
(6)
6,186
announcement from ECB where interest rates, as expected, were kept low and
Nikkei
(2.3)
(393)
16,563
quantitative easing was left unchanged.
Hang Seng
0.5
98
20,859
Indian shares rose on Thursday on late rally by index heavyweights. Markets also
Shanghai Com
0.4
12
2,925
reacted positively to commentary by the Finance Minister indicating that the
government would push for reforms.
Advances / Declines
BSE
NSE
News Analysis
Advances
1,235
767
M&M eyes $1bn from US tractor biz
Declines
1,410
785
Detailed analysis on Pg2
Unchanged
156
77
Investor’s Ready Reckoner
Volumes (` Cr)
Key Domestic & Global Indicators
BSE
2,184
Stock Watch: Latest investment recommendations on 150+ stocks
Refer Pg4 onwards
NSE
16,460
Top Picks
Net Inflows (` Cr)
Net
Mtd
Ytd
CMP
Target
Upside
Company
Sector
Rating
(`)
(`)
(%)
FII
344
344
14,712
Amara Raja
Auto/Auto Ancillary
Buy
841
1,076
28.0
MFs
16
16
9,447
HCL Tech
IT
Buy
721
1,000
38.7
LIC Housing
Financials
Buy
474
592
24.9
Top Gainers
Price (`)
Chg (%)
Bharat Electronics
Capital Goods
Buy
1,164
1,414
21.4
Crompgreav
74
8.3
Navkar Corporation Others
Buy
194
265
37.0
Gdl
311
7.6
More Top Picks on Pg3
Enginersin
195
6.8
Key Upcoming Events
Laxmimach
3,613
6.6
Previous
Consensus
Date
Region
Event Description
Reading
Expectations
Cholafin
1,027
4.9
June 03 US
ECB announces interest rates
160.0
160.0
June 03 US
Unemployment Rate
5.0
4.9
Top Losers
Price (`)
Chg (%)
June 07 India
RBI Repo rate
6.5
6.5
Punjlloyd
19
(5.2)
June 07 India
RBI Reverse Repo rate
6.0
6.0
6.(
Cadilahc
324
(2.8)
More Events on Pg4
Kpit
174
(2.8)
Amtekauto
34
(2.7)
Justdial
678
(2.4)
As on June 2, 2016
Market Outlook
June 03, 2016
M&M hopes to reap $1 b revenue from US tractor biz
Mahindra & Mahindra is betting big on its tractor business in the US where it
expects to double its revenues to $1 billion in the next three-four years.
The management has targeted to double the revenue of Mahindra North America,
which sells tractors and UTVs in US and Canada, over the next three-four years.
The company posted turnover of ~$500 million in FY2016.
The company is looking at aggressively growing in not just the US but also
expanding into Americas by expanding its operations to Mexico. Currently the
company is only present in the US and Canada and will further plant to expand to
South America. Exports currently form a small portion of the revenue for M&M. The
company is the largest tractor company in the world and currently sources its
tractors from Mahindra factories in India, Japan and South Korea and assembles
them in its five factories in the US.
Currently, it is the third largest player in the tractor player in the US and US
happens to be the third largest market for Mahindra tractors after India and
China. Mahindra North America contributes about 24,000 tractors a year and has
grown 4.5 times over the past five years.
We currently have a Neutral rating on the stock.
Economic and Political News
Govt to establish 250 agro-processing clusters pan India
Odisha to urge Centre to compensate `944cr CST loss
GDP to grow faster in Q1 on govt spending in infrastructure: Industry
Arun Jaitley hints at GST rollout next year
Corporate News
Indian steel players to be more profitable in near term: Icra
Hero MotoCorp appoints new head of product planning
Electrosteel Steels seeks deep restructuring of `10,000cr loan
NMDC board meet on Tuesday to consider buyback option
Market Outlook
June 03, 2016
Top Picks ★★★★★
Large Cap
Market Cap
CMP
Target
Upside
Company
Rationale
(` Cr)
(`)
(`)
(%)
To outpace battery industry growth due to better technological
Amara Raja Batteries
14,363
841
1,076
28.0
products leading to market share gains in both the automotive
OEM and replacement segments.
Uptick in defense capex by government when coupled with
Bharat Electronics
27,947
1,164
1,414
21.4
BELs strong market positioning, indicate that good times are
ahead for BEL.
The stock is trading at attractive valuations and is factoring all
HCL Tech
1,01,687
721
1,000
38.7
the bad news.
Strong visibility for a robust 20% earnings trajectory, coupled
HDFC Bank
2,97,248
1,175
1,262
7.4
with high quality of earnings on account of high quality retail
business and strategic focus on highly rated corporates.
Back on the growth trend, expect a long term growth of 14%
Infosys
2,89,472
1,260
1,374
9.0
to be a US$20bn in FY2020.
LICHF continues to grow its retail loan book at a healthy pace
with improvement in asset quality. We expect the company to
LIC Housing Finance
23,913
474
592
24.9
post a healthy loan book which is likely to reflect in a strong
earnings growth.
Huge bid pipeline of re-development works at Delhi and other
NBCC
11,838
197
1,098
456.5
State Governments and opportunity from Smart City, positions
NBCC to report strong growth, going forward.
Source: Company, Angel Research
Mid Cap
Market Cap
CMP
Target
Upside
Company
Rationale
(` Cr)
(`)
(`)
(%)
Favorable outlook for the AC industry to augur well for
Cooling products business which is out pacing the market
Blue Star
3,814
424
481
13.4
growth. EMPPAC division's profitability to improve once
operating environment turns around.
With a focus on the low and medium income (LMI) consumer
Dewan Housing
5,767
198
270
36.6
segment, the company has increased its presence in tier-II &
III cities where the growth opportunity is immense.
Commencement of new projects, downtrend in the interest
IL&FS Transport
2,253
69
93
35.8
rate cycle, to lead to stock re-rating
Economic recovery to have favourable impact on advertising
& circulation revenue growth. Further, the acquisition of a
Jagran Prakashan
5,574
171
205
20.2
radio business (Radio City) would also boost the company's
revenue growth.
Speedier execution and speedier sales, strong revenue visibilty
Mahindra Lifespace
1,800
439
554
26.3
in short-to-long run, attractive valuations
Massive capacity expansion along with rail advantage at ICD
Navkar Corporation
2,759
194
265
37.0
as well CFS augurs well for the company
Earnings boost on back of stable material prices and
Radico Khaitan
1,198
90
125
38.8
favourable pricing environment. Valuation discount to peers
provides additional comfort
Strong brands and distribution network would boost growth
Siyaram Silk Mills
979
1,044
1,354
29.7
going ahead. Stock currently trades at an inexpensive
valuation.
Source: Company, Angel Research
Market Outlook
June 03, 2016
Key Upcoming Events
Global economic events release calendar
Date
Time
Country
Event Description
Unit
Period
Bloomberg Data
Last Reported Estimated
Jun 3, 2016
6:00PM
US
Change in Nonfarm payrolls
Thousands
May
160.00
160.00
1:25PM
Germany
PMI Services
Value
May F
55.20
55.20
6:00PM
US
Unnemployment rate
%
May
5.00
4.90
Jun 7, 2016
11:00AM
India
RBI Repo rate
%
Jun 7
6.50
6.50
2:30PM
Euro Zone
Euro-Zone GDP s.a. (QoQ)
% Change
1Q F
0.50
0.50
11:00AM
India
RBI Reverse Repo rate
%
Jun 7
6.00
6.00
11:00AM
India
RBI Cash Reserve ratio
%
Jun 7
4.00
4.00
Jun 8, 2016
2:00PM
UK
Industrial Production (YoY)
% Change
Apr
(0.20)
--
China
Exports YoY%
% Change
May
(1.80)
(4.60)
Jun 9, 2016
7:00AM
China
Consumer Price Index (YoY)
% Change
May
2.30
2.30
Jun 10, 2016
India
Imports YoY%
% Change
May
(23.10)
--
India
Exports YoY%
% Change
May
(6.70)
--
5:30PM
India
Industrial Production YoY
% Change
Apr
0.10
--
Jun 12, 2016
11:00AM
China
Industrial Production (YoY)
% Change
May
6.00
5.90
Jun 14, 2016
12:00PM
India
Monthly Wholesale Prices YoY%
% Change
May
0.34
--
2:00PM
UK
Jobless claims change
% Change
May
(2.40)
--
Jun 15, 2016
2:00PM
UK
CPI (YoY)
% Change
May
0.30
--
US
Producer Price Index (mom)
% Change
May
0.20
--
6:45PM
US
Industrial Production
%
May
0.66
--
11:30PM
US
FOMC rate decision
%
Jun 15
0.50
0.50
Jun 16, 2016
2:30PM
Euro Zone
Euro-Zone CPI (YoY)
%
May F
(0.10)
--
6:00PM
US
Consumer price index (mom)
% Change
May
0.40
--
4:30PM
UK
BOE Announces rates
% Ratio
Jun 16
0.50
--
Jun 17, 2016
6:00PM
US
Housing Starts
Thousands
May
1,172.00
--
6:00PM
US
Building permits
Thousands
May
1,130.00
--
Jun 22, 2016
7:30PM
US
Existing home sales
Million
May
5.45
--
1:00PM
Germany
PMI Manufacturing
Value
Jun P
52.10
--
Source: Bloomberg, Angel Research
Market Outlook
June 03, 2016
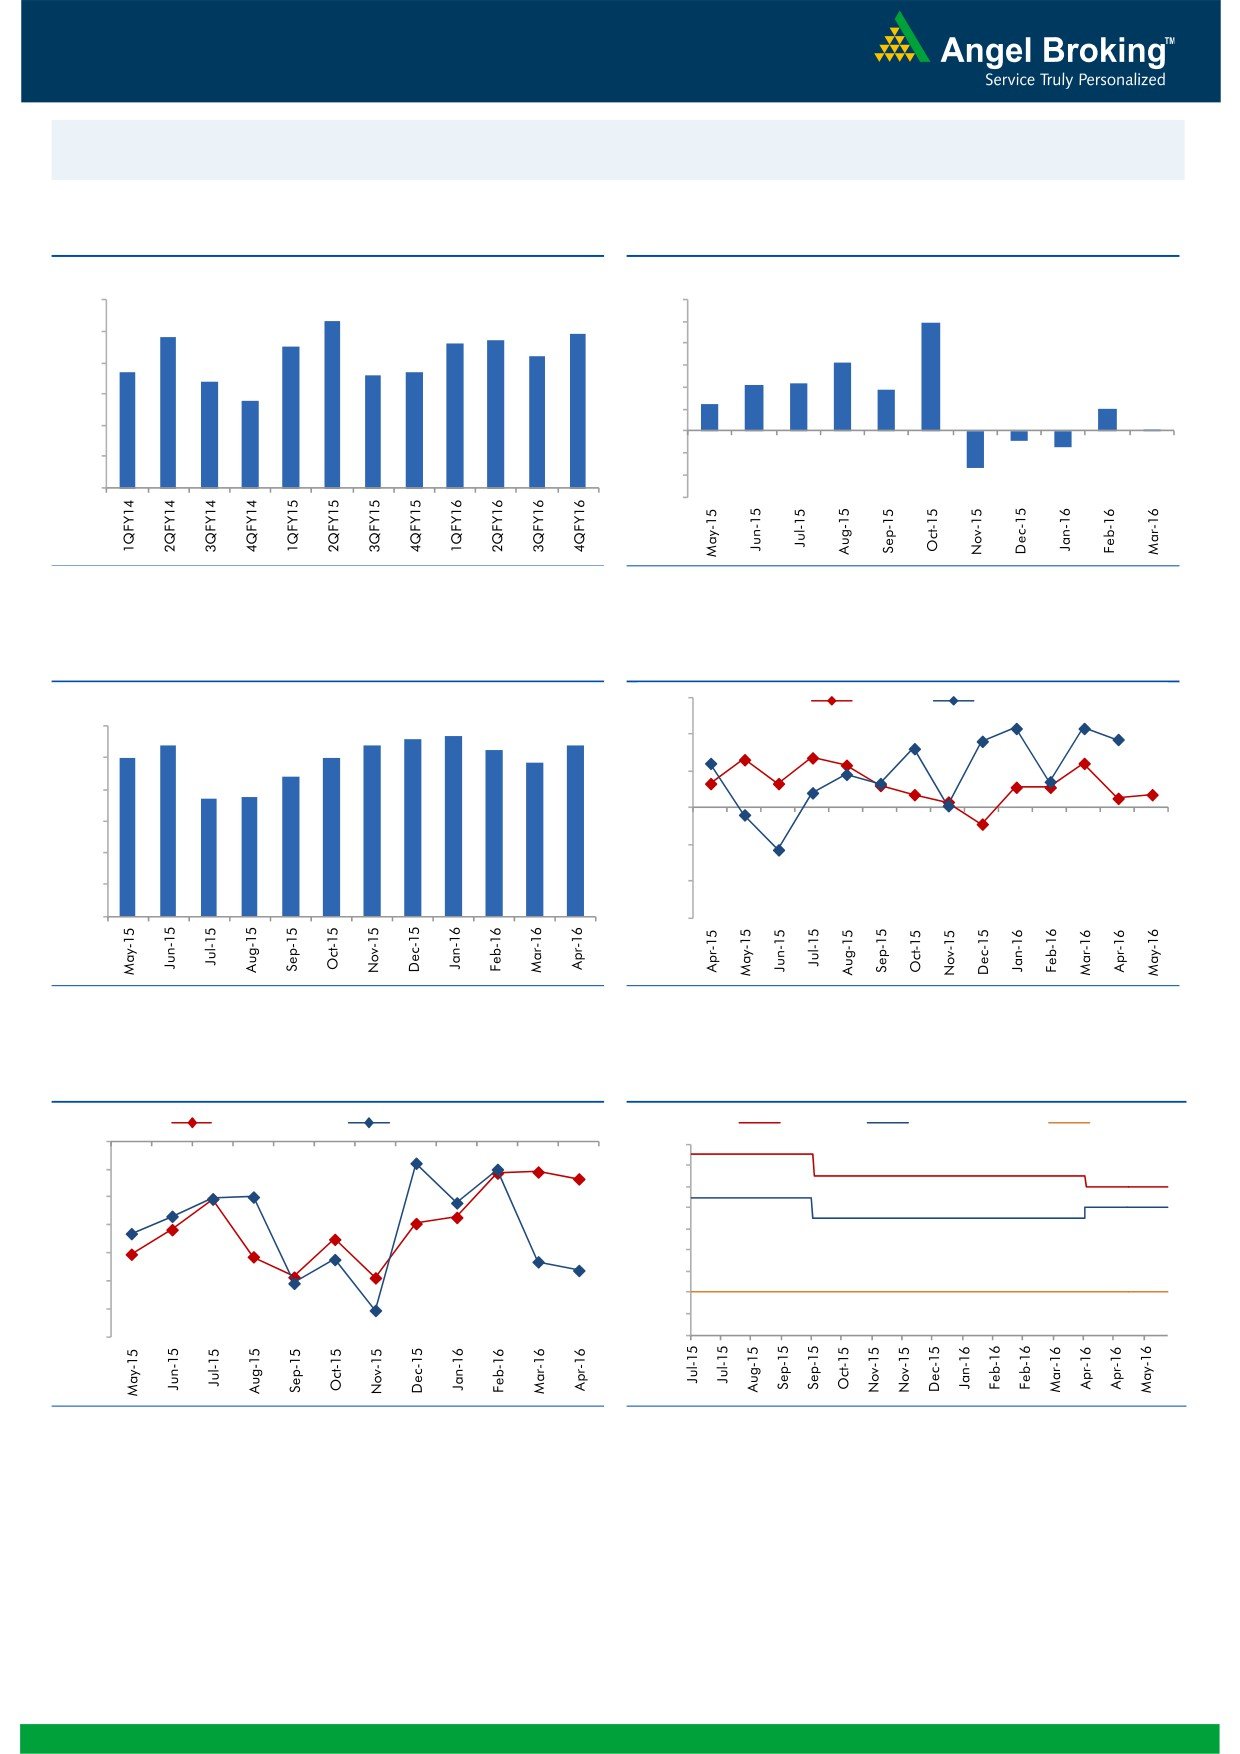
Macro watch
Exhibit 1: Quarterly GDP trends
Exhibit 2: IIP trends
(%)
(%)
9.0
8.3
12.0
9.9
7.8
7.7
7.9
10.0
8.0
7.5
7.6
7.2
8.0
6.3
6.7
6.6
6.7
7.0
6.4
6.0
4.2
4.3
3.7
5.8
4.0
2.5
6.0
2.0
2.0
0.1
5.0
-
4.0
(2.0)
(0.9)
(1.5)
(4.0)
3.0
(3.4)
(6.0)
Source: CSO, Angel Research
Source: MOSPI, Angel Research
Exhibit 3: Monthly CPI inflation trends
Exhibit 4: Manufacturing and services PMI
56.0
Mfg. PMI
Services PMI
(%)
5.6
5.7
6.0
5.4
5.4
5.4
5.3
54.0
5.0
5.0
4.8
5.0
4.4
52.0
3.7
3.7
4.0
50.0
3.0
48.0
2.0
1.0
46.0
-
44.0
Source: MOSPI, Angel Research
Source: Market, Angel Research; Note: Level above 50 indicates expansion
Exhibit 5: Exports and imports growth trends
Exhibit 6: Key policy rates
(%)
Exports yoy growth
Imports yoy growth
(%)
Repo rate
Reverse Repo rate
CRR
0.0
7.50
(5.0)
7.00
6.50
(10.0)
6.00
(15.0)
5.50
(20.0)
5.00
4.50
(25.0)
4.00
(30.0)
3.50
(35.0)
3.00
Source: Bloomberg, Angel Research
Source: RBI, Angel Research
Market Outlook
June 03, 2016
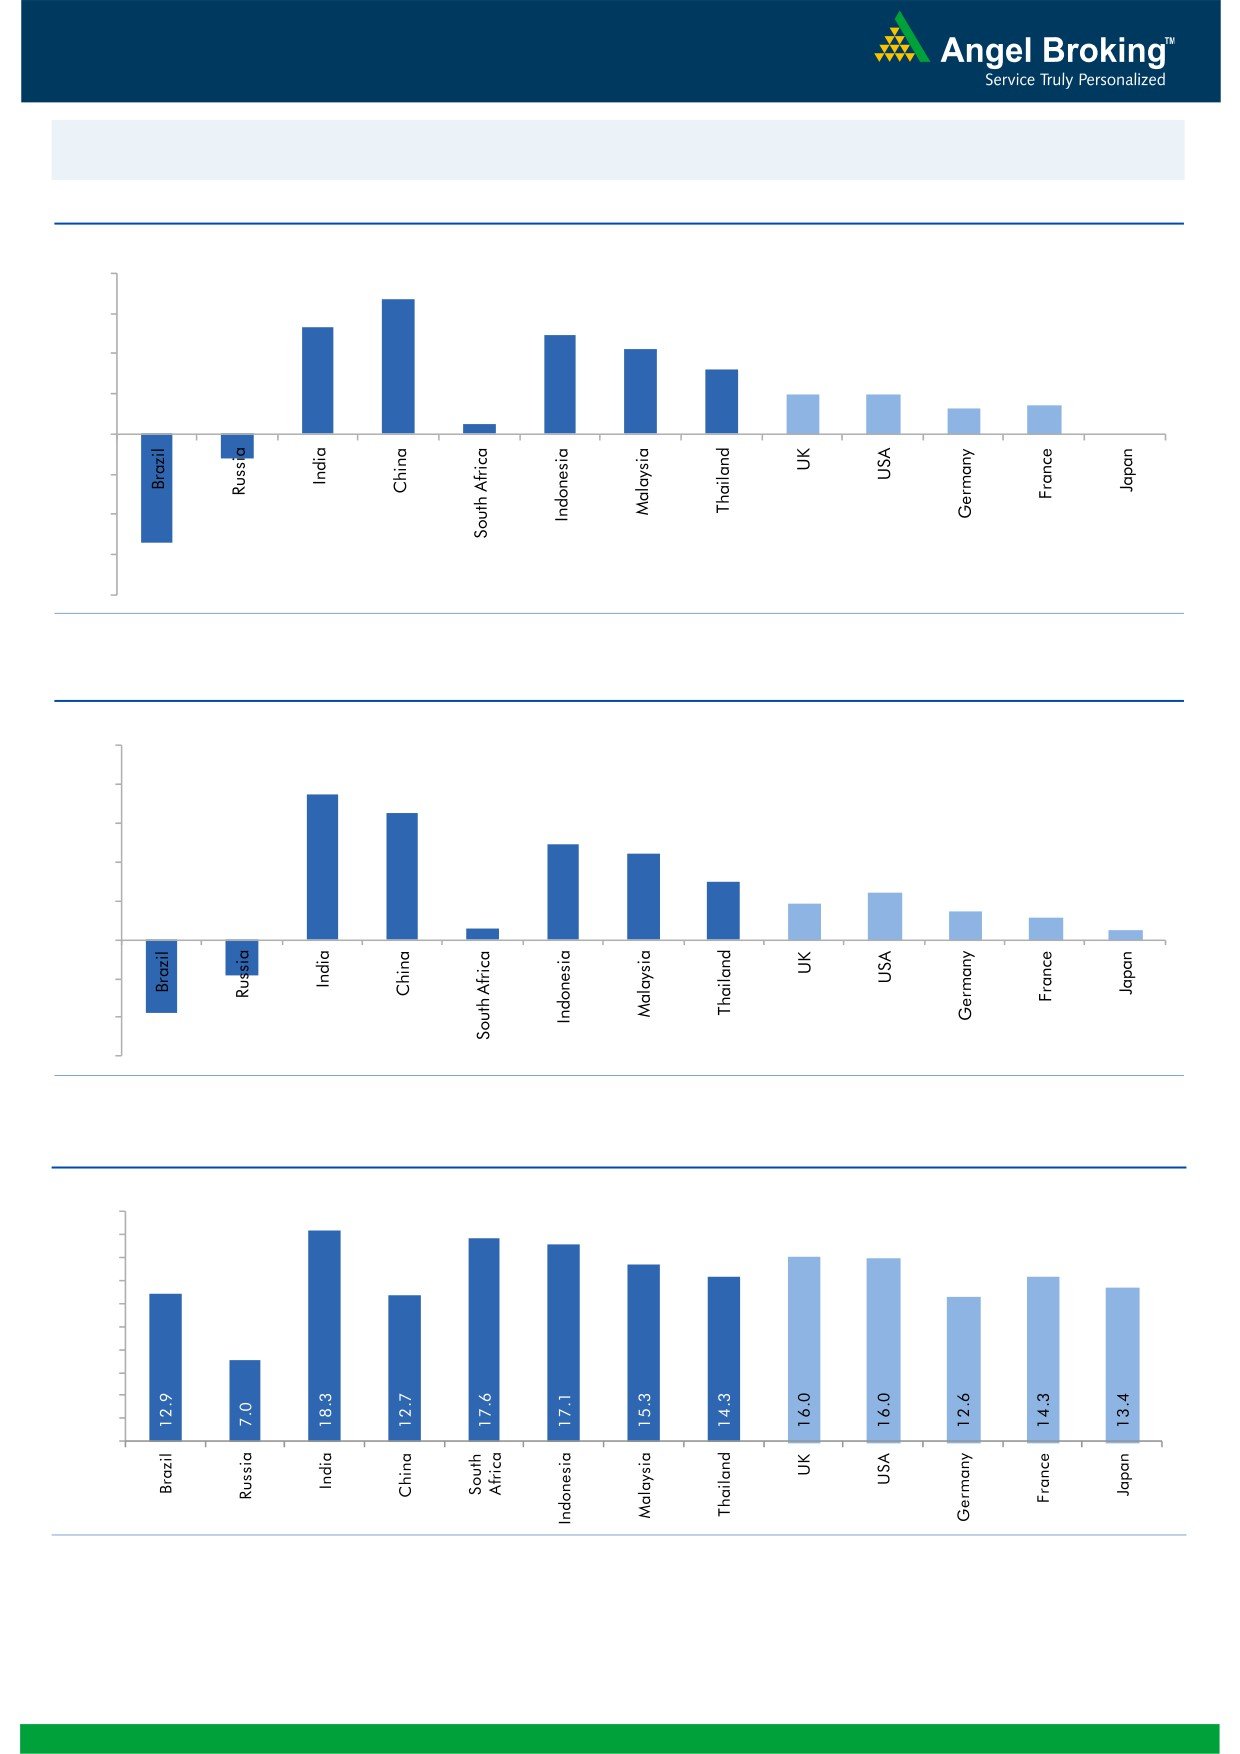
Global watch
Exhibit 1: Latest quarterly GDP Growth (%, yoy) across select developing and developed countries
(%)
8.0
6.7
6.0
5.3
4.9
4.2
4.0
3.2
2.0
2.0
1.3
1.4
2.0
0.5
-
-
(2.0)
(4.0)
(1.2)
(6.0)
(5.4)
(8.0)
Source: Bloomberg, Angel Research
Exhibit 2: 2016 GDP Growth projection by IMF (%, yoy) across select developing and developed countries
(%)
10.0
7.5
8.0
6.5
6.0
4.9
4.4
4.0
3.0
2.4
1.9
1.5
2.0
1.1
0.6
0.5
(3.8)
(1.8)
-
(2.0)
(4.0)
(6.0)
Source: IMF, Angel Research
Exhibit 3: One year forward P-E ratio across select developing and developed countries
(x)
20.0
18.0
16.0
14.0
12.0
10.0
8.0
6.0
4.0
2.0
-
Source: IMF, Angel Research
Market Outlook
June 03, 2016
Exhibit 4: Relative performance of indices across globe
Returns (%)
Country
Name of index
Closing price
1M
3M
1YR
Brazil
Bovespa
49,887
(6.9)
13.1
(7.0)
Russia
Micex
1,891
(4.0)
2.8
15.1
India
Nifty
8,219
6.1
17.9
(1.2)
China
Shanghai Composite
2,925
(2.2)
2.2
(40.8)
South Africa
Top 40
47,678
4.7
8.7
2.8
Mexico
Mexbol
45,508
(0.3)
2.9
2.1
Indonesia
LQ45
828
(0.6)
(0.9)
(10.7)
Malaysia
KLCI
1,631
(1.3)
(3.4)
(7.1)
Thailand
SET 50
907
1.1
6.9
(10.0)
USA
Dow Jones
17,839
(0.3)
5.6
(0.4)
UK
FTSE
6,186
(0.9)
1.5
(9.1)
Japan
Nikkei
16,563
(4.2)
2.3
(18.9)
Germany
DAX
10,208
0.8
5.1
(7.7)
France
CAC
4,466
2.2
0.9
(10.2)
Source: Bloomberg, Angel Research
Stock Watch
June 03, 2016
Company Name
Reco
CMP
Target
Mkt Cap
Sales ( Čcr )
OPM(%)
EPS (Č)
PER(x)
P/BV(x)
RoE(%)
EV/Sales(x)
(Č)
Price ( Č)
( Č cr )
FY16E FY17E
FY16E
FY17E
FY16E
FY17E
FY16E
FY17E
FY16E
FY17E
FY16E
FY17E
FY16E
FY17E
Agri / Agri Chemical
Rallis
Neutral
212
-
4,126
1,612
1,911
13.3
13.3
7.4
9.5
28.7
22.3
4.6
4.1
16.7
18.4
2.6
2.2
United Phosphorus
Buy
605
684
25,924
13,083
15,176
18.5
18.5
31.5
37.4
19.2
16.2
3.8
3.2
21.4
21.4
2.1
1.8
Auto & Auto Ancillary
Ashok Leyland
Accumulate
106
111
30,038
17,995
21,544
11.4
11.6
3.4
4.7
31.0
22.5
5.4
5.0
17.7
22.2
1.6
1.3
Bajaj Auto
Neutral
2,595
-
75,086
22,709
25,860
20.9
20.1
129.0
143.6
20.1
18.1
6.2
5.3
30.7
29.4
2.9
2.5
Bharat Forge
Buy
763
875
17,753
7,351
8,318
19.9
19.7
31.2
36.5
24.4
20.9
4.4
3.7
19.3
19.2
2.5
2.2
Eicher Motors
Accumulate
18,807
20,044
51,082
15,556
16,747
15.5
17.3
464.8
597.5
40.5
31.5
14.8
10.9
36.2
34.3
3.2
2.9
Gabriel India
Accumulate
92
101
1,318
1,415
1,544
8.7
9.0
4.6
5.4
20.0
17.0
3.6
3.2
18.1
18.9
0.9
0.8
Hero Motocorp
Neutral
3,137
-
62,648
28,244
30,532
15.5
15.9
156.7
168.5
20.0
18.6
8.0
6.8
39.9
36.4
2.0
1.8
Jamna Auto Industries Neutral
160
-
1,277
1,281
1,473
11.2
11.5
7.6
9.2
21.0
17.4
5.3
4.4
25.4
25.2
1.1
0.9
L G Balakrishnan & Bros Neutral
458
-
719
1,254
1,394
11.6
11.8
35.9
41.7
12.8
11.0
1.7
1.5
13.5
13.8
0.7
0.6
Mahindra and Mahindra Neutral
1,333
-
82,773
38,416
42,904
13.7
13.9
54.8
63.4
24.3
21.0
3.8
3.3
15.4
15.8
1.8
1.6
Maruti
Neutral
4,184
-
126,386
57,865
68,104
16.4
16.7
176.3
225.5
23.7
18.6
4.6
3.9
19.4
21.2
2.0
1.6
Minda Industries
Neutral
1,170
-
1,856
2,523
2,890
8.7
9.0
55.0
65.4
21.3
17.9
4.1
3.3
19.3
18.7
0.8
0.7
Motherson Sumi
Accumulate
291
313
38,459
39,343
45,100
8.8
9.1
10.1
12.5
28.8
23.3
9.1
7.1
35.3
34.4
1.1
0.9
Rane Brake Lining
Buy
381
465
302
454
511
11.5
12.0
25.2
31.0
15.1
12.3
2.3
2.0
14.9
16.6
0.8
0.7
Setco Automotive
Neutral
38
-
506
594
741
12.7
13.7
1.7
3.2
22.3
11.8
2.3
2.0
10.4
16.9
1.2
1.0
Tata Motors
Neutral
453
-
130,848
259,686
273,957
13.0
13.4
25.9
29.5
17.5
15.4
2.3
2.0
8.0
9.0
0.7
0.7
TVS Motor
Accumulate
297
330
14,091
11,263
13,122
6.9
8.5
9.2
15.0
32.2
19.8
7.4
5.9
22.7
29.6
1.2
1.0
Amara Raja Batteries
Buy
841
1,076
14,363
4,892
5,871
17.4
17.6
28.8
37.1
29.2
22.7
6.8
5.5
23.4
24.1
2.9
2.4
Exide Industries
Neutral
160
-
13,579
6,950
7,784
14.4
14.8
6.6
7.3
24.2
21.9
3.1
2.8
12.6
12.8
1.7
1.5
Apollo Tyres
Buy
155
183
7,895
12,056
12,714
17.2
16.4
23.0
20.3
6.7
7.6
1.2
1.0
17.7
13.6
0.7
0.7
Ceat
Buy
913
1,119
3,694
6,041
6,597
14.1
13.7
99.5
111.9
9.2
8.2
1.8
1.5
19.6
18.5
0.8
0.6
JK Tyres
Neutral
87
-
1,976
7,446
7,669
15.2
14.0
19.6
18.4
4.4
4.7
1.1
0.9
25.2
19.5
0.7
0.6
Swaraj Engines
Neutral
1,106
-
1,373
552
630
14.2
14.7
44.6
54.1
24.8
20.4
5.8
5.2
23.2
25.6
2.3
2.0
Subros
Neutral
95
-
573
1,293
1,527
11.8
11.9
4.2
6.7
22.7
14.3
1.7
1.6
7.7
11.5
0.8
0.6
Indag Rubber
Neutral
186
-
488
283
329
17.0
17.2
13.0
15.4
14.4
12.1
3.1
2.6
21.8
21.6
1.4
1.2
Capital Goods
ACE
Neutral
40
-
396
660
839
4.7
8.2
1.0
3.9
40.1
10.3
1.3
1.1
3.2
11.3
0.8
0.6
BEML
Buy
843
1,157
3,510
3,277
4,006
6.0
8.9
36.2
64.3
23.3
13.1
1.6
1.5
5.7
11.7
1.2
0.9
Bharat Electronics
Buy
1,164
1,414
27,947
7,737
8,634
16.8
17.2
54.0
61.5
21.6
18.9
3.1
2.7
39.3
45.6
2.7
2.3
Stock Watch
June 03, 2016
Company Name
Reco
CMP
Target
Mkt Cap
Sales ( Čcr )
OPM(%)
EPS (Č)
PER(x)
P/BV(x)
RoE(%)
EV/Sales(x)
(Č)
Price ( Č)
( Č cr )
FY16E
FY17E
FY16E
FY17E
FY16E
FY17E
FY16E
FY17E
FY16E
FY17E
FY16E
FY17E
FY16E
FY17E
Capital Goods
Voltas
Buy
338
407
11,186
5,363
5,963
8.0
9.1
11.0
13.8
30.7
24.5
4.7
4.1
16.2
17.9
2.0
1.8
BGR Energy
Neutral
115
-
829
3,615
3,181
9.5
9.4
16.7
12.4
6.9
9.3
0.7
0.6
10.0
7.0
0.6
0.8
BHEL
Neutral
120
-
29,359
33,722
35,272
10.8
11.7
10.5
14.2
11.4
8.5
0.8
0.8
7.0
9.0
0.9
0.9
Blue Star
Accumulate
424
481
3,814
3,548
3,977
6.3
6.9
13.7
17.2
31.0
24.7
7.8
5.1
26.1
25.4
1.2
1.0
Crompton Greaves
Neutral
74
-
4,638
13,484
14,687
4.9
6.2
4.5
7.1
16.4
10.4
1.2
1.1
7.2
10.8
0.4
0.4
Greaves Cotton
Neutral
137
-
3,353
1,655
1,755
16.6
16.8
7.4
7.8
18.6
17.6
3.7
3.5
21.1
20.6
2.0
1.8
Inox Wind
Buy
217
286
4,823
4,406
5,605
15.5
15.7
20.4
24.8
10.7
8.8
2.4
1.8
27.9
25.9
1.3
1.0
KEC International
Neutral
138
-
3,541
8,791
9,716
6.1
6.8
5.4
8.2
25.5
16.8
2.6
2.3
10.0
14.0
0.6
0.6
Thermax
Neutral
754
-
8,986
6,413
7,525
7.4
8.5
30.5
39.3
24.7
19.2
3.8
3.3
15.0
17.0
1.4
1.1
VATech Wabag
Neutral
612
-
3,336
2,722
3,336
7.9
8.1
19.5
24.6
31.4
24.9
3.3
2.9
11.1
12.4
1.3
1.0
Cement
ACC
Neutral
1,548
-
29,058
13,151
14,757
16.4
18.3
63.9
83.4
24.2
18.6
3.1
2.9
13.3
16.1
2.1
1.7
Ambuja Cements
Neutral
230
-
35,616
11,564
12,556
19.4
20.7
8.9
10.1
25.8
22.7
3.2
3.1
12.8
13.8
2.7
2.5
HeidelbergCement
Neutral
106
-
2,394
1,772
1,926
13.3
15.4
1.0
3.0
105.7
35.2
2.7
2.5
2.6
7.9
1.9
1.7
India Cements
Neutral
98
-
2,995
4,216
4,840
18.0
19.5
4.0
9.9
24.4
9.9
1.0
0.9
4.0
9.5
1.0
0.8
JK Cement
Neutral
580
-
4,054
3,661
4,742
10.1
15.8
7.5
28.5
77.3
20.3
2.3
2.1
7.5
22.9
1.6
1.2
J K Lakshmi Cement
Neutral
339
-
3,990
2,947
3,616
16.7
19.9
11.5
27.2
29.5
12.5
2.8
2.4
9.8
20.8
1.8
1.4
Mangalam Cements
Neutral
271
-
724
1,053
1,347
10.5
13.3
8.4
26.0
32.3
10.4
1.4
1.3
4.3
12.5
1.0
0.8
Orient Cement
Neutral
165
-
3,388
1,854
2,524
21.2
22.2
7.7
11.1
21.5
14.9
3.1
2.7
13.3
15.7
2.5
1.8
Ramco Cements
Neutral
495
-
11,779
4,036
4,545
20.8
21.3
15.1
18.8
32.8
26.3
4.0
3.6
12.9
14.3
3.4
2.9
Shree Cement^
Neutral
13,758
-
47,930
7,150
8,742
26.7
28.6
228.0
345.5
60.3
39.8
8.9
7.5
15.7
20.3
6.2
5.0
UltraTech Cement
Neutral
3,231
-
88,679
24,669
29,265
18.2
20.6
82.0
120.0
39.4
26.9
4.2
3.7
11.3
14.7
3.7
3.1
Construction
ITNL
Buy
69
93
2,253
7,360
8,825
34.0
35.9
7.0
9.0
9.8
7.6
0.3
0.3
3.2
3.7
3.7
3.6
KNR Constructions
Accumulate
575
603
1,617
937
1,470
14.3
14.0
44.2
38.6
13.0
14.9
2.6
2.3
15.4
15.4
1.8
1.1
Larsen & Toubro
Neutral
1,478
-
137,758
58,870
65,708
8.3
10.3
42.0
53.0
35.2
27.9
2.4
2.2
8.8
11.2
2.5
2.3
Gujarat Pipavav Port
Neutral
158
-
7,641
629
684
51.0
52.2
6.4
5.9
24.7
26.8
3.3
3.0
15.9
12.7
12.0
10.8
MBL Infrastructures
Buy
122
285
504
2,313
2,797
12.2
14.6
19.0
20.0
6.4
6.1
0.7
0.6
11.3
10.6
0.9
0.8
Nagarjuna Const.
Neutral
72
-
3,989
7,892
8,842
8.8
9.1
3.0
5.3
23.9
13.5
1.2
1.1
5.0
8.5
0.7
0.6
PNC Infratech
Neutral
563
-
2,886
1,873
2,288
13.2
13.5
24.0
32.0
23.4
17.6
2.3
2.0
12.1
12.3
1.7
1.4
Simplex Infra
Neutral
270
-
1,336
5,955
6,829
10.3
10.5
16.0
31.0
16.9
8.7
0.9
0.8
5.3
9.9
0.7
0.6
Stock Watch
June 03, 2016
Company Name
Reco
CMP
Target
Mkt Cap
Sales ( Čcr )
OPM(%)
EPS (Č)
PER(x)
P/BV(x)
RoE(%)
EV/Sales(x)
(Č)
Price ( Č)
( Č cr )
FY16E
FY17E
FY16E
FY17E
FY16E
FY17E
FY16E
FY17E
FY16E
FY17E
FY16E
FY17E
FY16E
FY17E
Construction
Power Mech Projects
Neutral
585
-
861
1,539
1,801
12.8
12.7
59.0
72.1
9.9
8.1
1.5
1.3
18.6
16.8
0.6
0.5
Sadbhav Engineering
Accumulate
278
298
4,769
3,186
3,598
10.2
10.3
8.0
9.0
34.8
30.9
3.2
2.8
9.4
9.9
1.8
1.6
NBCC
Accumulate
197
1,098
11,838
5,816
7,382
6.9
7.7
29.6
39.8
6.7
5.0
1.2
0.9
24.1
26.7
1.7
1.3
MEP Infra
Neutral
37
-
597
1,956
1,876
28.1
30.5
1.3
3.0
28.2
12.2
5.9
4.0
21.2
32.8
1.8
1.7
SIPL
Neutral
97
-
3,411
675
1,042
62.4
64.7
-
-
3.6
4.1
-
-
16.8
11.3
Engineers India
Neutral
195
-
6,579
1,667
1,725
13.5
16.0
9.7
11.4
20.1
17.1
2.4
2.3
11.7
13.4
2.5
2.5
Financials
Allahabad Bank
Neutral
52
-
3,173
8,569
9,392
2.8
2.9
16.3
27.5
3.2
1.9
0.3
0.2
7.6
11.9
-
-
Axis Bank
Neutral
524
-
125,043
26,204
29,738
3.6
3.5
34.5
35.4
15.2
14.8
2.4
2.1
16.8
14.9
-
-
Bank of Baroda
Neutral
141
-
32,569
18,802
21,088
2.0
2.2
(7.4)
13.0
10.9
1.1
0.9
(4.2)
7.3
-
-
Bank of India
Neutral
87
-
8,093
15,972
17,271
1.9
2.0
15.3
33.4
5.7
2.6
0.3
0.2
3.6
7.6
-
-
Canara Bank
Neutral
200
-
10,854
15,441
16,945
2.0
2.1
46.6
70.4
4.3
2.8
0.4
0.3
8.0
11.2
-
-
Dena Bank
Neutral
29
-
1,944
3,440
3,840
2.1
2.3
7.3
10.0
4.0
2.9
0.3
0.3
6.1
7.9
-
-
Dewan Housing Finance Buy
198
270
5,767
1,828
2,225
2.9
3.0
24.9
29.7
7.9
6.7
1.2
1.1
15.1
16.1
-
-
Federal Bank
Neutral
52
-
8,848
3,279
3,787
2.8
2.9
3.9
5.5
13.1
9.3
1.1
1.0
8.4
10.8
-
-
HDFC
Neutral
1,261
-
199,147
10,358
11,852
3.3
3.3
41.1
47.0
30.7
26.8
5.8
5.3
24.7
24.9
-
-
HDFC Bank
Accumulate
1,175
1,262
297,248
38,606
47,696
4.4
4.5
48.8
61.4
24.1
19.2
4.1
3.6
18.7
20.0
-
-
ICICI Bank
Neutral
241
-
140,300
34,279
39,262
3.3
3.3
21.0
24.4
11.5
9.9
1.9
1.6
14.4
14.7
-
-
IDBI Bank
Neutral
67
-
13,784
9,625
10,455
1.8
1.8
8.5
14.2
7.9
4.7
0.5
0.4
5.9
9.3
-
-
Indian Bank
Neutral
92
-
4,416
6,160
6,858
2.5
2.5
24.5
29.8
3.8
3.1
0.3
0.3
7.7
8.6
-
-
LIC Housing Finance
Buy
474
592
23,913
3,179
3,758
2.6
2.6
32.9
40.6
14.4
11.7
2.7
2.3
19.6
20.7
-
-
Oriental Bank
Neutral
82
-
2,852
7,643
8,373
2.4
2.4
37.2
45.4
2.2
1.8
0.2
0.2
8.2
9.4
-
-
Punjab Natl.Bank
Neutral
77
-
15,208
23,122
26,022
2.8
2.8
7.0
21.6
11.1
3.6
0.6
0.5
3.4
10.0
-
-
South Ind.Bank
Neutral
19
-
2,579
1,965
2,185
2.5
2.5
2.5
3.3
7.7
5.8
0.8
0.7
9.5
11.7
-
-
St Bk of India
Neutral
201
-
155,682
79,958
86,061
2.6
2.6
13.4
20.7
15.0
9.7
1.2
1.1
11.5
12.8
-
-
Union Bank
Neutral
116
-
7,995
12,646
14,129
2.3
2.4
31.0
39.1
3.8
3.0
0.4
0.3
9.8
11.4
-
-
Vijaya Bank
Neutral
30
-
2,826
3,536
3,827
1.9
1.9
5.5
6.7
5.5
4.6
0.5
0.4
7.8
8.8
-
-
Yes Bank
Neutral
1,049
-
44,130
7,190
9,011
3.2
3.3
58.2
69.7
18.0
15.1
3.2
2.7
19.2
19.6
-
-
FMCG
Asian Paints
Neutral
1,021
-
97,968
15,534
17,445
17.7
16.8
18.4
19.6
55.6
52.1
19.7
18.5
34.6
35.6
6.2
5.5
Britannia
Neutral
2,797
-
33,563
8,481
9,795
14.0
14.1
65.5
78.3
42.7
35.7
20.2
16.6
38.3
41.2
3.8
3.3
Stock Watch
June 03, 2016
Company Name
Reco
CMP
Target
Mkt Cap
Sales ( Čcr )
OPM(%)
EPS (Č)
PER(x)
P/BV(x)
RoE(%)
EV/Sales(x)
(Č)
Price ( Č)
( Č cr )
FY16E FY17E
FY16E
FY17E
FY16E
FY17E
FY16E
FY17E
FY16E
FY17E
FY16E
FY17E
FY16E
FY17E
FMCG
Colgate
Neutral
863
-
23,459
4,136
4,632
22.5
23.3
22.2
25.3
38.9
34.1
23.6
21.0
68.6
67.5
5.5
4.9
Dabur India
Neutral
298
-
52,466
9,370
10,265
17.6
17.3
7.3
8.1
40.7
36.8
10.5
9.7
31.7
30.6
5.3
4.8
GlaxoSmith Con*
Accumulate
5,710
6,118
24,015
4,519
5,142
19.6
19.8
164.3
191.2
34.8
29.9
9.6
8.2
30.8
29.9
4.8
4.2
Godrej Consumer
Neutral
1,543
-
52,532
9,003
10,335
18.1
18.7
34.1
41.8
45.3
36.9
9.8
8.4
23.9
24.8
5.8
5.0
HUL
Neutral
869
-
187,981
33,299
35,497
17.1
17.1
18.9
20.0
46.0
43.4
40.3
35.1
87.6
80.8
5.4
5.0
ITC
Accumulate
358
380
287,929
36,837
39,726
38.8
38.7
12.2
13.5
29.3
26.6
8.2
7.1
27.8
26.9
7.4
6.8
Marico
Neutral
249
-
32,138
6,151
6,966
17.2
17.3
5.4
6.4
46.1
38.9
14.5
11.4
33.2
32.4
5.2
4.6
Nestle*
Neutral
6,314
-
60,878
9,393
10,507
22.2
22.3
106.8
121.8
59.1
51.8
20.8
18.7
34.8
36.7
6.3
5.6
Tata Global
Buy
119
137
7,526
8,635
9,072
9.8
9.9
5.8
7.2
20.6
16.6
1.8
1.8
6.8
7.4
0.9
0.8
Procter & Gamble
Buy
6,198
7,369
20,118
2,588
2,939
23.3
23.2
130.2
146.2
47.6
42.4
94.9
91.0
27.6
25.3
7.4
6.4
Hygiene
IT
HCL Tech^
Buy
721
1,000
101,687
37,061
30,781
21.5
20.5
51.4
40.0
14.0
18.0
3.6
2.6
20.1
20.3
2.6
2.7
Infosys
Accumulate
1,260
1,374
289,472
62,441
70,558
27.5
27.5
59.0
65.3
21.4
19.3
4.3
3.9
22.2
22.4
4.1
3.5
TCS
Accumulate
2,647
3,004
521,553
108,646
122,770
28.3
28.3
123.7
141.0
21.4
18.8
7.1
6.5
33.1
34.6
4.3
3.7
Tech Mahindra
Neutral
546
-
53,002
26,524
29,177
16.2
17.0
28.8
33.6
19.0
16.3
3.7
3.1
19.3
19.1
1.7
1.5
Wipro
Buy
540
680
133,480
50,808
56,189
23.7
23.8
37.3
40.7
14.5
13.3
2.8
2.5
19.2
17.7
2.2
1.8
Media
D B Corp
Neutral
369
-
6,777
2,025
2,187
27.4
27.4
17.4
18.9
21.2
19.6
4.8
4.4
22.9
23.7
3.4
3.1
HT Media
Neutral
82
-
1,916
2,495
2,673
12.9
13.2
6.8
7.2
12.1
11.4
0.9
0.9
7.5
7.8
0.4
0.3
Jagran Prakashan
Buy
171
205
5,574
2,170
2,355
27.2
26.2
8.9
9.9
19.2
17.2
4.0
3.5
20.9
20.5
2.5
2.3
Sun TV Network
Neutral
369
-
14,559
2,510
2,763
71.8
71.5
21.9
24.8
16.9
14.9
4.0
3.6
22.8
24.3
5.2
4.7
Hindustan Media
Neutral
268
-
1,967
914
1,016
21.7
21.5
21.9
23.3
12.2
11.5
2.2
1.9
18.0
16.2
1.6
1.3
Ventures
Metals & Mining
Coal India
Buy
306
380
193,533
76,167
84,130
19.9
22.3
22.4
25.8
13.7
11.9
4.9
4.8
35.5
41.0
1.8
1.6
Hind. Zinc
Neutral
168
-
70,985
14,641
14,026
50.4
50.4
17.7
16.0
9.5
10.5
1.5
1.3
16.2
13.2
2.5
2.3
Hindalco
Neutral
106
-
21,858
104,356
111,186
8.7
9.5
6.7
11.1
15.8
9.6
0.6
0.5
3.5
5.9
0.7
0.7
JSW Steel
Neutral
1,379
-
33,325
42,308
45,147
16.4
20.7
(10.3)
49.5
27.9
1.5
1.5
(1.0)
5.6
1.8
1.7
NMDC
Neutral
86
-
34,275
8,237
10,893
46.6
44.5
10.0
11.7
8.7
7.4
1.0
0.8
12.5
13.0
4.0
3.0
SAIL
Neutral
42
-
17,429
45,915
53,954
7.2
10.5
1.5
4.4
28.0
9.6
0.4
0.4
2.3
4.1
1.0
0.9
Vedanta
Neutral
107
-
31,648
71,445
81,910
26.2
26.3
12.9
19.2
8.3
5.6
0.6
0.5
7.2
8.9
0.9
0.7
Tata Steel
Neutral
341
-
33,084
126,760
137,307
8.9
11.3
6.4
23.1
53.5
14.8
1.1
1.0
2.0
7.1
0.8
0.8
Oil & Gas
Cairn India
Neutral
141
-
26,511
11,323
12,490
49.4
51.0
20.7
20.7
6.8
6.9
0.4
0.4
6.4
6.1
1.4
0.8
Stock Watch
June 03, 2016
Company Name
Reco
CMP
Target
Mkt Cap
Sales ( Čcr )
OPM(%)
EPS (Č)
PER(x)
P/BV(x)
RoE(%)
EV/Sales(x)
(Č)
Price ( Č)
( Č cr )
FY16E FY17E
FY16E
FY17E
FY16E
FY17E
FY16E
FY17E
FY16E
FY17E
FY16E
FY17E
FY16E
FY17E
Oil & Gas
GAIL
Neutral
376
-
47,644
64,856
70,933
9.1
9.6
24.0
28.9
15.7
13.0
1.3
1.3
8.8
9.6
0.9
0.8
ONGC
Neutral
213
-
182,146
154,564
145,998
36.8
37.4
20.8
22.6
10.3
9.4
1.0
0.9
10.1
9.7
1.4
1.5
Petronet LNG
Neutral
275
-
20,621
29,691
31,188
5.8
6.2
12.8
13.4
21.5
20.5
3.2
2.9
15.8
14.8
0.8
0.7
Indian Oil Corp
Accumulate
420
455
101,998
359,607
402,760
5.9
6.1
42.5
48.7
9.9
8.6
1.3
1.2
14.1
14.4
0.4
0.3
Reliance Industries
Buy
956
1,150
309,867
304,775
344,392
12.6
13.4
91.3
102.6
10.5
9.3
1.2
1.1
11.8
12.0
0.9
0.8
Pharmaceuticals
Alembic Pharma
Neutral
559
-
10,545
3,274
3,802
26.9
19.4
35.0
28.7
16.0
19.5
7.1
5.3
55.6
31.2
3.1
2.6
Aurobindo Pharma
Accumulate
790
856
46,199
14,923
17,162
22.0
23.0
35.7
42.8
22.1
18.5
6.5
4.9
34.0
30.2
3.5
3.0
Aventis*
Accumulate
4,337
4,738
9,989
2,049
2,375
15.4
17.3
115.4
153.5
37.6
28.3
6.1
4.8
19.3
25.8
4.5
3.8
Cadila Healthcare
Buy
324
400
33,190
9,469
11,246
21.2
22.0
14.9
17.1
21.8
19.0
6.2
4.9
28.8
26.6
3.6
3.0
Cipla
Buy
469
605
37,699
13,979
16,447
20.2
18.6
25.7
27.5
18.3
17.1
3.0
2.6
17.6
16.1
2.7
2.2
Dr Reddy's
Accumulate
3,177
3,476
54,174
15,471
17,479
24.6
24.6
138.2
152.4
23.0
20.8
4.2
3.6
19.7
18.7
3.5
3.1
Dishman Pharma
Neutral
152
-
2,456
1,733
1,906
21.5
21.5
10.1
10.0
15.1
15.2
1.8
1.6
10.5
11.2
1.9
1.6
GSK Pharma*
Neutral
3,515
-
29,774
2,870
3,158
20.0
22.1
59.5
68.3
59.1
51.5
17.4
17.9
28.5
34.3
9.9
9.0
Indoco Remedies
Neutral
287
-
2,647
1,033
1,199
15.9
18.2
9.4
13.6
30.6
21.1
4.5
3.9
15.7
19.7
2.6
2.2
Ipca labs
Buy
414
750
5,218
3,363
3,909
12.9
18.6
13.4
28.0
30.9
14.8
2.2
1.9
7.4
14.0
1.9
1.6
Lupin
Buy
1,476
1,809
66,516
13,702
15,912
23.7
26.4
50.5
58.1
29.2
25.4
6.0
4.9
22.9
21.4
5.4
4.3
Sun Pharma
Buy
747
950
179,744
28,163
32,610
25.8
30.7
17.4
26.9
42.9
27.8
4.1
3.5
13.0
16.6
5.9
4.9
Power
Tata Power
Neutral
72
-
19,541
35,923
37,402
22.6
22.8
4.1
5.2
17.8
14.0
1.4
1.3
7.5
9.3
1.5
1.4
NTPC
Neutral
145
-
119,436
87,271
99,297
23.5
23.5
11.8
13.3
12.3
10.9
1.4
1.3
11.5
12.2
2.4
2.1
Power Grid
Accumulate
150
170
78,552
20,702
23,361
86.7
86.4
12.1
13.2
12.4
11.4
1.8
1.6
15.6
15.1
8.7
8.1
Real Estate
MLIFE
Buy
439
554
1,800
826
1,133
20.1
21.8
22.6
30.7
19.4
14.3
1.2
1.1
6.0
7.4
4.1
2.8
Telecom
Bharti Airtel
Neutral
366
-
146,285
101,748
109,191
32.1
31.7
12.0
12.5
30.5
29.3
2.1
2.0
6.9
6.7
2.1
1.9
Idea Cellular
Neutral
118
-
42,612
34,282
36,941
32.0
31.5
5.9
6.2
20.1
19.1
1.8
1.7
9.9
9.3
1.8
1.7
zOthers
Abbott India
Neutral
4,622
-
9,821
2,715
3,153
14.5
14.1
134.3
152.2
34.4
30.4
8.6
7.1
27.4
25.6
3.4
2.8
Bajaj Electricals
Buy
226
268
2,278
4,612
5,351
5.6
5.7
9.5
12.4
23.8
18.3
5.3
4.7
23.7
25.9
0.5
0.4
Finolex Cables
Neutral
349
-
5,344
2,520
2,883
12.2
12.0
12.7
14.2
27.6
24.6
3.8
3.3
13.6
13.5
1.9
1.6
Goodyear India*
Accumulate
505
582
1,166
1,800
1,600
11.7
11.5
58.7
52.9
8.6
9.6
1.9
1.7
24.6
18.7
0.4
0.4
Hitachi
Neutral
1,277
-
3,473
1,779
2,081
7.8
8.8
21.8
33.4
58.6
38.2
9.5
7.7
17.4
22.1
2.0
1.7
Jyothy Laboratories
Neutral
289
-
5,243
1,620
1,847
11.5
11.5
7.3
8.5
39.7
34.2
5.1
4.8
13.3
14.4
3.0
2.5
Stock Watch
June 03, 2016
Company Name
Reco
CMP
Target
Mkt Cap
Sales ( Čcr )
OPM(%)
EPS (Č)
PER(x)
P/BV(x)
RoE(%)
EV/Sales(x)
(Č)
Price ( Č)
( Č cr )
FY16E
FY17E
FY16E
FY17E
FY16E
FY17E
FY16E
FY17E
FY16E
FY17E
FY16E
FY17E
FY16E
FY17E
zOthers
MRF
Buy
33,348
45,575
14,143
20,316
14,488
21.4
21.1
5,488.0
3,798.0
6.1
8.8
2.1
1.7
41.1
21.2
0.6
0.9
Page Industries
Neutral
14,179
-
15,815
1,929
2,450
19.8
20.1
229.9
299.0
61.7
47.4
27.2
18.9
52.1
47.1
8.3
6.5
Relaxo Footwears
Neutral
440
-
5,277
1,767
2,152
12.3
12.5
19.3
25.1
22.8
17.5
5.6
4.3
27.7
27.8
3.1
2.5
Siyaram Silk Mills
Buy
1,044
1,354
979
1,619
1,799
11.6
11.6
93.5
104.9
11.2
10.0
1.9
1.6
17.1
16.4
0.8
0.8
Styrolution ABS India* Neutral
603
-
1,060
1,271
1,440
8.6
9.2
32.0
41.1
18.8
14.7
1.9
1.7
10.7
12.4
0.8
0.7
TVS Srichakra
Buy
2,332
2,932
1,786
2,035
2,252
15.9
15.3
248.6
268.1
9.4
8.7
4.1
3.0
43.6
33.9
0.9
0.8
HSIL
Accumulate
268
310
1,940
2,123
2,384
16.1
16.5
15.0
18.9
17.8
14.2
1.4
1.3
8.0
9.4
1.3
1.1
Kirloskar Engines India
Neutral
247
-
3,571
2,403
2,554
8.6
9.9
9.2
10.5
26.9
23.5
2.6
2.5
9.7
10.7
1.1
1.0
Ltd
M M Forgings
Buy
449
546
542
511
615
21.7
21.6
43.1
55.8
10.4
8.1
1.9
1.6
19.9
21.2
1.3
1.0
Banco Products (India) Neutral
138
-
989
1,208
1,353
11.0
12.3
10.8
14.5
12.8
9.6
1.5
1.3
11.9
14.5
0.8
0.7
Competent Automobiles Neutral
143
-
88
1,040
1,137
3.2
3.1
25.7
28.0
5.6
5.1
0.8
0.7
15.0
14.3
0.1
0.1
Nilkamal
Neutral
1,206
-
1,799
1,871
2,031
10.7
10.5
63.2
69.8
19.1
17.3
3.1
2.7
17.6
16.6
1.0
0.9
Visaka Industries
Buy
139
162
221
1,020
1,120
8.7
9.1
13.9
20.1
10.0
6.9
0.6
0.6
6.4
8.7
0.4
0.4
Transport Corporation of
Neutral
286
-
2,172
2,830
3,350
8.8
9.0
14.4
18.3
19.9
15.6
3.1
2.7
15.4
17.1
0.9
0.8
India
Elecon Engineering
Neutral
58
-
630
1,359
1,482
10.3
13.7
0.8
3.9
72.0
14.9
1.2
1.1
1.6
7.8
0.8
0.7
Surya Roshni
Buy
162
201
712
2,992
3,223
8.1
8.4
14.7
18.3
11.1
8.9
1.0
0.9
9.7
11.0
0.5
0.5
MT Educare
Neutral
181
-
722
286
366
18.3
17.7
7.7
9.4
23.5
19.3
4.9
4.3
20.2
21.1
2.4
1.9
Radico Khaitan
Buy
90
125
1,198
1,543
1,659
12.6
13.0
5.8
6.3
15.6
14.2
1.3
1.2
8.5
8.6
1.2
1.1
Garware Wall Ropes
Buy
360
460
787
828
898
11.2
10.3
28.3
29.0
12.7
12.4
2.1
1.8
16.8
14.9
0.9
0.8
Wonderla Holidays
Neutral
388
-
2,191
206
308
44.0
43.6
9.0
12.9
43.1
30.1
5.9
5.3
13.7
17.8
10.4
6.9
Linc Pen & Plastics
Accumulate
207
235
307
344
382
9.1
9.1
12.4
13.1
16.7
15.8
3.0
2.6
18.0
16.7
1.0
0.9
The Byke Hospitality
Neutral
169
-
679
222
287
20.5
20.5
5.6
7.6
30.1
22.4
5.7
4.7
18.9
20.8
3.1
2.4
Interglobe Aviation
Neutral
1,013
-
36,502
17,022
21,122
20.7
14.5
63.9
53.7
15.9
18.9
23.8
19.5
149.9
103.2
2.2
1.8
Coffee Day Enterprises
Neutral
262
-
5,387
2,692
2,964
17.0
18.6
-
4.7
-
55.2
3.2
3.0
0.2
5.5
2.4
2.3
Ltd
Navneet Education
Neutral
86
-
2,058
998
1,062
24.1
24.0
5.8
6.1
15.0
14.2
3.3
2.9
22.0
20.6
2.2
2.0
Navkar Corporation
Buy
194
265
2,759
347
408
43.2
42.9
6.7
6.8
29.0
28.6
2.1
2.0
7.3
6.9
8.5
7.7
UFO Moviez
Neutral
528
-
1,457
558
619
32.0
33.2
22.5
30.0
23.5
17.6
2.8
2.4
12.0
13.8
2.4
2.0
VRL Logistics
Neutral
266
-
2,431
1,725
1,902
16.5
16.7
12.2
14.6
21.9
18.3
4.6
4.0
20.8
21.9
1.6
1.4
Team Lease Serv.
Neutral
924
-
1,580
2,565
3,229
1.3
1.5
15.2
22.8
60.9
40.6
4.9
4.4
8.0
10.7
0.5
0.4
Stock Watch
June 03, 2016
Company Name
Reco
CMP
Target Mkt Cap
Sales ( Čcr )
OPM(%)
EPS (Č)
PER(x)
P/BV(x)
RoE(%)
EV/Sales(x)
(Č)
Price ( Č)
( Č cr )
FY16E FY17E FY16E FY17E FY16E FY17E FY16E FY17E FY16E FY17E FY16E FY17E FY16E FY17E
zOthers
S H Kelkar & Co.
Neutral
215
-
3,109
928
1,036
15.3
15.1
4.9
6.1
43.6
35.2
4.1
3.8
9.4
10.7
3.3
2.9
Quick Heal
Neutral
233
-
1,630
339
408
27.8
27.3
7.1
7.7
32.9
30.1
2.8
2.8
8.5
9.3
3.8
3.2
Narayana Hrudaya
Neutral
313
-
6,393
1,603
1,873
10.9
11.5
1.0
2.6
328.4
118.3
7.9
7.3
2.4
6.1
4.1
3.5
Manpasand Bever.
Neutral
548
-
2,745
540
836
19.9
19.6
10.2
16.9
53.5
32.5
4.3
3.9
8.1
12.0
4.7
3.0
Source: Company, Angel Research; Note: *December year end; #September year end; &October year end; Price as on June 02, 2016
Market Outlook
June 03, 2016
Research Team Tel: 022 - 39357800
DISCLAIMER
Angel Broking Private Limited (hereinafter referred to as “Angel”) is a registered Member of National Stock Exchange of India Limited,
Bombay Stock Exchange Limited and Metropolitian Stock Exchange of India Limited. It is also registered as a Depository Participant with
CDSL and Portfolio Manager with SEBI. It also has registration with AMFI as a Mutual Fund Distributor. Angel Broking Private Limited is a
registered entity with SEBI for Research Analyst in terms of SEBI (Research Analyst) Regulations, 2014 vide registration number
INH000000164. Angel or its associates has not been debarred/ suspended by SEBI or any other regulatory authority for accessing
/dealing in securities Market. Angel or its associates including its relatives/analyst do not hold any financial interest/beneficial ownership
of more than 1% in the company covered by Analyst. Angel or its associates/analyst has not received any compensation / managed or co
-managed public offering of securities of the company covered by Analyst during the past twelve months. Angel/analyst has not served as
an officer, director or employee of company covered by Analyst and has not been engaged in market making activity of the company
covered by Analyst.
This document is solely for the personal information of the recipient, and must not be singularly used as the basis of any investment
decision. Nothing in this document should be construed as investment or financial advice. Each recipient of this document should make
such investigations as they deem necessary to arrive at an independent evaluation of an investment in the securities of the companies
referred to in this document (including the merits and risks involved), and should consult their own advisors to determine the merits and
risks of such an investment.
Reports based on technical and derivative analysis center on studying charts of a stock's price movement, outstanding positions and
trading volume, as opposed to focusing on a company's fundamentals and, as such, may not match with a report on a company's
fundamentals.
The information in this document has been printed on the basis of publicly available information, internal data and other reliable sources
believed to be true, but we do not represent that it is accurate or complete and it should not be relied on as such, as this document is for
general guidance only. Angel Broking Pvt. Limited or any of its affiliates/ group companies shall not be in any way responsible for any
loss or damage that may arise to any person from any inadvertent error in the information contained in this report. Angel Broking Pvt.
Limited has not independently verified all the information contained within this document. Accordingly, we cannot testify, nor make any
representation or warranty, express or implied, to the accuracy, contents or data contained within this document. While Angel Broking
Pvt. Limited endeavors to update on a reasonable basis the information discussed in this material, there may be regulatory, compliance,
or other reasons that prevent us from doing so.
This document is being supplied to you solely for your information, and its contents, information or data may not be reproduced,
redistributed or passed on, directly or indirectly.
Neither Angel Broking Pvt. Limited, nor its directors, employees or affiliates shall be liable for any loss or damage that may arise from or
in connection with the use of this information.
Note: Please refer to the important ‘Stock Holding Disclosure' report on the Angel website (Research Section). Also, please refer to the
latest update on respective stocks for the disclosure status in respect of those stocks. Angel Broking Pvt. Limited and its affiliates may have
investment positions in the stocks recommended in this report.