Market Outlook
August 02, 2016
Market Cues
Domestic Indices
Chg (%)
(Pts)
(Close)
Indian markets are expected to open flat tracking SGX Nifty.
BSE Sensex
(0.2)
(49)
28,003
U.S. stocks lost momentum to finish mostly lower Monday as crude-oil futures
Nifty
(0.0)
(2)
8,637
returned to bear-market territory and weaker-than-expected manufacturing data
Mid Cap
0.4
48
12,709
raised doubts about economy strength. S&P 500 was down 0.1%, after the large-cap
Small Cap
0.1
12
12,322
index hit a record intraday high of 2,178.29. A 3.3% drop in Energy sector dragged
Bankex
(1.2)
(257)
21,422
S&P 500 into negative territory, outweighing modest gains in health-care and tech
stocks. Nasdaq Composite Index climbed up 0.4%, to end at 5,184.20, boosted by
appetite for tech giants, including a 1.8% jump in shares of Apple Inc.
Global Indices
Chg (%)
(Pts)
(Close)
Dow Jones
(0.2)
(28)
18,405
U.K. stocks erased earlier gains and ended lower on Monday, following data
confirming sharp deterioration in British manufacturing activity in the wake of the
Nasdaq
0.4
22
5,184
Brexit vote. FTSE 100 lost 0.5% to close at 6,694 after having been up much as
FTSE
(0.5)
(30)
6,694
0.7%. The index had earlier traded above its 2016 closing high of 6,750.43 logged
Nikkei
0.4
67
16,636
on July 27. The biggest riser was the giant mining group Anglo American, up 2.2%.
Hang Seng
1.1
238
22,129
Equity benchmarks ended marginally lower with both, the Sensex and Nifty closing
Shanghai Com
(0.9)
(26)
2,953
in red. We sense market is 'entering into a no-news kind of trade' and that is what
caused market taking a break from its rally mode. Country's largest private sector
Advances / Declines
BSE
NSE
lender ICICI Bank fell over 5% after bad asset quality performance in 1QFY2017.
Advances
1,179
609
News Analysis & Result Review
Declines
1,590
1,009
Results Review: Tech Mahindra
Unchanged
142
68
NHPC to raise `4,500cr after Subansiri project clearance
Detailed analysis on Pg2
Volumes (` Cr)
Investor’s Ready Reckoner
BSE
4,087
Key Domestic & Global Indicators
NSE
24,270
Stock Watch: Latest investment recommendations on 150+ stocks
Refer Pg5 onwards
Net Inflows (` Cr)
Net
Mtd
Ytd
FII
209
11,339
30,883
Top Picks
CMP
Target
Upside
MFs
137
(274)
9,070
Company
Sector
Rating
(`)
(`)
(%)
Amara Raja
Auto/Auto Ancillary
Buy
924
1,076
16.5
Top Gainers
Price (`)
Chg (%)
HCL Tech
IT
Buy
781
1,000
28.1
Bajfinance
11,227
8.4
LIC Housing
Financials
Accumulate
522
582
11.5
Muthootfin
356
8.0
Bharat Electronics
Capital Goods
Accumulate
1,241
1,414
14.0
Iifl
289
7.3
Navkar Corporation Others
Buy
210
265
26.1
More Top Picks on Pg4
Jindalstel
89
6.9
Voltas
371
6.0
Key Upcoming Events
Previous
Consensus
Date
Region
Event Description
Reading
Expectations
Top Losers
Price (`)
Chg (%)
Aug 3
China
PMI Manufacturing
49.9
50.0
Icicibank
249
(5.2)
Aug 4
US
Initial Jobless claims
266.0
265.0
Justdial
531
(4.4)
Aug 4
US
Unemployment rate
4.9
4.8
Lt
1,494
(4.1)
Aug 5
UK
BOE Annouces rates
0.50
0.25
Ashokley
92
(4.0)
Aug 5
US
Change in Nonfarm payrolls
287.0
175.0
6.(
Dcbbank
107
(3.9)
More Events on Pg5
As on August 1, 2016
Market Outlook
August 02, 2016
Result Review
Tech Mahindra (CMP: `490 / TP: /Upside:)
For 1QFY2017, the company posted results lower than expected. On sales the
company posted sales of `6,921cr V/s `6,880cr expected and V/s `6,884cr in
4QFY2016, a QoQ de-growth of 0.5%. In US$ terms, it came in at US$ 1,032mn
V/s US$1,027mn expected and V/s US$1,023mn, a QoQ growth of 0.9%.
The top line growth, during the quarter was driven by USA (which was 49.0% of
sales V/s 46.8% in 4QFY2016), while ROW was a drag, constituting around
22.8% V/s 24.7% in 4QFY2016. In terms of Industries, Manufacturing and BFSI
Industries were the key drivers of the top-line growth of the company.
Manufacturing, constituted around 18.1% of sales V/s 17.1% in 4QFY2016, while
BFSI contributed around 11.3% of sales V/s 10.6% of sales in 4QFY2016. In terms
of client additions, the company added 11 clients, of which 2 were in US$20mn+,
1 were in US$10mn+.
On operating profit front, the EBIT margins came in at 12.0% V/s 12.3% expected
and V/s 13.7% in 4QFY2016, QoQ dip of 176bps. On utilization levels, the
company clocked 78% v/s 77% in 4QFY2016, while attrition remained same at
21%. Thus, the Adj. net profit came in at `750cr V/s `816crexpected and V/s
`897cr in 4QFY2016, a QoQ de-growth of 16.4%. While our estimates might get
revised, we maintain our buy rating.
Y/E
Sales OPM
PAT
EPS ROE P/E P/BV EV/EBITDA EV/Sales
Mar
(` cr)
(%)
(` cr)
(`)
(%)
(x)
(x)
(x)
(x)
FY2017E
30,347
17.0
3,633
37.5
21.8
13.0
2.8
8.1
1.4
FY2018E
33,685
17.0
3,999
41.3
20.7
11.9
2.5
6.9
1.2
NHPC to raise `4,500cr after Subansiri project clearance
As per media reports, NHPC is working on `3,000cr diversification plan to venture
into Solar & Wind Power projects. Company also plans to raise `4,500cr through
private placement, but is waiting National Green Tribunal (NGT) clearance for the
2,000MW Lower Subansiri Hydroelectric project at Gerukamukh along the Assam-
Arunachal Pradesh border.
Following protests from pressure groups, project was stalled since Dec-2011 on
grounds that seismic activity could pose threat to people in downstream areas. The
project was expected to be completed by 2012.
This fund raised would be used to meet new capex. NHPC completed 70% work
on project by Dec-2011, which was scheduled to go on-stream in Dec-2012.
NHPC plans to add 430MW of Solar and Wind power projects, as it has inked
deals with Andhra, Tamil Nadu & Uttar Pradesh Government.
Also, NHPC has joined U. P. to develop 50MW Solar power project. This project is
to be executed through Uttar Pradesh New and Renewable Energy Development
Agency (UPNEDA).
NHPC has already reached final stage of completion of 50MW Wind project in
Jaisalmer, Rajasthan. The company has also received letter of intent to set up 50-
MW solar power project in Tamil Nadu and has also signed deal with A.P.
government for setting up 200MW project but much will hinge on feasibility study.
Market Outlook
August 02, 2016
Economic and Political News
Govt clears 89 single-brand retail, 1 multi-brand proposals
Centre provides `6,403cr to Andhra as financial assistance
India's total Power generation capacity crosses 300GW mark
Corporate News
Wipro Infra Engg to acquired Israel based Givon in all-cash deal
GVK's Goindwal Sahib power project faces coal hurdles
NTPC bets big on domestic coal-driven growth
ICICI Bank, Apollo to set up Indian Asset Reconstruction company
Quarterly Bloomberg Brokers Consensus Estimate
HCL Technologies Ltd - Aug 3, 2016
Particulars (` cr)
1QFY17E
1QFY16
y-o-y (%)
4QFY16
q-o-q (%)
Net sales
10,780
9,777
10.3
10,698
0.8
EBITDA
2,388
2,100
13.7
2,379
0.4
EBITDA margin (%)
22.1
21.5
22.2
Net profit
1,920
1,783
7.7
1,926
(0.3)
Cadila Healthcare Ltd - Aug 3, 2016
Particulars (` cr)
1QFY17E
1QFY16
y-o-y (%)
4QFY16
q-o-q (%)
Net sales
2519.8
2421.7
4.05
2375.5
6.1
EBITDA
558.9
620.33
(9.9)
606.3
(7.8)
EBITDA margin (%)
22.1
25.6
22.2
Net profit
385.6
353.4
9.1
388.7
(0.8)
Tata Power Co Ltd Consol- Aug 4, 2016
Particulars (` cr)
1QFY17E
1QFY16
y-o-y (%)
4QFY16
q-o-q (%)
Net sales
9,250
9,235
0.2
9,375
(1.3)
EBITDA
2,000
2,181
(8.3)
1,913
4.5
EBITDA margin (%)
21.6
23.6
20.4
Net profit
337
241
39.6
360
(6.5)
Siemens Ltd - Aug 4, 2016
Particulars (` cr)
3QSY16E
3QSY15
y-o-y (%)
2QSY16
q-o-q (%)
Net sales
2,498
2,322
7.6
2,725
(8.3)
EBITDA
273
253
7.7
306
(11.0)
EBITDA margin (%)
10.9
10.9
11.2
Net profit
163
168
(3.2)
177
(8.2)
Cummins India Ltd - Aug 4, 2016
Particulars (` cr)
1QFY17E
1QFY16
y-o-y (%)
4QFY16
q-o-q (%)
Net sales
1,307
1,282
1.9
1,038
25.9
EBITDA
204
218
(6.6)
171
19.2
EBITDA margin (%)
15.6
17.0
16.5
Net profit
198
211
(5.9)
164
20.9
Market Outlook
August 02, 2016
Top Picks ★★★★★
Large Cap
Market Cap
CMP
Target
Upside
Company
Rationale
(` Cr)
(`)
(`)
(%)
To outpace battery industry growth due to better technological
Amara Raja Batteries
15,778
924
1,076
16.5
products leading to market share gains in both the automotive
OEM and replacement segments.
Uptick in defense capex by government, coupled with BELs
Bharat Electronics
29,777
1,241
1,414
14.0
strong market positioning, indicate good times ahead for BEL.
HCL Tech
1,10,166
781
1,000
28.1
Stock is trading at attractive valuations & factors all bad news.
Back on the growth trend, expect a long term growth of 14% to
Infosys
2,49,219
1,085
1,374
26.6
be a US$20bn in FY2020.
Continues to grow its retail loan book at healthy pace with
LIC Housing Fin.
26,336
522
582
11.5
improvement in asset quality. Expect LICHF to post a healthy
loan book which is likely to reflect in a strong earnings growth.
Strong market positioning within the domestic AC markets to
Voltas
12,266
371
407
9.8
continue, EMP business set to revive
Source: Company, Angel Research
Mid Cap
Market Cap
CMP
Target
Upside
Company
Rationale
(` Cr)
(`)
(`)
(%)
With a focus on the low and medium income (LMI) consumer
Dewan Housing
6,509
223
270
21.0
segment, the company has increased its presence in tier-II & III
cities where the growth opportunity is immense.
Strong loan growth backed by diversified loan portfolio and
Equitas Holdings
6,541
195
235
20.5
adequate CAR. ROE & ROA likely to remain decent as risk of
dilution remains low. Attractive valuations considering growth.
Expectations of above average monsoon augurs well for
Goodyear India
1,208
524
631
20.5
Goodyear India as it derives ~50% of its turnover from farm
tyre segment.
Commencement of new projects, downtrend in the interest rate
IL&FS Transport
2,357
72
93
29.8
cycle, to lead to stock re-rating
Economic recovery to have favourable impact on advertising &
Jagran Prakashan
5,897
180
205
13.6
circulation revenue growth. Further, the acquisition of a radio business
(Radio City) would also boost the company`s revenue growth.
Speedier execution and speedier sales, strong revenue visibility
Mahindra Lifespace
1,809
441
554
25.7
in short-to-long run, attractive valuations
Massive capacity expansion along with rail advantage at ICD
Navkar Corporation
2,998
210
265
26.1
as well CFS augurs well for the company
Earnings boost on back of stable material prices and
Radico Khaitan
1,212
91
125
37.2
favourable pricing environment. Valuation discount to peers
provides additional comfort
Strong brands and distribution network would boost growth
Siyaram Silk Mills
942
1,005
1,347
34.0
going ahead. Stock currently trades at an inexpensive
valuation.
Source: Company, Angel Research
Market Outlook
August 02, 2016
Key Upcoming Events
Result Calendar
Date
Company
Aug 2, 2016
Indian Bank, UFO Moviez
Aug 3, 2016
Ramco Cements, HCL Tech, Cadila Healthcare, Dishman Pharma, The Byke Hospitality
Aug 4, 2016
Siemens, Cummins India, Hindustan Media Ventures, Kirloskar Engines India Ltd, Tata Power Co.
Aug 5, 2016
Bharat Forge, LMW, GlaxoSmith Con, Quick Heal
Aug 6, 2016
Amara Raja Batteries, Mangalam Cement, Union Bank, Andhra Bank
Aug 8, 2016
Subros, Colgate, Britannia, Vesuvius India, Sterling Tools
Aug 9, 2016
Apollo Tyres, Finolex Cables, Lupin, Team Lease Serv., S H Kelkar & Co.
Aug 10, 2016
M&M, Motherson Sumi, Thermax, ITD Cementation
Rural Elec.Corp., Page Industries, MRF, Jyothy Laboratories, MM Forging, Tide Water Oil India, Coffee Day Enterprises
Aug 11, 2016
Ltd
Aug 12, 2016
Automotive Axle, Hindalco, Bajaj Electrical, Cravatex, NHPC
Source: Bloomberg, Angel Research
Global economic events release calendar
Date
Time
Country
Event Description
Unit
Period
Bloomberg Data
Last Reported Estimated
Aug 3, 2016
6:30AM China
PMI Manufacturing
Value
Jul
49.90
50.00
Aug 4, 2016
6:00PM US
Initial Jobless claims
Thousands
Jul 30
266.00
265.00
6:00PM US
Unnemployment rate
%
Jul
4.90
4.80
Aug 5, 2016
4:30PM UK
BOE Announces rates
% Ratio
Aug 4
0.50
0.25
6:00PM US
Change in Nonfarm payrolls
Thousands
Jul
287.00
175.00
Aug 8, 2016
China
Exports YoY%
% Change
Jul
(4.80)
(3.00)
Aug 9, 2016
7:00AM China
Consumer Price Index (YoY)
% Change
Jul
1.90
1.80
2:00PM UK
Industrial Production (YoY)
% Change
Jun
1.40
--
11:00AM India
RBI Reverse Repo rate
%
Aug 9
6.00
--
11:00AM India
RBI Repo rate
%
Aug 9
6.50
--
11:00AM India
RBI Cash Reserve ratio
%
Aug 9
4.00
--
Aug 10, 2016
India
Imports YoY%
% Change
Jul
(7.30)
--
India
Exports YoY%
% Change
Jul
1.30
--
Aug 12, 2016 2:30PM Euro Zone
Euro-Zone GDP s.a. (QoQ)
% Change
2Q P
0.30
--
7:30AM China
Industrial Production (YoY)
% Change
Jul
6.20
6.20
US
Producer Price Index (mom)
% Change
Jul
0.80
--
5:30PM India
Industrial Production YoY
% Change
Jun
1.20
--
11:30AM Germany
GDP nsa (YoY)
% Change
2Q P
1.30
--
Aug 15, 2016 12:00PM India
Monthly Wholesale Prices YoY%
% Change
Jul
1.62
--
Aug 16, 2016 6:00PM US
Housing Starts
Thousands
Jul
1,189.00
--
6:00PM US
Building permits
Thousands
Jul
1,153.00
--
2:00PM UK
CPI (YoY)
% Change
Jul
0.50
--
6:00PM US
Consumer price index (mom)
% Change
Jul
0.20
--
6:45PM US
Industrial Production
%
Jul
0.60
--
Aug 17, 2016 2:30PM Euro Zone
Euro-Zone CPI (YoY)
%
Jul F
0.20
--
Aug 18, 2016 7:30PM Euro Zone
Euro-Zone Consumer Confidence
Value
Aug A
(7.90)
--
Source: Bloomberg, Angel Research
Market Outlook
August 2, 2016
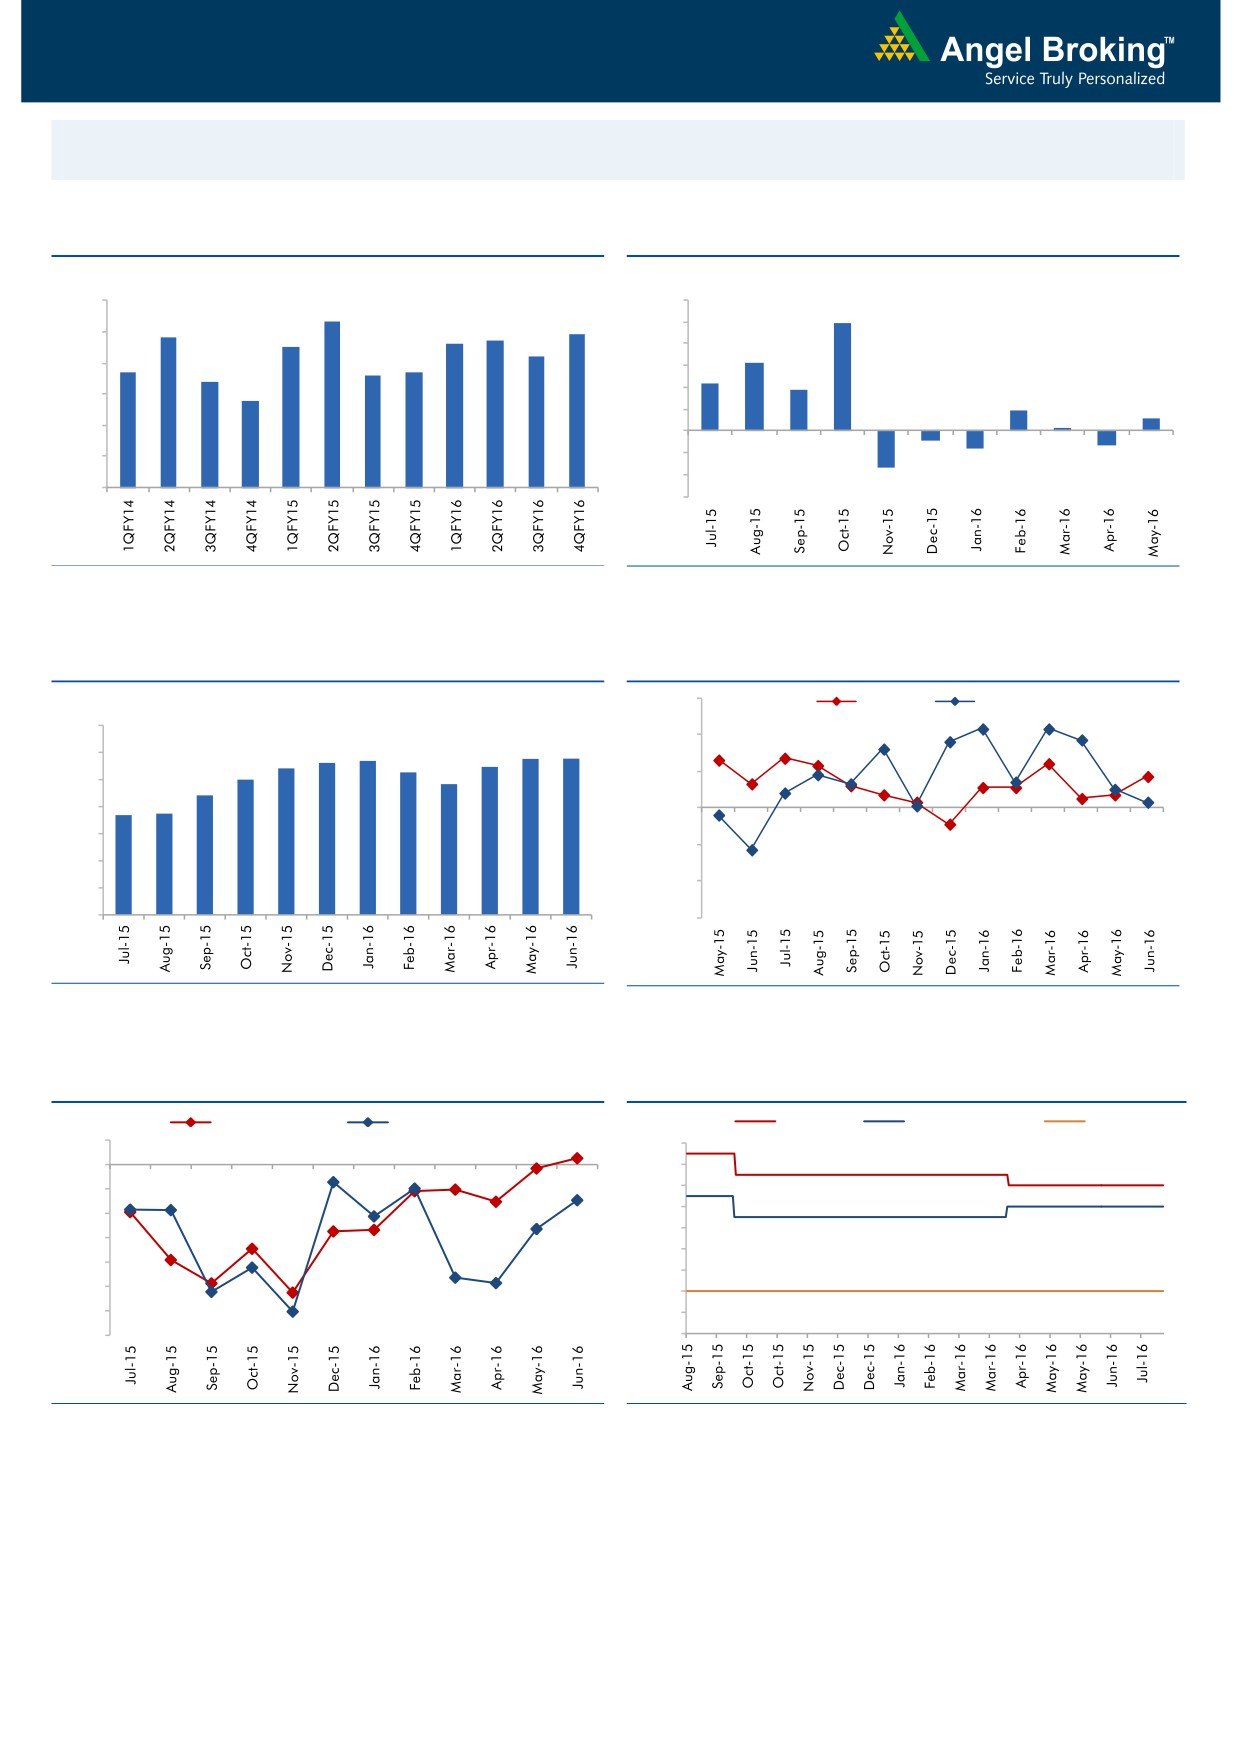
Macro watch
Exhibit 1: Quarterly GDP trends
Exhibit 2: IIP trends
(%)
(%)
9.0
8.3
12.0
9.9
7.8
7.7
7.9
10.0
8.0
7.5
7.6
7.2
8.0
6.3
6.7
6.6
6.7
7.0
6.4
6.0
4.3
3.7
5.8
4.0
6.0
1.9
1.2
2.0
0.3
5.0
-
4.0
(2.0)
(0.9)
(1.3)
(1.6)
(4.0)
3.0
(3.4)
(6.0)
Source: CSO, Angel Research
Source: MOSPI, Angel Research
Exhibit 3: Monthly CPI inflation trends
Exhibit 4: Manufacturing and services PMI
56.0
Mfg. PMI
Services PMI
(%)
7.0
54.0
5.7
5.8
5.8
5.4
5.6
5.5
6.0
5.3
5.0
4.8
52.0
5.0
4.4
3.7
3.7
4.0
50.0
3.0
48.0
2.0
46.0
1.0
-
44.0
Source: MOSPI, Angel Research
Source: Market, Angel Research; Note: Level above 50 indicates expansion
Exhibit 5: Exports and imports growth trends
Exhibit 6: Key policy rates
(%)
Exports yoy growth
Imports yoy growth
(%)
Repo rate
Reverse Repo rate
CRR
5.0
7.50
0.0
7.00
(5.0)
6.50
6.00
(10.0)
5.50
(15.0)
5.00
(20.0)
4.50
(25.0)
4.00
(30.0)
3.50
(35.0)
3.00
Source: Bloomberg, Angel Research
Source: RBI, Angel Research
Market Outlook
August 2, 2016
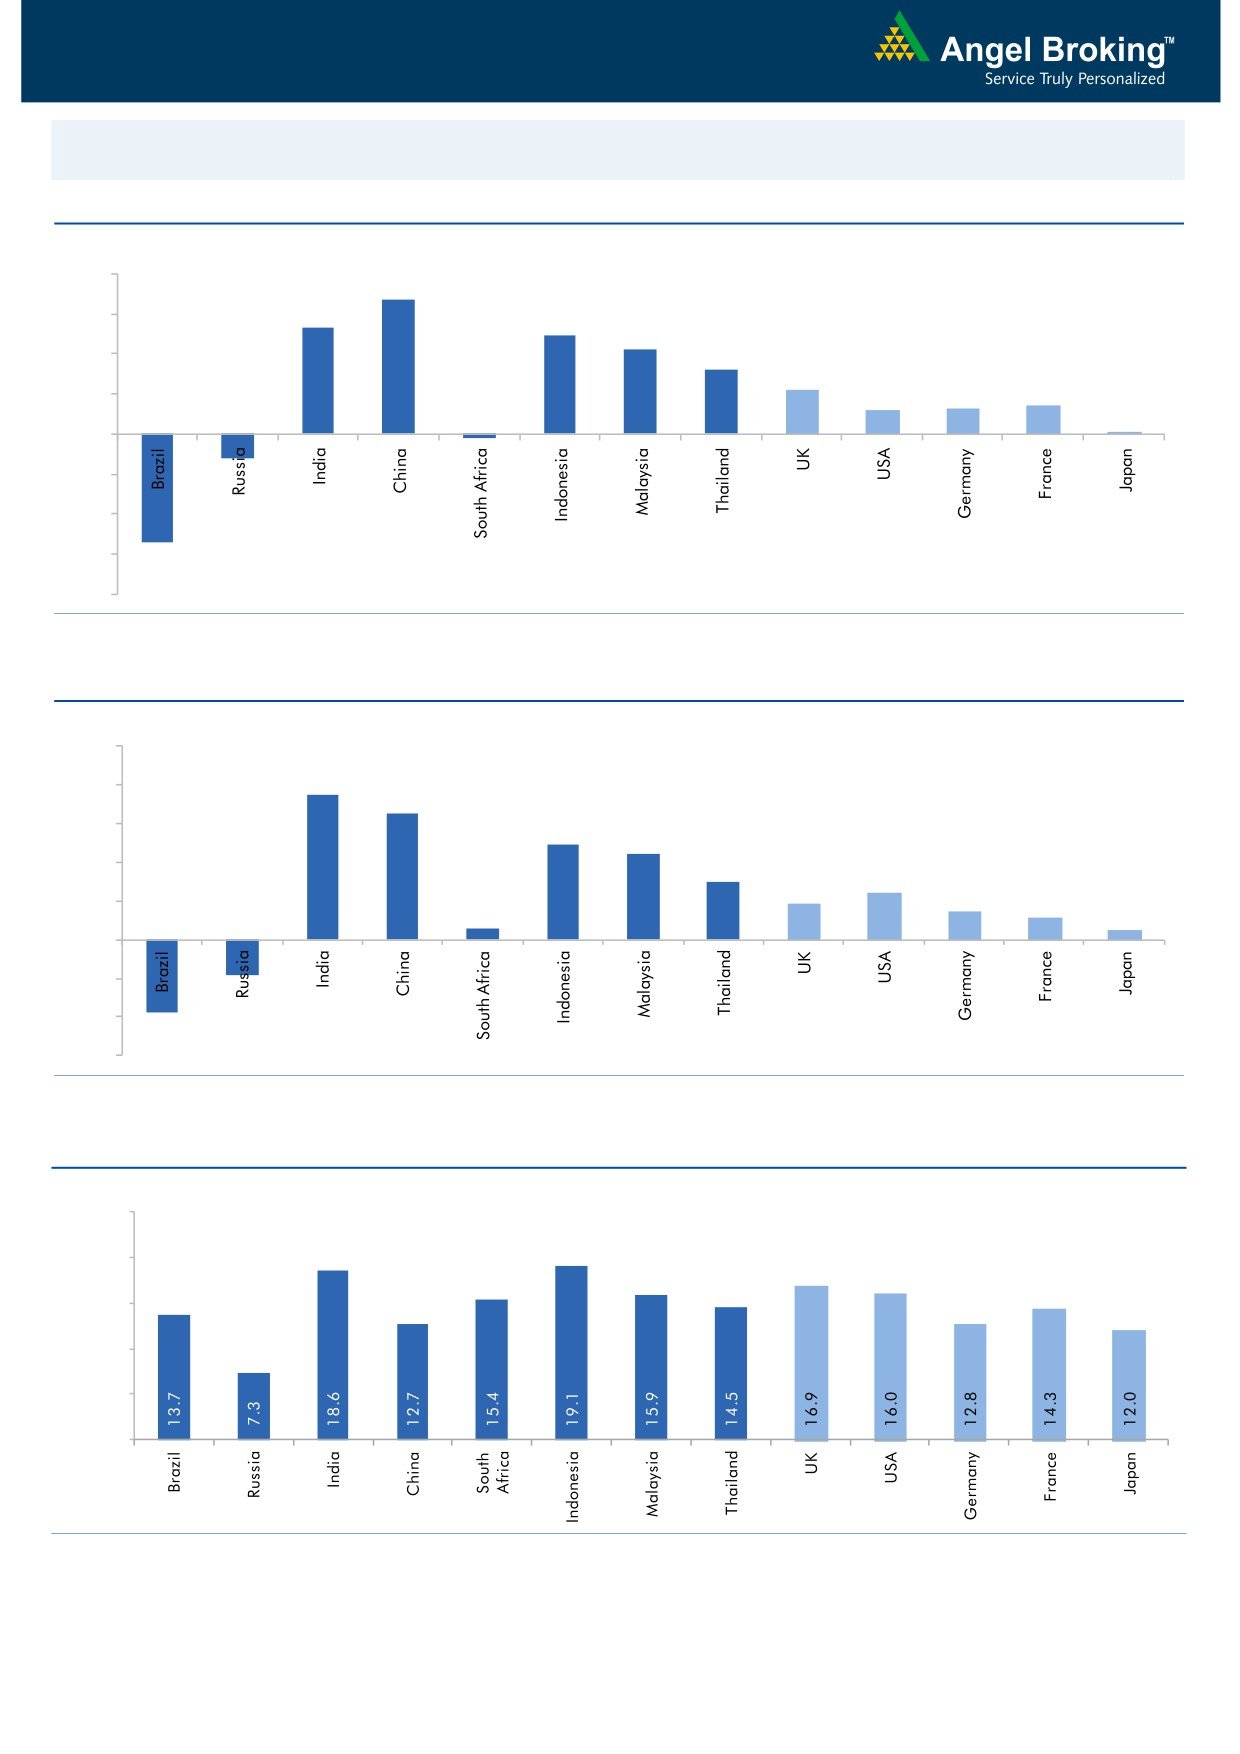
Global watch
Exhibit 1: Latest quarterly GDP Growth (%, yoy) across select developing and developed countries
(%)
8.0
6.7
6.0
5.3
4.9
4.2
4.0
3.2
2.2
1.3
1.4
2.0
1.2
0.1
-
(2.0)
(4.0)
(1.2)
(6.0)
(5.4)
(0.2)
(8.0)
Source: Bloomberg, Angel Research
Exhibit 2: 2016 GDP Growth projection by IMF (%, yoy) across select developing and developed countries
(%)
10.0
7.5
8.0
6.5
6.0
4.9
4.4
4.0
3.0
2.4
1.9
1.5
2.0
1.1
0.6
0.5
(3.8)
(1.8)
-
(2.0)
(4.0)
(6.0)
Source: IMF, Angel Research
Exhibit 3: One year forward P-E ratio across select developing and developed countries
(x)
25.0
20.0
15.0
10.0
5.0
-
Source: IMF, Angel Research
Market Outlook
August 2, 2016
Exhibit 4: Relative performance of indices across globe
Returns (%)
Country
Name of index
Closing price
1M
3M
1YR
Brazil
Bovespa
56,756
10.1
6.0
16.5
Russia
Micex
1,947
3.0
0.7
19.0
India
Nifty
8,637
5.3
10.6
1.3
China
Shanghai Composite
2,953
0.7
0.5
(28.4)
South Africa
Top 40
46,150
0.4
(0.7)
(0.3)
Mexico
Mexbol
46,807
1.8
2.5
4.2
Indonesia
LQ45
926
12.5
9.7
10.1
Malaysia
KLCI
1,665
1.9
(1.6)
(3.3)
Thailand
SET 50
956
6.6
6.5
(0.8)
USA
Dow Jones
18,405
4.0
3.5
4.6
UK
FTSE
6,694
2.9
7.2
0.1
Japan
Nikkei
16,636
6.9
(4.1)
(19.2)
Germany
DAX
10,331
6.7
2.0
(11.2)
France
CAC
4,409
4.1
0.9
(15.1)
Source: Bloomberg, Angel Research
Stock Watch
August 02, 2016
Company Name
Reco
CMP
Target
Mkt Cap
Sales ( Čcr )
OPM(%)
EPS (Č)
PER(x)
P/BV(x)
RoE(%)
EV/Sales(x)
(Č)
Price ( Č)
( Č cr )
FY17E FY18E
FY17E
FY18E
FY17E
FY18E
FY17E
FY18E
FY17E
FY18E
FY17E
FY18E
FY17E
FY18E
Agri / Agri Chemical
Rallis
Neutral
221
-
4,294
1,937
2,164
13.3
14.3
9.0
11.0
24.5
20.1
4.3
3.7
18.4
19.8
2.3
2.0
United Phosphorus
Accumulate
611
684
26,194
15,176
17,604
18.5
18.5
37.4
44.6
16.3
13.7
3.2
2.7
21.4
21.2
1.8
1.5
Auto & Auto Ancillary
Ashok Leyland
Buy
92
111
26,068
22,407
26,022
10.6
10.6
5.2
6.4
17.6
14.3
4.0
3.4
23.6
24.7
1.2
1.0
Bajaj Auto
Neutral
2,735
-
79,153
25,093
27,891
19.5
19.2
143.9
162.5
19.0
16.8
5.3
4.6
30.3
29.4
2.9
2.5
Bharat Forge
Buy
750
875
17,456
7,726
8,713
20.5
21.2
35.3
42.7
21.2
17.6
3.9
3.5
18.9
20.1
2.3
2.0
Eicher Motors
Neutral
22,325
-
60,638
16,583
20,447
17.5
18.0
598.0
745.2
37.3
30.0
12.8
9.7
41.2
38.3
3.5
2.8
Gabriel India
Neutral
98
-
1,401
1,544
1,715
9.0
9.3
5.4
6.3
18.1
15.5
3.4
3.0
18.9
19.5
0.9
0.8
Hero Motocorp
Neutral
3,219
-
64,286
31,253
35,198
15.3
15.0
172.3
192.1
18.7
16.8
6.8
5.9
38.9
37.0
1.9
1.7
Jamna Auto Industries Neutral
197
-
1,570
1,486
1,620
9.8
9.9
15.0
17.2
13.1
11.4
2.9
2.4
21.8
21.3
1.1
1.0
L G Balakrishnan & Bros Neutral
469
-
737
1,302
1,432
11.6
11.9
43.7
53.0
10.7
8.9
1.5
1.4
13.8
14.2
0.7
0.6
Mahindra and Mahindra Neutral
1,470
-
91,273
46,534
53,077
11.6
11.7
67.3
78.1
21.8
18.8
3.6
3.1
15.4
15.8
1.9
1.7
Maruti
Neutral
4,870
-
147,107
69,186
82,217
14.7
14.4
198.5
241.4
24.5
20.2
4.8
3.9
20.2
20.0
1.8
1.5
Minda Industries
Neutral
1,170
-
1,856
2,728
3,042
9.0
9.1
68.2
86.2
17.2
13.6
3.9
3.1
23.8
24.3
0.7
0.6
Motherson Sumi
Neutral
341
-
45,099
45,896
53,687
7.8
8.3
13.0
16.1
26.1
21.2
8.4
6.7
34.7
35.4
1.1
0.9
Rane Brake Lining
Neutral
586
-
464
511
562
11.3
11.5
28.1
30.9
20.9
19.0
3.2
2.9
15.3
15.0
1.0
1.0
Setco Automotive
Neutral
50
-
662
741
837
13.0
13.0
15.2
17.0
3.3
2.9
0.5
0.5
15.8
16.3
1.3
1.2
Tata Motors
Neutral
508
-
146,699
300,209
338,549
8.9
8.4
42.7
54.3
11.9
9.4
1.9
1.6
15.6
17.2
0.6
0.5
TVS Motor
Accumulate
295
330
14,017
13,390
15,948
6.9
7.1
12.8
16.5
23.1
17.8
5.8
4.6
26.3
27.2
1.1
0.9
Amara Raja Batteries
Buy
924
1,076
15,778
5,717
6,733
18.7
18.9
38.4
48.9
24.1
18.9
6.0
4.9
25.3
24.8
2.6
2.2
Exide Industries
Neutral
177
-
15,071
7,439
8,307
15.0
15.0
8.1
9.3
21.9
19.1
3.1
2.7
14.3
16.7
1.6
1.5
Apollo Tyres
Accumulate
163
183
8,282
12,877
14,504
14.3
13.9
21.4
23.0
7.6
7.1
1.2
1.0
16.4
15.2
0.8
0.8
Ceat
Buy
864
1,119
3,494
7,524
8,624
13.0
12.7
131.1
144.3
6.6
6.0
1.2
1.0
19.8
18.6
0.5
0.5
JK Tyres
Neutral
89
-
2,018
7,455
8,056
15.0
15.0
21.8
24.5
4.1
3.6
0.9
0.7
22.8
21.3
0.4
0.3
Swaraj Engines
Neutral
1,160
-
1,441
660
810
15.2
16.4
54.5
72.8
21.3
15.9
6.6
6.0
31.5
39.2
2.0
1.6
Subros
Neutral
96
-
573
1,488
1,681
11.7
11.9
6.4
7.2
14.9
13.3
1.6
1.4
10.8
11.4
0.6
0.5
Indag Rubber
Neutral
184
-
482
286
326
19.8
16.8
11.7
13.3
15.7
13.8
2.7
2.5
17.8
17.1
1.4
1.2
Capital Goods
ACE
Neutral
49
-
486
709
814
4.1
4.6
1.4
2.1
35.1
23.4
1.5
1.4
4.4
6.0
0.8
0.7
BEML
Accumulate
1,017
1,157
4,233
3,451
4,055
6.3
9.2
31.4
57.9
32.4
17.6
1.9
1.8
6.3
10.9
1.3
1.1
Bharat Electronics
Accumulate
1,241
1,414
29,777
8,137
9,169
16.8
17.2
58.7
62.5
21.1
19.9
3.3
2.9
44.6
46.3
2.6
2.4
Stock Watch
August 02, 2016
Company Name
Reco
CMP
Target
Mkt Cap
Sales ( Čcr )
OPM(%)
EPS (Č)
PER(x)
P/BV(x)
RoE(%)
EV/Sales(x)
(Č)
Price ( Č)
( Č cr )
FY17E
FY18E
FY17E
FY18E
FY17E
FY18E
FY17E
FY18E
FY17E
FY18E
FY17E
FY18E
FY17E
FY18E
Capital Goods
Voltas
Accumulate
371
407
12,266
6,511
7,514
7.9
8.7
12.9
16.3
28.7
22.7
5.2
4.5
16.7
18.5
1.6
1.4
BGR Energy
Neutral
123
-
884
16,567
33,848
6.0
5.6
7.8
5.9
15.7
20.8
0.9
0.9
4.7
4.2
0.2
0.1
BHEL
Neutral
142
-
34,707
28,797
34,742
-
2.8
2.3
6.9
61.7
20.6
1.1
1.0
1.3
4.8
0.9
0.6
Blue Star
Neutral
486
-
4,631
4,351
5,024
6.4
7.1
17.2
20.6
28.3
23.5
18.4
15.3
23.1
24.1
1.1
1.0
Crompton Greaves
Neutral
78
-
4,911
5,777
6,120
5.9
7.0
3.3
4.5
23.7
17.4
1.0
1.0
4.4
5.9
0.8
0.7
Greaves Cotton
Neutral
147
-
3,580
1,755
1,881
16.8
16.9
7.8
8.5
18.8
17.3
3.8
3.5
20.6
20.9
1.7
1.6
Inox Wind
Buy
220
286
4,872
5,605
6,267
15.7
16.4
24.8
30.0
8.9
7.3
2.5
1.8
25.9
24.4
0.9
0.8
KEC International
Neutral
146
-
3,755
9,294
10,186
7.9
8.1
9.9
11.9
14.8
12.3
2.2
1.9
15.6
16.3
0.6
0.6
Thermax
Neutral
872
-
10,387
5,421
5,940
7.3
7.3
25.7
30.2
33.9
28.9
4.1
3.8
12.2
13.1
1.8
1.7
VATech Wabag
Buy
574
681
3,129
3,136
3,845
8.9
9.1
26.0
35.9
22.1
16.0
2.8
2.4
13.4
15.9
0.9
0.7
Cement
ACC
Neutral
1,691
-
31,762
11,225
13,172
13.2
16.9
44.5
75.5
38.0
22.4
3.6
3.3
11.2
14.2
2.8
2.4
Ambuja Cements
Neutral
271
-
42,049
9,350
10,979
18.2
22.5
5.8
9.5
46.7
28.5
3.9
3.5
10.2
12.5
4.5
3.8
India Cements
Neutral
121
-
3,729
4,364
4,997
18.5
19.2
7.9
11.3
15.4
10.7
1.1
1.1
8.0
8.5
1.6
1.4
JK Cement
Neutral
711
-
4,969
4,398
5,173
15.5
17.5
31.2
55.5
22.8
12.8
2.7
2.4
12.0
15.5
1.7
1.4
J K Lakshmi Cement
Neutral
427
-
5,023
2,913
3,412
14.5
19.5
7.5
22.5
56.9
19.0
3.5
2.9
12.5
18.0
2.3
1.9
Mangalam Cements
Neutral
295
-
787
1,054
1,292
9.0
11.0
-
-
-
-
0.8
0.6
Orient Cement
Accumulate
168
179
3,434
2,114
2,558
18.5
20.5
8.1
11.3
20.7
14.8
9.0
14.0
2.2
1.8
UltraTech Cement
Neutral
3,756
-
103,073
25,768
30,385
21.0
23.5
111.0
160.0
33.8
23.5
4.3
3.8
13.5
15.8
4.1
3.4
Construction
ITNL
Buy
72
93
2,357
8,946
10,017
31.0
31.6
8.1
9.1
8.9
7.9
0.3
0.3
4.2
5.0
3.6
3.3
KNR Constructions
Neutral
592
-
1,666
1,210
1,595
15.4
16.0
33.9
52.1
17.5
11.4
2.7
2.3
13.6
18.0
1.4
1.0
Larsen & Toubro
Accumulate
1,494
1,700
139,223
67,665
77,249
10.7
11.5
57.3
71.2
26.1
21.0
2.4
2.2
12.6
14.3
2.2
1.9
Gujarat Pipavav Port
Accumulate
172
192
8,310
705
788
52.2
51.7
5.0
5.6
34.4
30.7
3.4
3.0
11.2
11.2
11.4
9.7
MBL Infrastructures
Buy
133
285
551
2,797
3,405
14.7
15.4
21.0
34.8
6.3
3.8
0.7
0.6
11.0
16.2
0.8
0.8
Nagarjuna Const.
Neutral
80
-
4,447
8,842
9,775
9.1
8.8
5.3
6.4
15.1
12.5
1.2
1.1
8.2
9.1
0.7
0.6
PNC Infratech
Accumulate
577
647
2,961
2,350
2,904
13.4
13.7
48.0
42.0
12.0
13.7
2.3
2.1
16.8
13.2
1.4
1.1
Simplex Infra
Neutral
311
-
1,538
6,829
7,954
10.5
10.5
31.4
37.4
9.9
8.3
1.0
0.9
9.9
13.4
0.7
0.6
Power Mech Projects
Neutral
566
-
833
1,801
2,219
12.7
14.6
72.1
113.9
7.9
5.0
1.4
1.2
16.8
11.9
0.5
0.3
Sadbhav Engineering
Neutral
287
-
4,916
3,598
4,140
10.3
10.6
9.0
11.9
31.8
24.1
3.3
2.9
9.9
11.9
1.7
1.4
NBCC
Neutral
244
-
14,652
7,428
9,549
7.9
8.6
8.2
11.0
29.8
22.2
1.5
1.2
28.2
28.7
1.7
1.3
Stock Watch
August 02, 2016
Company Name
Reco
CMP
Target
Mkt Cap
Sales ( Čcr )
OPM(%)
EPS (Č)
PER(x)
P/BV(x)
RoE(%)
EV/Sales(x)
(Č)
Price ( Č)
( Č cr )
FY17E
FY18E
FY17E
FY18E
FY17E
FY18E
FY17E
FY18E
FY17E
FY18E
FY17E
FY18E
FY17E
FY18E
Construction
MEP Infra
Neutral
44
-
714
1,877
1,943
30.6
29.8
3.0
4.2
14.6
10.5
7.1
4.8
0.6
0.6
1.8
1.6
SIPL
Neutral
102
-
3,605
1,036
1,252
65.5
66.2
(8.4)
(5.6)
3.8
4.4
(22.8)
(15.9)
11.7
9.7
Engineers India
Neutral
224
-
7,542
1,725
1,935
16.0
19.1
11.4
13.9
19.6
16.1
2.7
2.6
13.4
15.3
3.3
3.0
Financials
Axis Bank
Neutral
550
-
131,319
58,081
66,459
3.5
3.5
32.4
44.6
17.0
12.3
2.2
1.9
13.6
16.5
-
-
Bank of Baroda
Neutral
148
-
33,998
19,980
23,178
1.8
1.8
11.5
17.3
12.8
8.5
1.5
1.2
8.3
10.1
-
-
Canara Bank
Neutral
244
-
13,249
15,225
16,836
1.8
1.8
14.5
28.0
16.8
8.7
1.2
0.9
5.8
8.5
-
-
Dewan Housing Finance Buy
223
270
6,509
2,225
2,688
2.9
2.9
29.7
34.6
7.5
6.5
1.2
1.0
16.1
16.8
-
-
Equitas Holdings
Buy
195
235
6,541
939
1,281
11.7
11.5
5.8
8.2
33.6
23.8
2.9
2.6
10.9
11.5
-
-
Federal Bank
Neutral
65
-
11,160
9,353
10,623
2.9
2.9
4.4
5.8
14.8
11.2
1.4
1.3
9.5
11.0
-
-
HDFC
Neutral
1,375
-
217,304
11,475
13,450
3.4
3.4
45.3
52.5
30.3
26.2
5.9
5.2
20.2
20.5
-
-
HDFC Bank
Neutral
1,242
-
314,354
46,097
55,433
4.5
4.5
58.4
68.0
21.3
18.3
3.7
3.1
18.8
18.6
-
-
ICICI Bank
Neutral
249
-
144,958
39,029
45,903
3.3
3.3
16.7
16.3
14.9
15.3
1.8
1.7
10.1
12.4
-
-
LIC Housing Finance
Accumulate
522
582
26,336
3,712
4,293
2.6
2.5
39.0
46.0
13.4
11.3
2.5
2.1
19.9
20.1
-
-
Punjab Natl.Bank
Neutral
122
-
24,005
23,532
23,595
2.3
2.4
6.8
12.6
18.0
9.7
2.8
2.0
3.3
6.5
-
-
South Ind.Bank
Neutral
21
-
2,883
6,435
7,578
2.5
2.5
2.7
3.1
7.9
6.9
1.0
0.9
10.1
11.2
-
-
St Bk of India
Neutral
227
-
176,564
88,650
98,335
2.6
2.6
13.5
18.8
16.9
12.1
1.6
1.4
7.0
8.5
-
-
Union Bank
Neutral
125
-
8,593
13,450
14,925
2.3
2.3
25.5
34.5
4.9
3.6
0.7
0.6
7.5
10.2
-
-
Yes Bank
Neutral
1,221
-
51,423
8,978
11,281
3.3
3.4
74.0
90.0
16.5
13.6
3.1
2.7
17.0
17.2
-
-
FMCG
Asian Paints
Neutral
1,120
-
107,464
17,128
18,978
16.8
16.4
19.1
20.7
58.7
54.1
20.4
19.3
34.8
35.5
6.2
5.6
Britannia
Neutral
2,886
-
34,623
9,795
10,940
14.1
14.1
80.3
93.0
35.9
31.0
14.8
11.4
41.2
-
3.4
3.0
Colgate
Neutral
951
-
25,874
4,605
5,249
22.8
22.8
25.2
28.5
37.8
33.4
25.6
22.8
64.8
66.8
5.5
4.8
Dabur India
Neutral
302
-
53,038
9,405
10,581
18.1
18.3
8.1
9.2
37.2
32.8
10.4
8.6
31.6
31.0
5.3
4.7
GlaxoSmith Con*
Neutral
6,408
-
26,948
4,959
5,623
17.4
18.0
190.5
219.3
33.6
29.2
9.2
7.9
29.6
29.5
4.9
4.2
Godrej Consumer
Neutral
1,590
-
54,133
10,335
11,518
18.4
18.6
41.5
46.0
38.3
34.6
8.6
7.2
24.9
24.8
5.3
4.7
HUL
Neutral
924
-
199,890
35,252
38,495
17.6
17.4
20.4
21.9
45.2
42.2
37.2
32.6
82.2
77.3
5.5
5.0
ITC
Accumulate
251
283
302,796
40,059
44,439
39.0
39.2
9.1
10.1
27.6
24.9
7.5
6.6
27.2
26.5
7.0
6.3
Marico
Neutral
286
-
36,944
6,730
7,649
17.3
17.5
6.4
7.6
44.7
37.7
13.5
11.4
33.2
32.5
5.3
4.6
Nestle*
Neutral
6,947
-
66,980
9,393
10,507
22.2
22.3
106.8
121.8
65.1
57.0
22.9
20.6
34.8
36.7
6.9
6.2
Tata Global
Neutral
141
-
8,899
9,072
9,687
9.4
9.8
7.2
7.8
19.6
18.1
2.2
2.1
7.6
7.9
1.0
0.9
Stock Watch
August 02, 2016
Company Name
Reco
CMP
Target
Mkt Cap
Sales ( Čcr )
OPM(%)
EPS (Č)
PER(x)
P/BV(x)
RoE(%)
EV/Sales(x)
(Č)
Price ( Č)
( Č cr )
FY17E FY18E
FY17E
FY18E
FY17E
FY18E
FY17E
FY18E
FY17E
FY18E
FY17E
FY18E
FY17E
FY18E
FMCG
Procter & Gamble
Accumulate
6,500
7,369
21,099
2,939
3,342
23.2
23.0
146.2
163.7
44.5
39.7
99.5
95.5
25.3
23.5
6.7
5.8
Hygiene
IT
HCL Tech^
Buy
781
1,000
110,166
49,242
57,168
20.5
20.5
55.7
64.1
14.0
12.2
2.9
2.2
20.3
17.9
2.1
1.7
Infosys
Buy
1,085
1,374
249,219
69,934
79,025
27.5
27.5
64.8
72.0
16.7
15.1
3.7
3.4
22.0
22.3
3.0
2.6
TCS
Accumulate
2,698
3,004
531,621
121,684
136,286
27.3
27.3
135.0
150.1
20.0
18.0
6.7
6.1
33.2
33.9
4.1
3.6
Tech Mahindra
Buy
490
700
47,540
30,347
33,685
17.0
17.0
37.5
41.3
13.1
11.9
2.9
2.5
21.8
20.7
1.3
1.1
Wipro
Buy
559
680
138,026
51,631
55,822
21.7
17.9
35.9
36.9
15.6
15.1
3.2
3.0
19.0
18.1
2.4
2.1
Media
D B Corp
Neutral
407
-
7,485
2,187
2,329
27.4
28.2
18.9
21.0
21.6
19.4
4.5
3.9
23.7
23.1
3.2
2.9
HT Media
Neutral
84
-
1,953
2,673
2,891
13.2
13.8
7.2
8.5
11.7
9.9
0.9
0.8
7.8
8.3
0.3
0.2
Jagran Prakashan
Accumulate
180
205
5,897
2,355
2,635
28.0
28.0
9.9
10.8
18.2
16.7
3.6
3.1
21.7
21.7
2.5
2.2
Sun TV Network
Neutral
473
-
18,638
2,850
3,265
70.1
71.0
26.2
30.4
18.1
15.6
4.6
4.1
24.3
25.6
6.1
5.2
Hindustan Media
Neutral
275
-
2,021
1,016
1,138
21.5
21.5
23.3
25.8
11.8
10.7
1.9
1.7
16.2
15.8
1.3
1.1
Ventures
Metals & Mining
Coal India
Neutral
326
-
206,103
84,638
94,297
21.4
22.3
24.5
27.1
13.3
12.0
5.5
5.3
42.6
46.0
1.9
1.7
Hind. Zinc
Neutral
211
-
89,239
14,252
18,465
55.9
48.3
15.8
21.5
13.4
9.8
2.2
1.9
17.0
20.7
6.3
4.8
Hindalco
Neutral
137
-
28,218
107,899
112,095
7.4
8.2
9.2
13.0
14.9
10.5
0.7
0.7
4.8
6.6
0.8
0.7
JSW Steel
Neutral
1,688
-
40,810
53,201
58,779
16.1
16.2
130.6
153.7
12.9
11.0
1.7
1.5
14.0
14.4
1.5
1.3
NMDC
Neutral
102
-
40,579
6,643
7,284
44.4
47.7
7.1
7.7
14.4
13.3
1.3
1.2
8.8
9.2
3.9
3.5
SAIL
Accumulate
47
50
19,556
47,528
53,738
(0.7)
2.1
(1.9)
2.6
18.2
0.5
0.5
(1.6)
3.9
1.3
1.1
Vedanta
Neutral
166
-
49,199
71,744
81,944
19.2
21.7
13.4
20.1
12.4
8.3
1.1
1.0
8.4
11.3
1.1
0.8
Tata Steel
Neutral
364
-
35,386
121,374
121,856
7.2
8.4
18.6
34.3
19.6
10.6
1.2
1.1
6.1
10.1
0.9
0.9
Oil & Gas
Cairn India
Neutral
190
-
35,529
9,127
10,632
4.3
20.6
8.8
11.7
21.5
16.2
0.7
0.7
3.3
4.2
5.4
4.4
GAIL
Neutral
380
-
48,202
56,220
65,198
9.3
10.1
27.1
33.3
14.0
11.4
1.3
1.2
9.3
10.7
1.0
0.9
ONGC
Accumulate
219
235
187,237
137,222
152,563
15.0
21.8
19.5
24.1
11.2
9.1
1.0
0.9
8.5
10.1
1.6
1.5
Petronet LNG
Neutral
312
-
23,370
-
0
-
-
-
-
-
-
Indian Oil Corp
Neutral
542
-
131,595
373,359
428,656
5.9
5.5
54.0
59.3
10.0
9.1
1.6
1.4
16.0
15.6
0.5
0.4
Reliance Industries
Neutral
1,009
-
327,260
301,963
358,039
12.1
12.6
87.7
101.7
11.5
9.9
1.2
1.1
10.7
11.3
1.6
1.3
Pharmaceuticals
Alembic Pharma
Neutral
623
-
11,747
3,483
4,083
16.2
17.4
18.7
23.7
33.3
26.3
6.2
5.1
20.1
21.3
3.3
2.8
Aurobindo Pharma
Neutral
788
-
46,123
15,720
18,078
23.7
23.7
41.4
47.3
19.0
16.7
5.0
3.9
29.6
26.1
3.2
2.7
Aventis*
Neutral
4,577
-
10,541
2,357
2,692
17.3
17.3
153.5
169.2
29.8
27.1
5.1
4.1
25.8
28.4
4.2
3.4
Cadila Healthcare
Accumulate
352
400
36,077
11,126
13,148
22.0
22.0
17.1
20.0
20.6
17.6
5.3
4.2
28.8
26.6
3.2
2.7
Stock Watch
August 02, 2016
Company Name
Reco
CMP
Target
Mkt Cap
Sales ( Čcr )
OPM(%)
EPS (Č)
PER(x)
P/BV(x)
RoE(%)
EV/Sales(x)
(Č)
Price ( Č)
( Č cr )
FY17E FY18E
FY17E
FY18E
FY17E
FY18E
FY17E
FY18E
FY17E
FY18E
FY17E
FY18E
FY17E
FY18E
Pharmaceuticals
Cipla
Neutral
525
-
42,195
15,378
18,089
17.4
18.4
21.6
27.2
24.3
19.3
3.2
2.7
13.7
15.2
2.9
2.5
Dr Reddy's
Neutral
2,985
-
50,903
16,043
18,119
23.1
24.7
126.0
157.8
23.7
18.9
3.5
3.0
15.7
17.1
3.1
2.7
Dishman Pharma
Neutral
166
-
2,679
1,718
1,890
21.7
21.8
8.7
10.4
19.1
16.0
1.7
1.6
9.3
10.2
2.0
1.8
GSK Pharma*
Accumulate
3,236
3,505
27,410
3,528
3,811
18.9
19.1
60.1
65.3
53.8
49.6
16.0
15.5
29.9
31.8
7.4
6.9
Indoco Remedies
Neutral
312
-
2,878
1,112
1,289
18.2
18.2
13.2
15.6
23.7
20.0
4.2
3.6
19.2
19.2
2.7
2.3
Ipca labs
Buy
510
613
6,431
3,303
3,799
15.3
15.3
17.3
19.7
29.5
25.9
2.6
2.3
9.1
9.4
2.1
1.8
Lupin
Neutral
1,723
-
77,695
15,912
18,644
26.4
26.7
58.1
69.3
29.7
24.9
5.8
4.7
21.4
20.9
5.0
4.1
Sun Pharma
Accumulate
835
944
200,983
31,129
35,258
30.0
30.9
28.0
32.8
29.8
25.5
4.6
3.8
18.7
18.9
6.0
5.1
Power
Tata Power
Neutral
72
-
19,473
36,916
39,557
17.4
27.1
5.1
6.3
14.1
11.4
1.2
1.1
9.0
10.3
1.5
1.4
NTPC
Neutral
159
-
131,391
86,605
95,545
17.5
20.8
11.8
13.4
13.5
11.9
1.4
1.3
10.5
11.1
2.9
2.9
Power Grid
Neutral
177
-
92,730
25,763
29,762
74.3
73.1
14.8
17.3
12.0
10.3
1.9
1.6
16.9
17.5
7.9
7.5
Real Estate
MLIFE
Buy
441
554
1,809
925
1,139
18.4
22.3
18.3
33.8
24.1
13.0
1.1
1.1
4.9
8.5
2.7
2.1
Telecom
Bharti Airtel
Neutral
364
-
145,345
105,086
114,808
34.5
34.7
12.2
16.4
29.8
22.2
2.0
1.9
6.8
8.4
2.3
2.0
Idea Cellular
Neutral
104
-
37,520
40,133
43,731
37.2
37.1
6.4
6.5
16.3
16.0
1.4
1.3
8.2
7.6
2.0
1.7
zOthers
Abbott India
Neutral
4,690
-
9,966
3,153
3,583
14.1
14.4
152.2
182.7
30.8
25.7
151.3
129.2
25.6
26.1
2.9
2.5
Bajaj Electricals
Neutral
271
-
2,734
5,351
6,098
5.7
5.9
12.4
15.7
21.9
17.2
3.2
2.8
14.4
16.1
0.5
0.5
Finolex Cables
Neutral
400
-
6,118
2,883
3,115
12.0
12.1
14.2
18.6
28.2
21.5
15.0
13.1
15.8
14.6
1.8
1.6
Goodyear India*
Buy
524
631
1,208
1,598
1,704
10.4
10.2
49.4
52.6
10.6
10.0
48.9
42.9
18.2
17.0
0.4
57.1
Hitachi
Neutral
1,403
-
3,814
2,081
2,433
8.8
8.9
33.4
39.9
42.0
35.2
33.9
28.2
22.1
21.4
1.8
1.5
Jyothy Laboratories
Neutral
286
-
5,185
1,440
2,052
11.5
13.0
8.5
10.0
33.7
28.6
8.2
7.6
18.6
19.3
3.9
2.7
MRF
Buy
33,747
45,575
14,312
-
0
-
-
-
-
-
-
Page Industries
Neutral
14,941
-
16,665
2,450
3,124
20.1
17.6
299.0
310.0
50.0
48.2
332.8
254.0
47.1
87.5
6.9
5.4
Relaxo Footwears
Neutral
479
-
5,752
2,085
2,469
9.2
8.2
7.6
8.0
63.4
60.3
24.6
21.0
17.9
18.8
2.9
2.4
Siyaram Silk Mills
Buy
1,005
1,347
942
1,799
2,040
11.6
11.7
104.9
122.4
9.6
8.2
1.6
1.4
16.4
16.4
0.7
0.7
Styrolution ABS India*
Accumulate
601
643
1,056
1,440
1,537
9.2
9.0
40.6
42.6
14.8
14.1
37.8
34.3
12.3
11.6
0.7
0.6
TVS Srichakra
Buy
2,356
2,932
1,804
2,304
2,614
13.7
13.8
231.1
266.6
10.2
8.8
264.7
208.4
33.9
29.3
0.8
0.7
HSIL
Neutral
311
-
2,248
2,384
2,515
15.8
16.3
15.3
19.4
20.3
16.0
20.2
17.4
7.8
9.3
1.1
1.0
Kirloskar Engines India
Neutral
275
-
3,977
2,554
2,800
9.9
10.0
10.5
12.1
26.2
22.7
11.0
10.3
10.7
11.7
1.2
1.1
Ltd
M M Forgings
Buy
433
546
522
546
608
20.4
20.7
41.3
48.7
10.5
8.9
59.3
52.5
16.6
17.0
0.8
0.7
Stock Watch
August 02, 2016
Company Name
Reco
CMP
Target
Mkt Cap
Sales ( Čcr )
OPM(%)
EPS (Č)
PER(x)
P/BV(x)
RoE(%)
EV/Sales(x)
(Č)
Price ( Č)
( Č cr )
FY17E
FY18E
FY17E
FY18E
FY17E
FY18E
FY17E
FY18E
FY17E
FY18E
FY17E
FY18E
FY17E
FY18E
zOthers
Banco Products (India) Neutral
175
-
1,252
1,353
1,471
12.3
12.4
14.5
16.3
12.1
10.7
16.7
15.0
14.5
14.6
0.9
92.4
Competent Automobiles Neutral
168
-
103
1,137
1,256
3.1
2.7
28.0
23.6
6.0
7.1
32.3
29.2
14.3
11.5
0.1
0.1
Nilkamal
Neutral
1,213
-
1,810
1,995
2,165
10.7
10.4
69.8
80.6
17.4
15.1
69.3
60.2
16.6
16.5
0.9
0.8
Visaka Industries
Neutral
158
-
251
1,051
1,138
10.3
10.4
21.0
23.1
7.5
6.8
20.3
19.0
9.0
9.2
0.5
0.5
Transport Corporation of
Neutral
370
-
2,834
2,671
2,911
8.5
8.8
13.9
15.7
26.7
23.6
3.7
3.3
13.7
13.8
1.2
1.1
India
Elecon Engineering
Accumulate
58
63
636
1,482
1,660
13.7
14.5
3.9
5.8
15.0
10.1
3.5
3.2
7.8
10.9
0.7
0.7
Surya Roshni
Buy
172
201
754
3,342
3,625
7.8
7.5
17.3
19.8
10.0
8.7
18.9
15.2
10.5
10.8
0.5
0.4
MT Educare
Neutral
155
-
617
366
417
17.7
18.2
9.4
10.8
16.5
14.4
3.7
3.2
22.2
22.3
1.6
1.4
Radico Khaitan
Buy
91
125
1,212
1,659
1,802
13.0
13.2
6.3
7.4
14.4
12.4
1.2
1.1
8.6
9.3
1.2
1.1
Garware Wall Ropes
Neutral
452
-
989
898
997
11.9
11.7
29.0
32.9
15.6
13.8
2.3
2.0
14.9
14.6
1.0
0.9
Wonderla Holidays
Neutral
409
-
2,310
287
355
38.0
40.0
11.3
14.2
36.2
28.8
5.2
4.5
21.4
23.9
7.7
6.3
Linc Pen & Plastics
Neutral
274
-
405
382
416
9.1
9.1
13.1
14.7
20.9
18.6
3.5
3.0
16.7
16.3
1.1
1.0
The Byke Hospitality
Neutral
162
-
651
287
384
20.5
20.5
7.6
10.7
21.4
15.2
4.5
3.6
20.7
23.5
2.3
1.7
Interglobe Aviation
Neutral
972
-
35,014
21,122
26,005
14.5
27.6
110.7
132.1
8.8
7.4
52.5
37.5
168.5
201.1
1.6
1.3
Coffee Day Enterprises
Neutral
242
-
4,995
2,964
3,260
20.5
21.2
4.7
8.0
-
30.3
2.8
2.6
5.5
8.5
2.1
1.9
Ltd
Navneet Education
Neutral
98
-
2,325
1,062
1,147
24.0
24.0
6.1
6.6
16.0
14.7
3.3
2.9
20.6
19.8
2.3
2.1
Navkar Corporation
Buy
210
265
2,998
408
612
42.9
42.3
6.8
11.5
31.0
18.3
2.2
1.9
6.9
10.5
8.3
5.5
UFO Moviez
Neutral
574
-
1,585
619
685
33.2
33.4
30.0
34.9
19.2
16.5
2.7
2.3
13.8
13.9
2.3
1.9
VRL Logistics
Neutral
354
-
3,233
1,902
2,119
16.7
16.6
14.6
16.8
24.3
21.1
5.3
4.7
21.9
22.2
1.8
1.6
Team Lease Serv.
Neutral
1,061
-
1,815
3,229
4,001
1.5
1.8
22.8
32.8
46.6
32.3
5.0
4.3
10.7
13.4
0.5
0.4
S H Kelkar & Co.
Neutral
258
-
3,733
1,036
1,160
15.1
15.0
6.1
7.2
42.3
36.0
4.5
4.1
10.7
11.5
3.5
3.1
Quick Heal
Neutral
267
-
1,871
408
495
27.3
27.0
7.7
8.8
34.5
30.4
3.2
3.2
9.3
10.6
3.7
3.1
Narayana Hrudaya
Neutral
319
-
6,511
1,873
2,166
11.5
11.7
2.6
4.0
120.5
80.4
7.4
6.7
6.1
8.3
3.6
3.1
Manpasand Bever.
Neutral
705
-
3,527
836
1,087
19.6
19.4
16.9
23.8
41.7
29.6
5.0
4.4
12.0
14.8
4.0
3.0
Parag Milk Foods
Neutral
310
-
2,605
1,919
2,231
9.3
9.6
9.5
12.9
32.8
23.9
5.1
4.2
15.5
17.5
1.5
1.3
Source: Company, Angel Research; Note: *December year end; #September year end; &October year end; Price as on August 01, 2016
Market Outlook
August 02, 2016
Research Team Tel: 022 - 39357800
DISCLAIMER
Angel Broking Private Limited (hereinafter referred to as “Angel”) is a registered Member of National Stock Exchange of India Limited,
Bombay Stock Exchange Limited and Metropolitan Stock Exchange Limited. It is also registered as a Depository Participant with CDSL
and Portfolio Manager with SEBI. It also has registration with AMFI as a Mutual Fund Distributor. Angel Broking Private Limited is a
registered entity with SEBI for Research Analyst in terms of SEBI (Research Analyst) Regulations, 2014 vide registration number
INH000000164. Angel or its associates has not been debarred/ suspended by SEBI or any other regulatory authority for accessing
/dealing in securities Market. Angel or its associates/analyst has not received any compensation / managed or co-managed public
offering of securities of the company covered by Analyst during the past twelve months.
This document is solely for the personal information of the recipient, and must not be singularly used as the basis of any investment
decision. Nothing in this document should be construed as investment or financial advice. Each recipient of this document should make
such investigations as they deem necessary to arrive at an independent evaluation of an investment in the securities of the companies
referred to in this document (including the merits and risks involved), and should consult their own advisors to determine the merits and
risks of such an investment.
Reports based on technical and derivative analysis center on studying charts of a stock's price movement, outstanding positions and
trading volume, as opposed to focusing on a company's fundamentals and, as such, may not match with a report on a company's
fundamentals. Investors are advised to refer the Fundamental and Technical Research Reports available on our website to evaluate the
contrary view, if any.
The information in this document has been printed on the basis of publicly available information, internal data and other reliable
sources believed to be true, but we do not represent that it is accurate or complete and it should not be relied on as such, as this
document is for general guidance only. Angel Broking Pvt. Limited or any of its affiliates/ group companies shall not be in any way
responsible for any loss or damage that may arise to any person from any inadvertent error in the information contained in this report.
Angel Broking Pvt. Limited has not independently verified all the information contained within this document. Accordingly, we cannot
testify, nor make any representation or warranty, express or implied, to the accuracy, contents or data contained within this document.
While Angel Broking Pvt. Limited endeavors to update on a reasonable basis the information discussed in this material, there may be
regulatory, compliance, or other reasons that prevent us from doing so.
This document is being supplied to you solely for your information, and its contents, information or data may not be reproduced,
redistributed or passed on, directly or indirectly.
Neither Angel Broking Pvt. Limited, nor its directors, employees or affiliates shall be liable for any loss or damage that may arise from
or in connection with the use of this information.