Market Outlook
September 1, 2015
Dealer’s Diary
Domestic Indices
Chg (%)
(Pts)
(Close)
BSE Sensex
(0.4)
(109)
26,283
Indian markets are expected to open in the red tracking the SGX Nifty and weak
Asian markets.
Nifty
(0.4)
(31)
7,971
MID CAP
(0.2)
(25)
10,734
US markets closed negative led by renewed concerns about the Chinese economy
SMALL CAP
(0.2)
(22)
10,971
after a report said the Chinese government has decided to abandon attempts to
BSE HC
1.8
316
17,962
boost the stock market through large-scale share purchases.
BSE PSU
0.1
4
6,915
European markets too ended lower led by the concerns over China. The snap
BANKEX
(0.3)
(66)
19,637
elections in Greece and the likelihood of a near-term U.S. interest rate hike also
AUTO
(0.8)
(138)
17,865
weighed on investor sentiment.
METAL
0.6
44
7,446
Indian markets witnessed a modest decline led by weak global cues and as investors
OIL & GAS
0.3
24
8,878
waited for the 1QFY2016 GDP data.
BSE IT
(0.2)
(27)
11,161
Global Indices
Chg (%)
(Pts)
(Close)
News & Result Analysis
Dow Jones
(0.7)
(115)
16,528
Result Review: Dishman Pharmaceuticals
Refer detailed news analysis on the following page
NASDAQ
(1.1)
(52)
4,777
FTSE
0.9
56
6,248
Markets Today
Nikkei
(1.3)
(246)
18,890
The trend deciding level for the day is 26,334 / 7,988 levels. If NIFTY trades above
Hang Sang
0.3
58
21,671
this level during the first half-an-hour of trade then we may witness a further rally up
Straits Times
(1.2)
(34)
2,921
to 26,453 - 26,624 / 8,027 - 8,083 levels. However, if NIFTY trades below
Shanghai Com
(0.8)
(26)
3,206
26,334 / 7,988 levels for the first half-an-hour of trade then it may correct towards
26,045 - 26,164 / 7,932 - 7,892 levels.
Indian ADR
Chg (%)
(Pts)
(Close)
Indices
S2
S1
PIVOT
R1
R2
INFY
(2.1)
(0.4)
$17.2
SENSEX
26,045
26,164
26,334
26,453
26,624
WIT
(1.0)
(0.1)
$11.7
NIFTY
7,892
7,932
7,988
8,027
8,083
IBN
(1.7)
(0.2)
$8.7
HDB
(2.4)
(1.4)
$57.0
Net Inflows (August 28, 2015)
` cr
Purch
Sales
Net
MTD
YTD
Advances / Declines
BSE
NSE
FII
5,683
5,624
59
(16,652)
124,318
Advances
1,153
660
MFs
3,644
1,524
2,121
9,490
67,438
Declines
1,522
827
Unchanged
110
66
FII Derivatives (August 31, 2015)
` cr
Purch
Sales
Net
Open Interest
Volumes (` cr)
Index Futures
2,845
2,306
539
19,091
BSE
2,199
Stock Futures
3,442
2,783
659
44,300
NSE
22,110
Gainers / Losers
Gainer
Loser
Company
Price (`)
chg (%)
Company
Price (`)
chg (%)
SREINFRA
46
8.2
SUNASIAN
235
(10.0)
HINDPETRO
466
7.4
GPPL
172
(6.9)
MUTHOOTFIN
173
7.2
M&MFIN
254
(5.0)
PUNJLLOYD
26
6.2
KAILASH
3
(4.7)
CYIENT
583
6.0
VOLTAS
273
(4.4)
Market Outlook
September 1, 2015
Result Review
Dishman Pharmaceuticals (CMP: `222/ TP: `290 / Upside: 30.6)
Dishman Pharmaceuticals for 1QFY2016, posted net sales of
`400cr V/s
`361.5cr, a yoy growth of 10.6%. The sales growth was driven by CRAMS
(`251.8cr), a yoy growth of 5.2%, while others (`148.1cr) a yoy growth of 21.3%.
On the Operating profit, the OPM’s came in at 26.0% V/s 20.5% in 1QFY2015,
mainly on back of gross margins expansion, which came in at 79.4% V/s 71.1% in
1QFY2015. The deprecation, which dipped by 15.2% yoy, lead the net profit come
in at `37.8cr V/s `23.8cr, a yoy growth of 58.7%. We maintain our buy with a
price target of `290.
Y/E
Sales OPM
PAT
EPS ROE
P/E P/BV EV/Sales EV/EBITDA
Mar
(` cr)
(%)
(` cr)
(`)
(%)
(x)
(x)
(x)
(x)
FY2016E
1,716
20.2
132
16.3
9.7
13.6
1.3
1.2
6.0
FY2017E
1,888
20.2
174
21.6
11.7
10.3
1.1
1.0
4.7
Economic and Political News
1QFY2016 GDP growth at 7% vs. 7.5% in 4QFY2015
July core industries growth slows to 3-month low of 1.1%
April-July fiscal deficit at 69% of annual target
Petrol Price Cut by `2/Litre, Diesel by `0.5/Litre
Corporate News
Axis Bank cuts deposit rates by 50bp
HDFC Bank drops loan rates by 35bp; Canara Bank cuts lending rate by
10bp
Eros International picks up worldwide rights of ‘Rock On 2’
Market Outlook
September 1, 2015
Top Picks
Large Cap
Market Cap
CMP
Target
Upside
Company
Sector
Rating
(` Cr)
(`)
(`)
(%)
Axis Bank
Financials
1,20,419
Buy
507
704
38.9
ICICI Bank
Financials
1,61,452
Buy
278
373
34.1
Infosys
IT
2,51,561
Buy
1,095
1,306
19.2
Inox Wind
Capital Goods
8,123
Buy
366
505
38.0
LIC HFL
Financials
22,392
Buy
444
570
28.5
Power Grid
Power
68,351
Buy
131
170
30.1
TCS
IT
5,02,463
Buy
2,565
3,168
23.5
Tech Mahindra IT
49,595
Buy
516
646
25.3
Yes Bank
Financials
28,845
Buy
690
951
37.9
Source: Angel Research, Bloomberg
Mid Cap
Market Cap
CMP
Target
Upside
Company
Sector
Rating
(` Cr)
(`)
(`)
(%)
Bajaj Electricals
Others
2,568
Buy
255
341
33.9
Garware Wall
Others
646
Buy
295
390
32.0
Ropes
HMVL
Media
1,596
Buy
218
292
34.3
JK Tyre
Auto Ancillary
2,454
Buy
108
129
19.2
MBL Infrastructures Construction
986
Buy
238
360
51.4
Minda Industries Auto Ancillary
838
Buy
528
652
23.5
MT Educare
Others
545
Buy
137
169
23.5
Radico Khaitan
Others
1,191
Buy
90
112
25.1
Surya Roshni
Others
565
Buy
129
183
41.9
Source: Angel Research, Bloomberg
Market Outlook
September 01, 2015
Global economic events release calendar
Date
Time
Country Event Description
Unit
Period
Bloomberg Data
Last Reported Estimated
September 1, 2015
1:25PM
Germany PMI Manufacturing
Value
Aug F
53.20
53.20
1:25PM
Germany Unemployment change (000's)
Thousands
Aug
9.00
(3.50)
6:30AM
China
PMI Manufacturing
Value
Aug
50.00
49.70
2:00PM
UK
PMI Manufacturing
Value
Aug
51.90
52.00
September 3, 2015
6:00PM
US
Initial Jobless claims
Thousands
Aug 29
271.00
275.00
1:25PM
Germany PMI Services
Value
Aug F
53.60
53.60
5:15PM
Euro Zone ECB announces interest rates
%
Sep 3
0.05
0.05
September 4, 2015
6:00PM
US
Change in Nonfarm payrolls
Thousands
Aug
215.00
220.00
6:00PM
US
Unnemployment rate
%
Aug
5.30
5.20
September 8, 2015
2:30PM
Euro Zone Euro-Zone GDP s.a. (QoQ)
% Change
2Q P
0.30
0.30
China
Exports YoY%
% Change
Aug
(8.30)
--
September 9, 2015
2:00PM
UK
Industrial Production (YoY)
% Change
Jul
1.50
--
September 10, 2015
India
Imports YoY%
% Change
Aug
(10.28)
--
India
Exports YoY%
% Change
Aug
(10.30)
--
7:00AM
China
Consumer Price Index (YoY)
% Change
Aug
1.60
--
4:30PM
UK
BOE Announces rates
% Ratio
Sep 10
0.50
0.50
September 11, 2015
5:30PM
India
Industrial Production YoY
% Change
Jul
3.80
--
September 13, 2015
11:00AM
China
Industrial Production (YoY)
% Change
Aug
6.00
--
September 14, 2015
12:00PM
India
Monthly Wholesale Prices YoY%
% Change
Aug
(4.05)
--
September 15, 2015
6:45PM
US
Industrial Production
%
Aug
0.56
--
2:00PM
UK
CPI (YoY)
% Change
Aug
0.10
--
September 16, 2015
2:00PM
UK
Jobless claims change
% Change
Aug
(4.90)
--
2:30PM
Euro Zone Euro-Zone CPI (YoY)
%
Aug F
0.20
--
6:00PM
US
Consumer price index (mom)
% Change
Aug
0.10
--
September 17, 2015
6:00PM
US
Building permits
Thousands
Aug
1,130.00
--
6:00PM
US
Housing Starts
Thousands
Aug
1,206.00
--
11:30PM
US
FOMC rate decision
%
Sep 17
0.25
0.50
Source: Bloomberg, Angel Research
Market Outlook
September 1, 2015
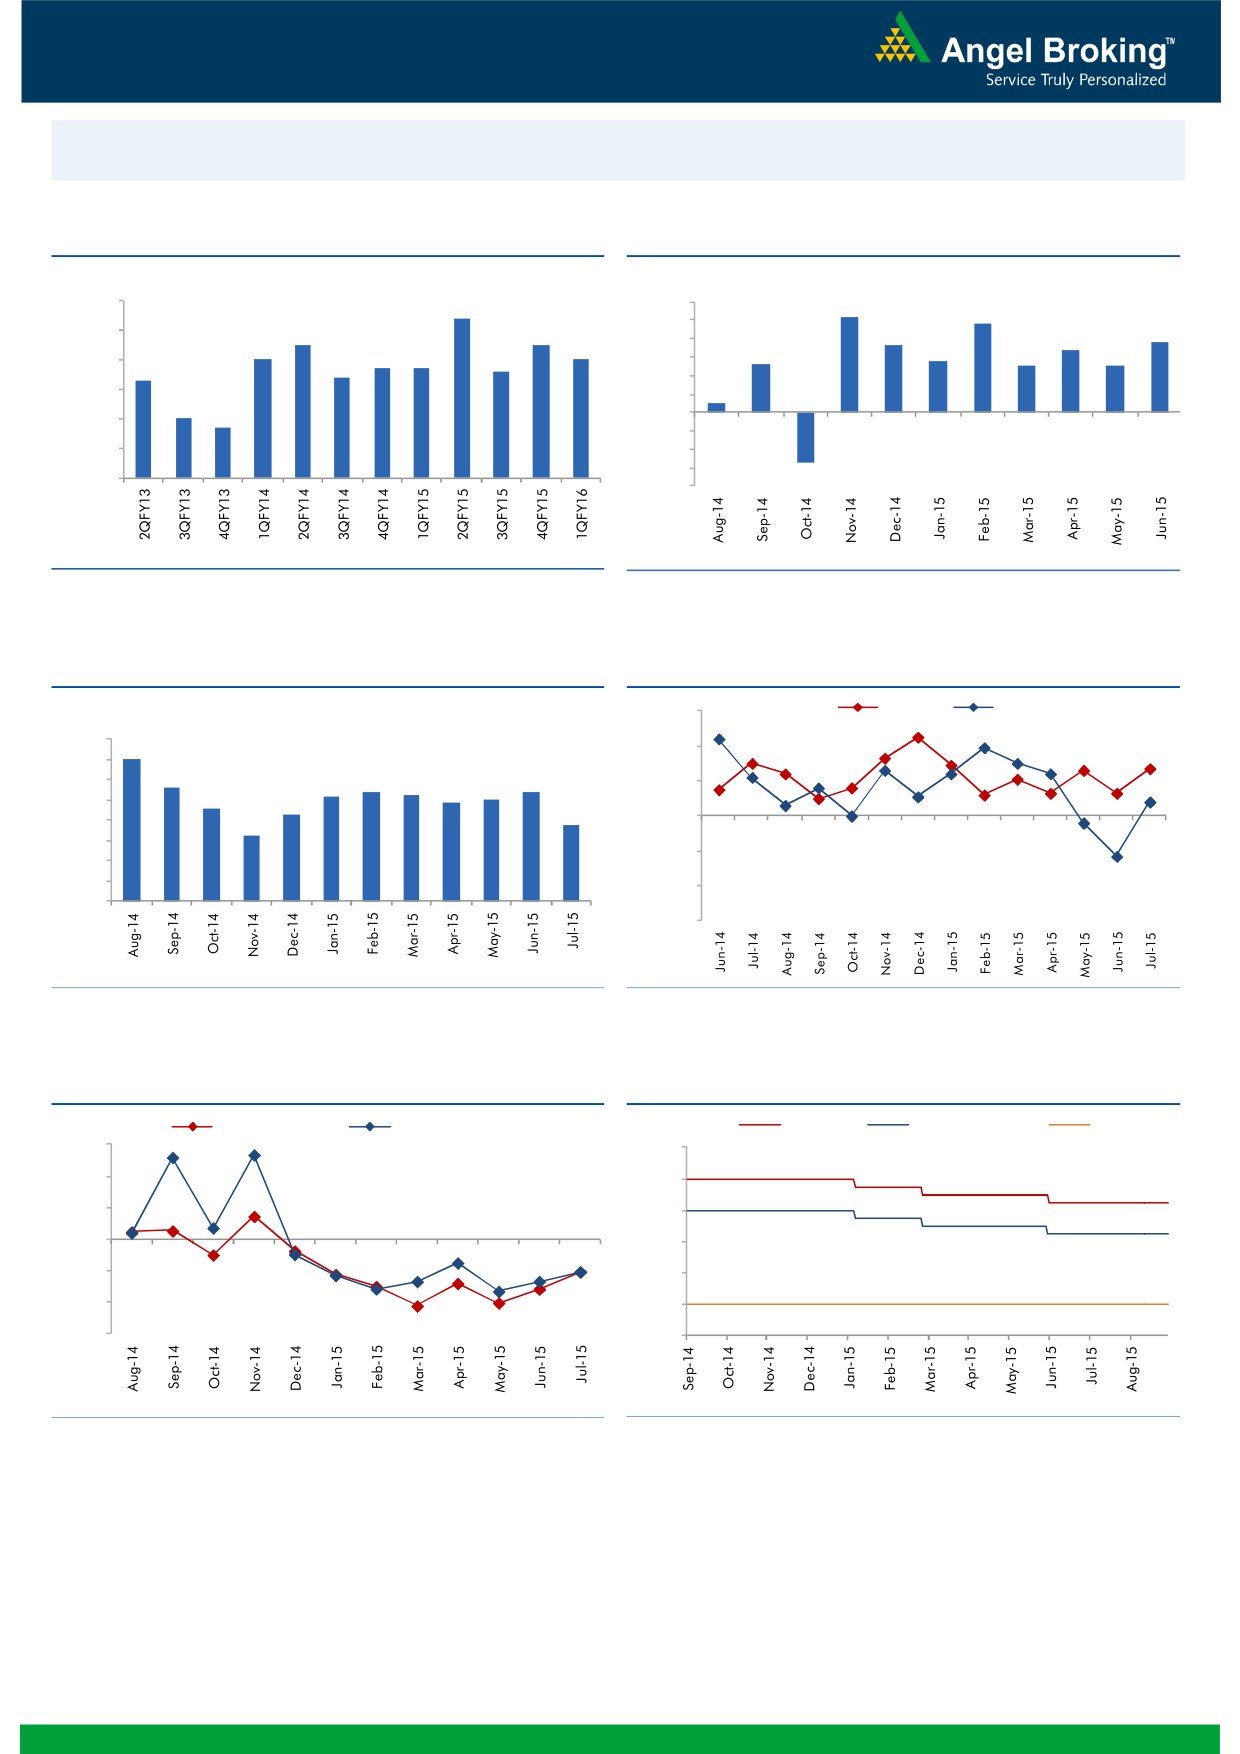
Macro watch
Exhibit 1: Quarterly GDP trends
Exhibit 2: IIP trends
(%)
(%)
9.0
8.4
6.0
5.2
4.8
7.5
7.5
5.0
3.8
8.0
3.6
3.4
7.0
7.0
4.0
2.8
6.7
6.7
2.6
2.5
2.5
7.0
6.3
6.4
6.6
3.0
2.0
6.0
0.5
1.0
5.0
4.7
-
5.0
(1.0)
4.0
(2.0)
(3.0)
3.0
(2.7)
(4.0)
Source: CSO, Angel Research
Source: MOSPI, Angel Research
Exhibit 3: Monthly CPI inflation trends
Exhibit 4: Manufacturing and services PMI
(%)
56.0
Mfg. PMI
Services PMI
8.0
7.0
54.0
7.0
5.6
5.4
6.0
5.2
5.4
5.3
5.0
52.0
4.6
4.9
5.0
4.3
3.8
4.0
3.3
50.0
3.0
48.0
2.0
1.0
46.0
-
44.0
Source: MOSPI, Angel Research
Source: Market, Angel Research; Note: Level above 50 indicates expansion
Exhibit 5: Exports and imports growth trends
Exhibit 6: Key policy rates
(%)
Exports yoy growth
Imports yoy growth
(%)
Repo rate
Reverse Repo rate
CRR
30.0
9.00
20.0
8.00
10.0
7.00
0.0
6.00
(10.0)
5.00
(20.0)
4.00
(30.0)
3.00
Source: Bloomberg, Angel Research
Source: RBI, Angel Research
Market Outlook
September 1, 2015
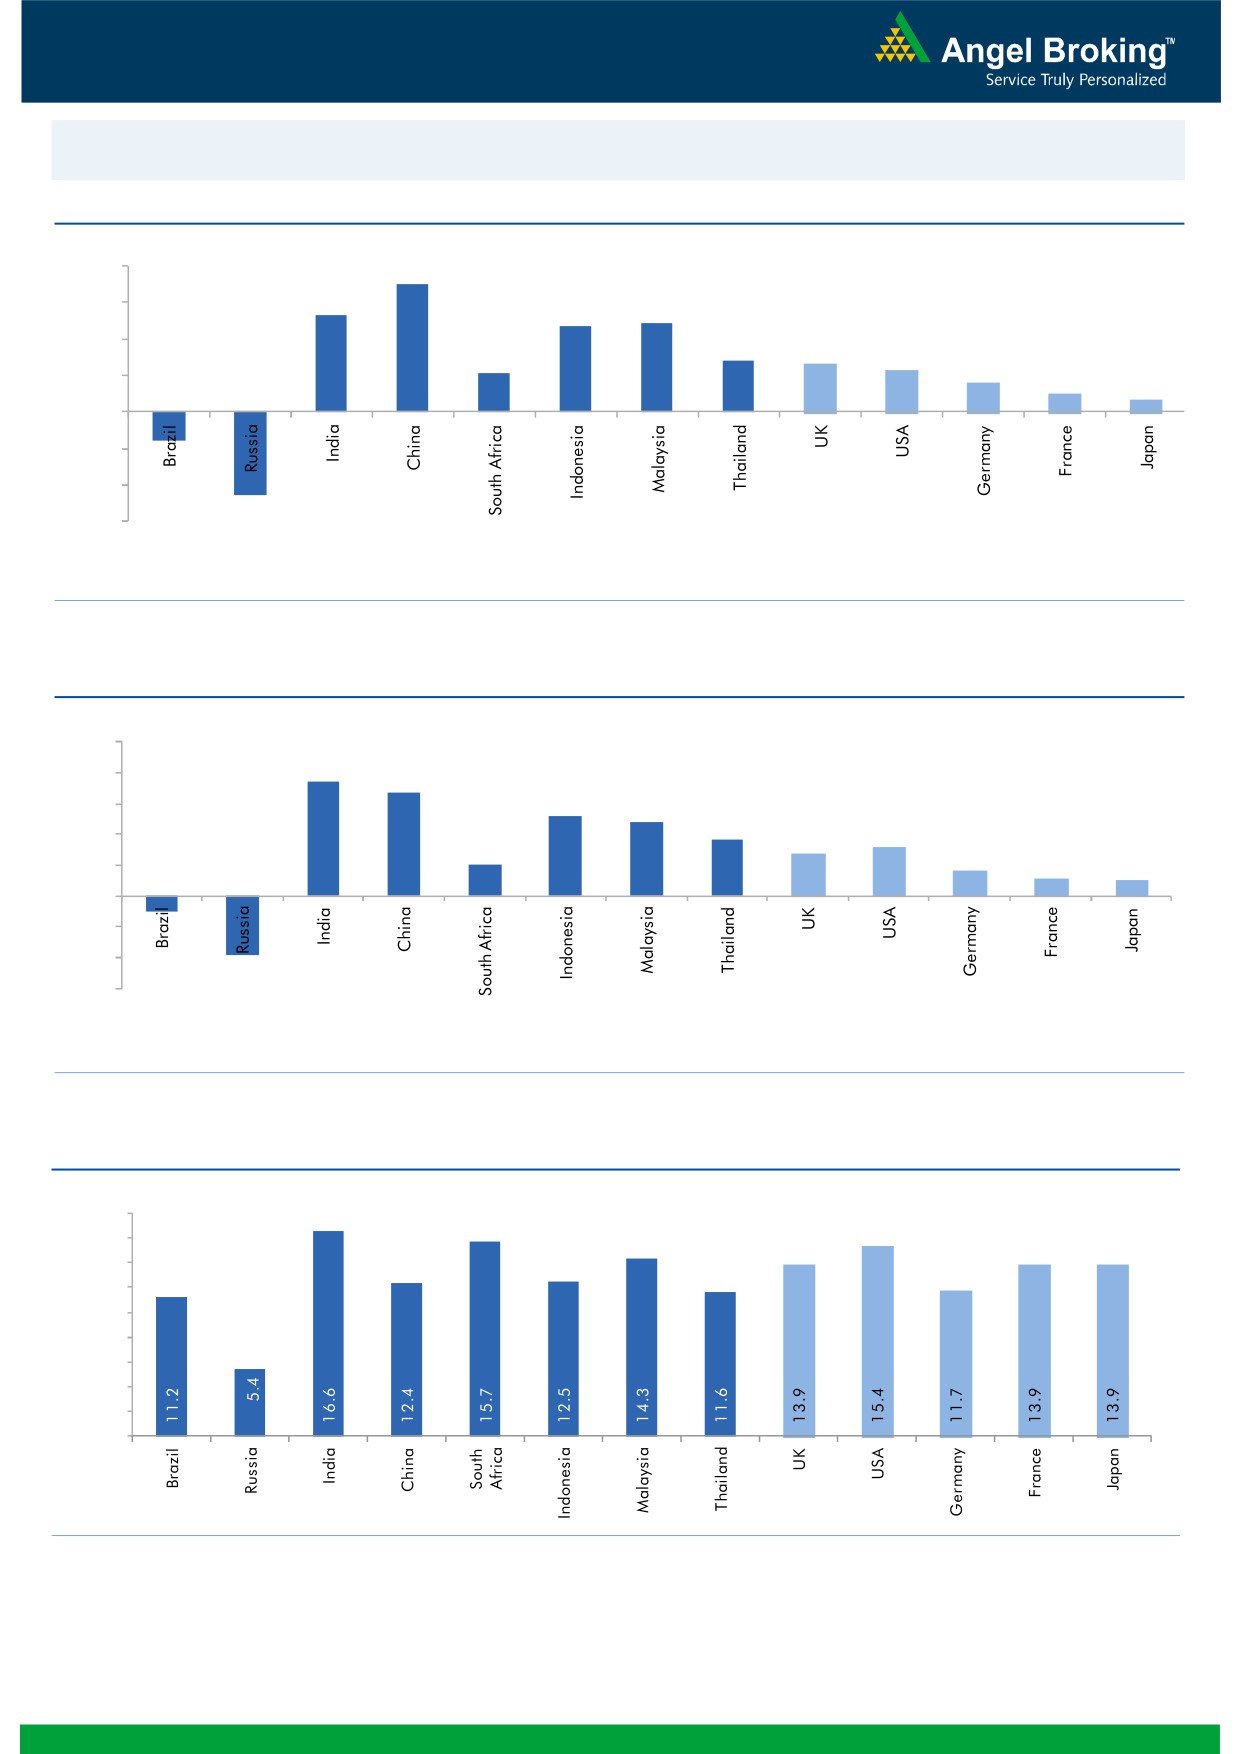
Global watch
Exhibit 1: Latest quarterly GDP Growth (%, yoy) across select developing and developed countries
(%)
8.0
7.0
6.0
5.3
4.9
4.7
4.0
2.8
2.6
2.1
2.3
1.6
2.0
1.0
(1.6)
0.7
(4.6)
-
(2.0)
(4.0)
(6.0)
Source: Bloomberg, Angel Research
Exhibit 2: 2015 GDP Growth projection by IMF (%, yoy) across select developing and developed countries
(%)
10.0
7.5
8.0
6.8
5.2
6.0
4.8
3.7
3.1
4.0
2.7
2.0
1.6
1.2
1.0
2.0
(3.8)
(1.0)
-
(2.0)
(4.0)
(6.0)
Source: IMF, Angel Research
Exhibit 3: One year forward P-E ratio across select developing and developed countries
(x)
18.0
16.0
14.0
12.0
10.0
8.0
6.0
4.0
2.0
-
Source: Bloomberg, Angel Research
Market Outlook
September 1, 2015
Exhibit 4: Relative performance of indices across globe
Returns (%)
Country
Name of index
Closing price
1M
3M
1YR
Brazil
Bovespa
46,626
(3.8)
(12.0)
(20.1)
Russia
Micex
1,733
5.7
2.3
17.5
India
Nifty
7,971
(4.7)
(5.7)
0.9
China
Shanghai Composite
3,205
(17.7)
(32.4)
39.2
South Africa
Top 40
44,350
(4.7)
(7.0)
(6.1)
Mexico
Mexbol
43,722
(1.7)
(2.8)
(4.7)
Indonesia
LQ45
757
(6.6)
(18.6)
(15.2)
Malaysia
KLCI
1,612
(5.1)
(7.8)
(13.4)
Thailand
SET 50
894
(6.0)
(11.0)
(14.7)
USA
Dow Jones
16,528
(5.5)
(8.1)
(2.5)
UK
FTSE
6,248
(5.5)
(11.3)
(9.3)
Japan
Nikkei
18,750
(6.4)
(7.6)
22.9
Germany
DAX
10,259
(7.7)
(9.6)
7.8
France
CAC
4,653
(6.4)
(7.0)
6.4
Source: Bloomberg, Angel Research
Market Outlook
September 01, 2015
Stock Watch
Company Name
Reco
CMP
Target
Mkt Cap
Sales ( Čcr )
OPM(%)
EPS (Č)
PER(x)
P/BV(x)
RoE(%)
EV/Sales(x)
(Č)
Price ( Č)
( Č cr )
FY16E FY17E
FY16E
FY17E
FY16E
FY17E
FY16E
FY17E
FY16E
FY17E
FY16E
FY17E
FY16E
FY17E
Agri / Agri Chemical
Rallis
Neutral
214
-
4,153
2,075
2,394
14.4
14.4
9.5
11.0
22.5
19.4
4.5
3.9
21.1
21.3
2.0
1.8
United Phosphorus
Neutral
503
-
21,548
13,698
15,752
17.6
17.6
32.1
38.5
15.7
13.1
3.1
2.6
21.4
21.3
1.7
1.4
Auto & Auto Ancillary
Ashok Leyland
Neutral
91
-
25,769
17,850
20,852
10.6
11.1
3.2
4.3
28.3
21.1
4.7
4.3
16.4
20.8
1.4
1.2
Bajaj Auto
Accumulate
2,255
2,454
65,249
23,842
27,264
19.8
19.6
128.4
144.4
17.6
15.6
5.4
4.6
30.5
29.5
2.3
2.0
Eicher Motors
Buy
19,015
22,859
51,611
11,681
15,550
15.3
16.9
358.5
564.3
53.0
33.7
15.9
11.9
29.8
34.9
4.3
3.2
Hero Motocorp
Accumulate
2,397
2,660
47,872
28,500
33,028
13.8
14.1
144.2
166.3
16.6
14.4
6.1
5.2
36.7
36.0
1.5
1.3
L G Balakrishnan & Bros Neutral
485
-
761
1,254
1,394
11.6
11.8
35.9
41.7
13.5
11.6
1.8
1.6
13.5
13.8
0.7
0.6
Mahindra and Mahindra Buy
1,223
1,493
75,957
40,088
45,176
13.8
14.0
59.6
70.4
20.5
17.4
3.4
3.0
16.6
17.2
1.6
1.3
Maruti
Accumulate
4,168
4,735
125,892
58,102
68,587
16.7
16.9
182.0
225.5
22.9
18.5
4.6
3.9
19.9
21.0
1.9
1.6
Minda Industries
Buy
528
652
838
2,567
2,965
7.3
8.0
38.8
54.3
13.6
9.7
2.0
1.6
14.4
16.8
0.4
0.4
Rane Brake Lining
Buy
292
366
231
454
511
11.1
11.4
23.8
28.1
12.3
10.4
1.7
1.6
14.2
15.3
0.6
0.6
Setco Automotive
Neutral
224
-
599
594
741
12.7
13.7
8.4
15.8
26.7
14.2
2.8
2.4
10.4
16.9
1.5
1.2
Tata Motors
Buy
340
432
98,208
267,464
307,211
13.7
13.7
34.6
40.7
9.8
8.4
1.2
1.1
13.2
13.6
0.6
0.5
TVS Motor
Accumulate
223
255
10,616
11,839
13,985
7.0
8.0
10.8
15.9
20.7
14.1
5.3
4.2
25.5
29.7
0.9
0.7
Amara Raja Batteries
Neutral
1,007
-
17,201
5,101
6,224
17.8
17.6
31.1
39.2
32.4
25.7
8.0
6.4
24.8
24.8
3.3
2.7
Exide Industries
Neutral
154
-
13,073
7,363
8,247
13.7
14.5
6.6
7.7
23.3
20.0
2.9
2.7
12.6
13.3
1.5
1.4
Apollo Tyres
Neutral
180
-
9,165
12,576
12,978
16.8
16.1
22.3
19.9
8.1
9.1
1.4
1.2
17.2
13.4
0.8
0.8
Ceat
Accumulate
1,098
1,166
4,443
6,041
6,597
14.3
14.2
101.5
116.6
10.8
9.4
2.2
1.8
20.0
19.1
0.9
0.8
JK Tyres
Buy
108
129
2,454
7,446
7,669
15.2
14.0
19.6
18.4
5.5
5.9
1.4
1.2
25.2
19.5
0.7
0.6
Swaraj Engines
Neutral
895
-
1,112
593
677
14.5
14.8
51.2
60.8
17.5
14.7
4.1
3.7
23.3
24.8
1.7
1.5
Subros
Neutral
78
-
465
1,268
1,488
11.6
11.9
3.7
6.6
21.0
11.8
1.4
1.3
6.8
11.4
0.7
0.6
Indag Rubber
Neutral
179
-
469
283
329
17.0
17.2
13.0
15.4
13.8
11.6
3.0
2.5
21.8
21.6
1.4
1.1
Capital Goods
ACE
Neutral
41
-
402
660
839
4.7
8.2
1.0
3.9
40.7
10.4
1.3
1.1
3.2
11.3
0.8
0.6
BEML
Neutral
1,295
-
5,392
3,277
4,006
6.0
8.9
29.2
64.3
44.3
20.1
2.5
2.3
5.7
11.7
1.7
1.4
BGR Energy
Neutral
108
-
779
3,615
3,181
9.5
9.4
16.7
12.4
6.5
8.7
0.6
0.6
10.0
7.0
0.6
0.8
BHEL
Neutral
227
-
55,438
33,722
35,272
10.8
11.7
10.5
14.2
21.6
16.0
1.6
1.5
7.0
9.0
1.7
1.6
Blue Star
Accumulate
351
387
3,157
3,649
4,209
5.0
5.9
9.2
14.7
38.4
23.8
6.9
6.5
9.1
17.5
1.0
0.8
Crompton Greaves
Buy
171
204
10,720
13,484
14,687
4.9
6.2
4.5
7.1
38.0
24.1
2.7
2.5
7.2
10.8
0.9
0.8
Inox Wind
Buy
366
505
8,123
4,980
5,943
17.0
17.5
26.6
31.6
13.8
11.6
4.1
3.0
35.0
30.0
1.8
1.4
Market Outlook
September 01, 2015
Stock Watch
Company Name
Reco
CMP
Target
Mkt Cap
Sales ( Čcr )
OPM(%)
EPS (Č)
PER(x)
P/BV(x)
RoE(%)
EV/Sales(x)
(Č)
Price ( Č)
( Č cr )
FY16E
FY17E
FY16E
FY17E
FY16E
FY17E
FY16E
FY17E
FY16E
FY17E
FY16E
FY17E
FY16E
FY17E
Capital Goods
KEC International
Neutral
130
-
3,345
8,791
9,716
6.1
6.8
5.4
8.2
24.1
15.9
2.4
2.2
10.0
14.0
0.6
0.6
Thermax
Neutral
952
-
11,341
6,413
7,525
7.4
8.5
30.5
39.3
31.2
24.2
4.8
4.2
15.0
17.0
1.7
1.4
Cement
ACC
Buy
1,335
1,548
25,056
11,856
14,092
14.5
17.8
47.6
76.1
28.0
17.5
2.9
2.7
10.6
15.7
2.0
1.6
Ambuja Cements
Accumulate
207
233
32,186
10,569
12,022
20.7
22.2
8.7
10.7
23.8
19.4
3.0
2.9
13.0
15.2
2.6
2.3
India Cements
Buy
73
112
2,236
4,716
5,133
15.9
16.9
3.7
7.5
19.7
9.7
0.7
0.7
3.8
7.3
0.8
0.7
JK Cement
Buy
624
767
4,363
4,056
4,748
14.5
17.0
22.6
41.1
27.6
15.2
2.5
2.2
9.3
15.3
1.5
1.3
J K Lakshmi Cement
Buy
352
430
4,137
2,947
3,616
16.7
19.9
11.5
27.2
30.6
12.9
2.9
2.5
9.8
20.8
1.8
1.4
Mangalam Cements
Neutral
223
-
595
1,053
1,347
10.5
13.3
8.4
26.0
26.5
8.6
1.1
1.0
4.3
12.5
0.9
0.7
Orient Cement
Accumulate
166
183
3,401
1,854
2,524
21.2
22.2
7.7
11.1
21.6
15.0
3.1
2.7
13.3
15.7
2.6
1.8
Ramco Cements
Accumulate
324
350
7,710
4,036
4,545
20.8
21.3
15.1
18.8
21.5
17.2
2.6
2.3
12.9
14.3
2.4
2.1
Shree Cement^
Neutral
10,802
-
37,631
7,150
8,742
26.7
28.6
228.0
345.5
47.4
31.3
7.0
5.9
15.7
20.3
5.0
4.0
UltraTech Cement
Accumulate
2,898
3,282
79,526
27,562
31,548
20.4
22.3
111.9
143.3
25.9
20.2
3.7
3.2
15.2
16.8
3.0
2.5
Construction
ITNL
Neutral
97
-
2,388
7,360
8,825
34.0
35.9
1.0
5.0
96.8
19.4
0.4
0.4
0.3
1.4
3.8
3.7
KNR Constructions
Neutral
569
-
1,600
915
1,479
14.3
13.9
20.3
37.2
28.0
15.3
2.6
2.2
9.6
15.6
1.9
1.2
Larsen & Toubro
Buy
1,605
2,013
149,380
68,920
82,446
10.9
11.5
57.0
73.0
28.2
22.0
2.6
2.4
13.6
15.5
2.4
2.0
Gujarat Pipavav Port
Neutral
172
-
8,293
721
784
53.1
53.6
8.2
9.1
20.9
18.9
3.4
2.7
20.0
18.3
11.1
9.8
MBL Infrastructures
Buy
238
360
986
2,313
2,797
12.2
14.6
19.0
20.0
12.5
11.9
1.3
1.2
11.3
10.6
1.1
1.0
Nagarjuna Const.
Neutral
72
-
3,978
7,892
8,842
8.3
9.1
2.4
5.3
29.8
13.5
1.2
1.1
4.2
8.6
0.7
0.6
PNC Infratech
Neutral
495
-
2,540
1,798
2,132
13.2
13.5
22.0
30.0
22.5
16.5
2.0
1.8
11.5
11.4
1.5
1.3
Simplex Infra
Neutral
307
-
1,517
6,241
7,008
10.4
10.7
20.0
36.0
15.3
8.5
1.3
1.1
6.8
11.1
0.7
0.6
Financials
Allahabad Bank
Neutral
83
-
4,762
8,859
9,817
3.0
3.0
23.7
30.1
3.5
2.8
0.4
0.3
10.6
12.3
-
-
Axis Bank
Buy
507
704
120,419
26,522
31,625
3.6
3.6
36.2
45.4
14.0
11.2
2.7
2.4
18.2
19.6
-
-
Bank of Baroda
Neutral
185
-
40,835
18,934
21,374
2.0
2.0
13.2
15.1
14.0
12.2
1.0
0.9
7.1
7.7
-
-
Bank of India
Neutral
142
-
9,458
17,402
20,003
2.0
2.1
40.3
50.7
3.5
2.8
0.4
0.3
9.0
10.4
-
-
Canara Bank
Neutral
286
-
14,727
15,805
17,745
2.0
2.2
64.3
73.5
4.5
3.9
0.5
0.4
10.8
11.3
-
-
Dena Bank
Neutral
43
-
2,391
3,580
4,040
2.1
2.2
8.4
10.9
5.1
3.9
0.4
0.4
6.8
8.4
-
-
Federal Bank
Neutral
61
-
10,507
3,522
4,045
3.2
3.2
12.2
14.1
5.0
4.4
0.6
0.6
12.9
13.4
-
-
HDFC
Neutral
1,189
-
187,408
11,198
13,321
3.5
3.5
45.1
53.7
26.4
22.1
5.4
4.9
27.2
28.2
-
-
HDFC Bank
Buy
1,028
1,255
258,463
38,629
47,500
4.5
4.7
52.6
66.4
19.6
15.5
3.6
3.0
19.6
21.2
-
-
Market Outlook
September 01, 2015
Stock Watch
Company Name
Reco
CMP
Target
Mkt Cap
Sales ( Čcr )
OPM(%)
EPS (Č)
PER(x)
P/BV(x)
RoE(%)
EV/Sales(x)
(Č)
Price ( Č)
( Č cr )
FY16E FY17E
FY16E
FY17E
FY16E
FY17E
FY16E
FY17E
FY16E
FY17E
FY16E
FY17E
FY16E
FY17E
Financials
ICICI Bank
Buy
278
373
161,452
36,037
41,647
3.5
3.6
22.9
26.7
12.1
10.4
2.0
1.8
15.7
15.9
-
-
IDBI Bank
Neutral
61
-
9,720
9,806
11,371
1.7
1.9
10.0
16.3
6.1
3.7
0.4
0.4
6.8
10.4
-
-
Indian Bank
Neutral
133
-
6,405
6,454
7,321
2.5
2.6
26.4
33.3
5.1
4.0
0.4
0.4
8.1
9.6
-
-
LIC Housing Finance
Buy
444
570
22,392
2,934
3,511
2.3
2.3
30.9
36.8
14.4
12.1
2.3
2.0
16.8
17.5
-
-
Oriental Bank
Neutral
136
-
4,079
7,930
8,852
2.5
2.5
51.8
57.1
2.6
2.4
0.3
0.3
9.3
9.5
-
-
Punjab Natl.Bank
Neutral
145
-
26,863
24,160
27,777
2.9
3.0
18.5
24.6
7.8
5.9
0.8
0.6
8.8
10.8
-
-
South Ind.Bank
Neutral
20
-
2,761
1,999
2,249
2.4
2.4
3.5
4.0
5.9
5.1
0.7
0.7
12.6
13.1
-
-
St Bk of India
Buy
247
309
186,961
86,900
100,550
3.1
3.1
22.1
27.7
11.2
8.9
1.4
1.2
12.7
14.3
-
-
Union Bank
Neutral
177
-
11,260
12,995
14,782
2.4
2.4
32.3
40.9
5.5
4.3
0.7
0.6
10.7
12.3
-
-
Vijaya Bank
Neutral
36
-
3,106
3,474
3,932
1.8
1.9
5.9
7.2
6.2
5.0
0.5
0.5
8.1
9.3
-
-
Yes Bank
Buy
690
951
28,845
7,006
8,825
3.1
3.3
61.4
77.1
11.2
8.9
2.1
1.8
20.1
21.3
-
-
FMCG
Asian Paints
Neutral
849
-
81,398
16,553
19,160
16.0
16.2
17.7
21.5
48.0
39.5
12.7
11.5
29.4
31.2
4.8
4.1
Britannia
Neutral
2,929
-
35,140
8,065
9,395
9.6
10.2
47.2
65.5
62.0
44.7
20.6
19.5
38.3
41.2
4.2
3.6
Colgate
Neutral
1,954
-
26,576
4,836
5,490
19.5
19.7
48.5
53.2
40.3
36.7
29.5
25.7
99.8
97.5
5.4
4.7
Dabur India
Neutral
274
-
48,084
9,370
10,265
17.1
17.2
7.3
8.1
37.3
33.8
11.3
9.2
33.7
30.6
5.0
4.6
GlaxoSmith Con*
Neutral
6,135
-
25,803
4,919
5,742
17.2
17.4
168.3
191.2
36.5
32.1
10.3
8.8
28.8
28.9
4.8
4.1
Godrej Consumer
Neutral
1,335
-
45,461
10,168
12,886
16.1
16.1
32.1
38.4
41.6
34.8
8.5
7.8
19.7
21.0
4.6
3.6
HUL
Neutral
862
-
186,416
34,940
38,957
17.5
17.7
20.8
24.7
41.4
34.9
46.1
36.8
110.5
114.2
5.1
4.6
ITC
Buy
325
409
261,002
41,068
45,068
37.8
37.4
13.9
15.9
23.4
20.5
7.8
6.9
34.1
33.8
6.0
5.4
Marico
Neutral
406
-
26,197
6,551
7,766
15.7
16.0
10.4
12.5
39.1
32.5
11.4
9.4
33.2
32.4
3.9
3.3
Nestle*
Accumulate
5,976
6,646
57,619
11,291
12,847
22.2
22.3
158.9
184.6
37.6
32.4
19.7
17.7
55.0
57.3
4.9
4.3
Tata Global
Buy
120
152
7,542
8,635
9,072
9.8
9.9
6.5
7.6
18.4
15.7
1.8
1.8
6.8
7.4
0.8
0.8
IT
HCL Tech^
Buy
972
1,132
136,625
42,038
47,503
23.5
23.5
56.4
62.9
17.2
15.5
4.0
3.1
23.2
19.8
2.9
2.3
Infosys
Buy
1,095
1,306
251,561
60,250
66,999
28.0
28.0
58.3
63.7
18.8
17.2
3.9
3.4
20.9
19.7
3.5
3.0
TCS
Buy
2,565
3,168
502,463
108,420
123,559
28.8
28.7
127.2
143.9
20.2
17.8
8.0
7.5
39.9
41.8
4.2
3.7
Tech Mahindra
Buy
516
646
49,595
25,566
28,890
16.0
17.0
26.3
31.9
19.6
16.2
3.5
3.0
17.9
18.6
1.7
1.4
Wipro
Buy
571
719
141,128
52,414
58,704
23.7
23.8
38.4
42.3
14.9
13.5
2.9
2.6
19.5
18.0
2.3
1.9
Media
D B Corp
Buy
309
356
5,678
2,241
2,495
27.8
27.9
21.8
25.6
14.2
12.1
3.7
3.3
26.7
28.5
2.5
2.2
HT Media
Neutral
82
-
1,905
2,495
2,603
11.2
11.2
7.3
8.6
11.2
9.5
0.9
0.8
7.4
8.1
0.3
0.2
Market Outlook
September 01, 2015
Stock Watch
Company Name
Reco
CMP
Target
Mkt Cap
Sales ( Čcr )
OPM(%)
EPS (Č)
PER(x)
P/BV(x)
RoE(%)
EV/Sales(x)
(Č)
Price ( Č)
( Č cr )
FY16E FY17E
FY16E
FY17E
FY16E
FY17E
FY16E
FY17E
FY16E
FY17E
FY16E
FY17E
FY16E
FY17E
Media
Jagran Prakashan
Accumulate
137
156
4,469
1,939
2,122
26.0
26.0
8.3
9.2
16.5
14.9
2.8
2.5
17.5
17.1
2.3
2.1
Sun TV Network
Neutral
342
-
13,486
2,779
3,196
70.2
70.5
22.8
27.3
15.0
12.5
3.7
3.4
26.7
28.3
4.6
4.0
Hindustan Media
Buy
218
292
1,596
920
1,031
20.0
20.0
19.2
20.9
11.3
10.4
1.9
1.6
16.4
15.3
1.3
1.1
Ventures
Metals & Mining
Coal India
Accumulate
366
400
231,400
72,015
78,415
21.2
21.5
21.7
25.3
16.9
14.5
5.7
5.6
33.1
39.1
2.4
2.3
Hind. Zinc
Neutral
127
-
53,640
15,546
16,821
47.5
49.0
19.7
20.3
6.4
6.3
1.1
1.0
17.2
16.6
1.2
0.8
Hindalco
Neutral
80
-
16,530
112,328
119,817
7.7
7.9
16.3
20.1
4.9
4.0
0.4
0.3
8.0
8.5
0.6
0.5
JSW Steel
Neutral
921
-
22,258
48,125
53,595
18.8
21.0
46.9
97.5
19.6
9.4
1.0
0.9
4.4
9.5
1.3
1.1
NMDC
Neutral
101
-
39,984
12,544
13,330
59.5
59.7
16.3
16.5
6.2
6.1
1.1
1.0
5.1
9.9
1.9
1.9
SAIL
Neutral
50
-
20,692
56,365
63,383
6.9
8.0
7.1
8.2
7.0
6.1
0.4
0.4
7.0
7.1
0.9
0.8
Vedanta
Neutral
99
-
29,247
81,842
88,430
30.6
32.8
20.2
25.7
4.9
3.8
0.4
0.3
7.5
8.5
0.7
0.5
Tata Steel
Neutral
225
-
21,857
136,805
149,228
11.3
11.9
26.4
36.8
8.5
6.1
0.7
0.6
6.0
8.0
0.7
0.6
Oil & Gas
Cairn India
Neutral
149
-
27,973
12,617
14,513
33.7
40.0
25.5
27.7
5.9
5.4
0.4
0.4
7.4
7.7
0.9
0.7
GAIL
Neutral
296
-
37,579
75,595
85,554
8.6
8.0
31.8
36.1
9.3
8.2
1.0
0.9
10.7
11.4
0.6
0.5
ONGC
Neutral
240
-
205,161
174,773
192,517
22.7
24.8
34.6
38.2
6.9
6.3
1.0
0.9
14.2
14.9
1.3
1.1
Petronet LNG
Buy
177
210
13,275
39,007
40,785
3.8
4.2
9.2
11.0
19.3
16.1
2.2
2.0
11.6
12.7
0.4
0.4
Indian Oil Corp
Accumulate
414
455
100,627
359,607
402,760
5.9
6.1
42.5
48.7
9.8
8.5
1.3
1.2
14.1
14.4
0.4
0.3
Reliance Industries
Accumulate
857
930
277,444
339,083
384,014
7.8
9.5
75.7
94.5
11.3
9.1
1.1
1.1
10.7
12.2
1.1
1.0
Pharmaceuticals
Alembic Pharma
Neutral
714
-
13,456
2,601
3,115
21.2
20.2
20.8
23.9
34.3
29.9
11.0
8.3
37.2
31.8
5.2
4.3
Aurobindo Pharma
Buy
754
872
44,025
14,923
17,162
23.0
23.0
38.2
43.6
19.7
17.3
6.1
4.6
36.0
30.2
3.3
2.8
Aventis*
Neutral
3,938
-
9,068
2,156
2,455
15.1
16.8
109.7
133.9
35.9
29.4
4.9
4.0
18.4
22.5
3.9
3.3
Cadila Healthcare
Neutral
1,900
-
38,900
10,224
11,840
20.0
21.0
71.0
85.6
26.8
22.2
7.2
5.7
30.1
28.5
3.9
3.3
Cipla
Neutral
682
-
54,732
14,051
16,515
20.4
18.7
26.6
28.4
25.6
24.0
4.3
3.7
18.2
16.5
3.9
3.2
Dr Reddy's
Neutral
4,310
-
73,482
17,903
20,842
22.7
22.8
160.5
189.5
26.9
22.7
5.5
4.5
22.2
21.7
4.1
3.4
Dishman Pharma
Buy
222
290
1,793
1,716
1,888
20.2
20.2
16.3
21.6
13.6
10.3
1.3
1.1
9.7
11.7
1.2
1.0
GSK Pharma*
Neutral
3,384
-
28,660
2,870
3,158
20.0
22.1
59.5
68.3
56.9
49.5
16.8
17.2
28.5
34.3
9.5
8.7
Indoco Remedies
Neutral
338
-
3,118
1,088
1,262
18.2
18.2
13.1
15.5
25.8
21.8
5.1
4.2
21.2
21.1
2.9
2.5
Ipca labs
Neutral
792
-
9,995
3,507
4,078
17.6
18.6
25.8
32.0
30.7
24.8
4.0
3.4
13.8
14.9
3.1
2.7
Lupin
Neutral
1,929
-
86,814
14,864
17,244
26.9
26.9
62.1
71.1
31.1
27.1
7.5
6.0
27.4
24.6
5.6
4.7
Sun Pharma
Accumulate
898
950
216,026
28,163
32,610
25.8
30.7
17.4
26.9
51.6
33.4
4.9
4.2
13.0
16.6
7.1
6.0
Market Outlook
September 01, 2015
Stock Watch
Company Name
Reco
CMP
Target
Mkt Cap
Sales ( Čcr )
OPM(%)
EPS (Č)
PER(x)
P/BV(x)
RoE(%)
EV/Sales(x)
(Č)
Price ( Č)
( Č cr )
FY16E FY17E
FY16E
FY17E
FY16E
FY17E
FY16E
FY17E
FY16E
FY17E
FY16E
FY17E
FY16E
FY17E
Power
Tata Power
Neutral
61
-
16,377
38,302
38,404
14.1
13.1
5.1
6.0
11.8
10.2
1.1
1.1
9.2
10.3
1.3
1.3
NTPC
Buy
121
157
100,059
87,064
98,846
23.5
23.5
11.7
13.2
10.4
9.2
1.2
1.1
11.4
12.1
2.2
1.9
Power Grid
Buy
131
170
68,351
20,702
23,361
86.7
86.4
12.1
13.2
10.8
9.9
1.6
1.4
15.6
15.1
8.2
7.7
Telecom
Bharti Airtel
Neutral
355
-
141,708
101,748
109,191
32.1
31.7
12.0
12.5
29.5
28.4
2.0
1.9
6.9
6.7
2.0
1.8
Idea Cellular
Neutral
156
-
56,086
34,282
36,941
32.0
31.5
5.9
6.2
26.4
25.1
2.4
2.2
9.9
9.3
2.2
2.1
zOthers
Abbott India
Neutral
4,786
-
10,170
2,715
3,153
14.5
14.1
134.3
152.2
35.6
31.4
8.9
7.3
27.4
25.6
3.5
2.9
Bajaj Electricals
Buy
255
341
2,568
4,719
5,287
5.2
5.8
8.6
12.7
29.8
20.1
3.4
3.0
11.4
14.8
0.5
0.5
Finolex Cables
Neutral
236
-
3,614
2,728
3,036
10.8
11.0
14.4
16.8
16.4
14.1
2.5
2.2
15.2
15.3
1.1
0.9
Goodyear India*
Buy
569
655
1,313
1,953
1,766
12.4
12.0
67.4
59.6
8.4
9.6
2.1
1.8
27.7
20.2
0.5
0.4
Hitachi
Neutral
1,423
-
3,870
1,806
2,112
9.0
9.2
28.6
29.1
49.8
48.9
12.4
10.0
28.1
22.6
2.2
1.9
Jyothy Laboratories
Neutral
314
-
5,690
1,620
1,847
11.5
11.5
7.3
8.5
43.1
37.1
5.6
5.2
13.3
14.4
3.4
2.9
MRF
Accumulate
40,427
43,575
17,146
20,727
14,841
19.3
18.6
4,905.8
3,351.9
8.2
12.1
2.6
2.2
37.6
19.6
0.8
1.0
Page Industries
Neutral
14,144
-
15,776
1,929
2,450
19.8
20.1
229.9
299.0
61.5
47.3
27.1
18.9
52.1
47.1
8.2
6.4
Relaxo Footwears
Neutral
519
-
6,231
1,767
2,152
12.3
12.5
19.3
25.1
27.0
20.7
6.6
5.1
27.7
27.8
3.6
2.9
Siyaram Silk Mills
Accumulate
1,091
1,221
1,022
1,653
1,873
11.7
12.2
99.3
122.1
11.0
8.9
2.0
1.7
19.5
20.2
0.8
0.7
Styrolution ABS India*
Neutral
758
-
1,333
1,271
1,440
8.6
9.2
32.0
41.1
23.7
18.5
2.4
2.2
10.7
12.4
1.0
0.9
Tree House
Accumulate
395
449
1,672
259
324
56.8
56.8
17.0
21.7
23.2
18.2
2.3
2.1
10.1
11.5
6.4
5.3
TVS Srichakra
Buy
2,617
3,210
2,003
2,127
2,388
15.2
14.9
237.7
267.5
11.0
9.8
4.7
3.3
51.7
39.8
1.0
0.8
HSIL
Buy
262
434
1,896
2,085
2,436
18.5
18.6
21.7
28.9
12.1
9.1
1.2
1.1
10.0
12.1
1.0
0.8
Kirloskar Engines India
Accumulate
274
297
3,959
2,634
3,252
10.1
12.0
10.9
17.4
25.1
15.7
2.8
2.5
11.4
16.8
1.1
0.9
Ltd
M M Forgings
Buy
615
797
742
563
671
22.1
22.9
51.0
66.5
12.1
9.3
2.5
2.0
23.1
24.1
1.5
1.2
Banco Products (India)
Neutral
124
-
884
1,208
1,353
11.0
12.3
10.8
14.5
11.5
8.5
1.3
1.2
11.9
14.5
0.7
0.6
Competent Automobiles Neutral
162
-
100
1,007
1,114
3.1
3.1
23.7
28.2
6.9
5.8
1.0
0.8
13.9
14.6
0.1
0.1
Nilkamal
Neutral
1,021
-
1,523
1,948
2,147
10.6
10.3
60.0
67.0
17.0
15.2
2.7
2.3
16.8
16.1
0.8
0.7
Visaka Industries
Accumulate
153
166
243
1,158
1,272
8.6
9.5
23.7
32.7
6.5
4.7
0.7
0.6
10.1
12.5
0.4
0.3
Transport Corporation of
Accumulate
264
293
2,005
2,830
3,350
8.8
9.0
14.4
18.3
18.4
14.4
2.8
2.5
15.4
17.1
0.8
0.7
India
Elecon Engineering
Buy
70
87
757
1,452
1,596
14.0
14.7
4.4
6.2
15.7
11.2
1.3
1.2
8.6
11.2
0.8
0.7
Surya Roshni
Buy
129
183
565
2,992
3,223
8.3
8.5
14.7
18.3
8.8
7.1
0.8
0.7
9.8
11.0
0.5
0.4
MT Educare
Buy
137
169
545
286
366
18.3
17.7
7.7
9.4
17.7
14.6
3.7
3.3
20.2
21.1
1.8
1.4
Market Outlook
September 01, 2015
Stock Watch
Company Name
Reco
CMP
Target Mkt Cap
Sales ( Čcr )
OPM(%)
EPS (Č)
PER(x)
P/BV(x)
RoE(%)
EV/Sales(x)
(Č)
Price ( Č)
( Č cr )
FY16E FY17E FY16E FY17E FY16E FY17E FY16E FY17E FY16E FY17E FY16E FY17E FY16E FY17E
zOthers
Radico Khaitan
Buy
90
112
1,191
1,565
1,687
11.9
12.4
5.4
6.6
16.5
13.6
1.3
1.2
8.0
9.0
1.3
1.2
Garware Wall Ropes
Buy
295
390
646
875
983
10.4
10.6
23.1
27.8
12.8
10.6
1.8
1.6
14.1
14.8
0.8
0.6
Wonderla Holidays
Buy
276
322
1,560
206
308
44.0
43.6
9.0
12.9
30.7
21.4
4.2
3.8
13.7
17.8
7.5
5.0
Linc Pen & Plastics
Buy
156
185
230
340
371
8.3
8.9
10.8
13.2
14.4
11.8
2.3
2.0
16.0
17.1
0.7
0.7
Source: Company, Angel Research; Note: *December year end; #September year end; &October year end; Price as on August 31, 2015
Market Outlook
September 01, 2015
Research Team Tel: 022 - 39357800
DISCLAIMER
Angel Broking Private Limited (hereinafter referred to as “Angel”) is a registered Member of National Stock Exchange of India Limited,
Bombay Stock Exchange Limited and MCX Stock Exchange Limited. It is also registered as a Depository Participant with CDSL and
Portfolio Manager with SEBI. It also has registration with AMFI as a Mutual Fund Distributor. Angel Broking Private Limited is a registered
entity with SEBI for Research Analyst in terms of SEBI (Research Analyst) Regulations, 2014 vide registration number INH000000164.
Angel or its associates has not been debarred/ suspended by SEBI or any other regulatory authority for accessing /dealing in securities
Market. Angel or its associates including its relatives/analyst do not hold any financial interest/beneficial ownership of more than 1% in
the company covered by Analyst. Angel or its associates/analyst has not received any compensation / managed or co-managed public
offering of securities of the company covered by Analyst during the past twelve months. Angel/analyst has not served as an officer,
director or employee of company covered by Analyst and has not been engaged in market making activity of the company covered by
Analyst.
This document is solely for the personal information of the recipient, and must not be singularly used as the basis of any investment
decision. Nothing in this document should be construed as investment or financial advice. Each recipient of this document should make
such investigations as they deem necessary to arrive at an independent evaluation of an investment in the securities of the companies
referred to in this document (including the merits and risks involved), and should consult their own advisors to determine the merits and
risks of such an investment.
Reports based on technical and derivative analysis center on studying charts of a stock's price movement, outstanding positions and
trading volume, as opposed to focusing on a company's fundamentals and, as such, may not match with a report on a company's
fundamentals.
The information in this document has been printed on the basis of publicly available information, internal data and other reliable sources
believed to be true, but we do not represent that it is accurate or complete and it should not be relied on as such, as this document is for
general guidance only. Angel Broking Pvt. Limited or any of its affiliates/ group companies shall not be in any way responsible for any
loss or damage that may arise to any person from any inadvertent error in the information contained in this report. Angel Broking Pvt.
Limited has not independently verified all the information contained within this document. Accordingly, we cannot testify, nor make any
representation or warranty, express or implied, to the accuracy, contents or data contained within this document. While Angel Broking
Pvt. Limited endeavors to update on a reasonable basis the information discussed in this material, there may be regulatory, compliance,
or other reasons that prevent us from doing so.
This document is being supplied to you solely for your information, and its contents, information or data may not be reproduced,
redistributed or passed on, directly or indirectly.
Neither Angel Broking Pvt. Limited, nor its directors, employees or affiliates shall be liable for any loss or damage that may arise from or
in connection with the use of this information.
Note: Please refer to the important ‘Stock Holding Disclosure' report on the Angel website (Research Section). Also, please refer to the
latest update on respective stocks for the disclosure status in respect of those stocks. Angel Broking Pvt. Limited and its affiliates may have
investment positions in the stocks recommended in this report.