Market Outlook
August 1, 2016
Market Cues
Domestic Indices
Chg (%)
(Pts)
(Close)
Indian markets are expected to open flat tracking SGX Nifty.
BSE Sensex
(0.6)
(157)
28,052
Wall Street markets closed mostly higher with the S&P hitting an intra-day record for
Nifty
(0.3)
(28)
8,639
the 7th time in a month. Gains in the tech sector led by Amazon and Google owner
Mid Cap
0.7
88
12,661
Alphabet outweighed the losses in the Energy sector. Low Oil prices, weak refining
Small Cap
0.2
28
12,310
margins cut 2Q profits at Exxon to $1.7bn from $4.2bn a year earlier. Exxon shares
Bankex
(0.6)
(138)
21,679
fell 1.4%. Chevron shares climbed 0.7% despite reporting a 2Q loss $1.47bn, its
largest loss since 2001. Sentiment was also hit by weaker-than-expected US growth
data. US economy grew at an annual pace of 1.2% in 2Q, and the growth estimate
Global Indices
Chg (%)
(Pts)
(Close)
for the 1Q was also revised down.
Dow Jones
(0.1)
(24)
18,432
After spending much of day behind, London market scraped into positive territory at
Nasdaq
0.1
7
5,162
close. FTSE 100 closed up 0.05%, helped by strong shares in financial companies.
FTSE
0.1
3
6,724
Barclays was the biggest winner with 5.5% gain, followed by Standard Life and
Nikkei
0.6
92
16,569
Schroders, which both added more than 3%. Barclays shares took off after the bank
Hang Seng
(1.3)
(283)
21,891
reported strong 2Q earnings.
Shanghai Com
(0.5)
(15)
2,979
Sensex continued to struggle around 28,000 mark to finish lower on Friday even as
benchmark indices gained on the week. The weakness in Indian equities was in line
Advances / Declines
BSE
NSE
with the subdued mood in Asian markets. Auto, healthcare and utilities shares held
Advances
1,209
716
ground while most other sectors were under pressure.
Declines
1,487
911
News Analysis & Result Review
Unchanged
214
68
Results Review: UPL, Indoco Remedies, Alembic Pharma, ICICI Bank
Results Preview: Tech Mahindra
Volumes (` Cr)
Neyveli Lignite to set up 4,000MW of Solar Power
BSE
3,672
Detailed analysis on Pg2
NSE
23,231
Investor’s Ready Reckoner
Key Domestic & Global Indicators
Net Inflows (` Cr)
Net
Mtd
Ytd
Stock Watch: Latest investment recommendations on 150+ stocks
FII
2,011
11,130
30,674
Refer Pg7 onwards
MFs
137
(274)
9,070
Top Picks
Top Gainers
Price (`)
Chg (%)
CMP
Target
Upside
Company
Sector
Rating
(`)
(`)
(%)
Dishtv
103
9.6
Amara Raja
Auto/Auto Ancillary
Buy
937
1,076
14.8
Iifl
269
7.6
HCL Tech
IT
Buy
753
1,000
32.9
Dcbbank
111
6.9
LIC Housing
Financials
Accumulate
519
582
12.1
Carerating
1,062
6.8
Bharat Electronics
Capital Goods
Buy
1,236
1,414
14.4
Eichermot
22,466
6.6
Navkar Corporation Others
Buy
214
265
23.8
More Top Picks on Pg6
Top Losers
Price (`)
Chg (%)
Key Upcoming Events
Jpassociat
12
(8.7)
Previous
Consensus
Date
Region
Event Description
Reading
Expectations
Religare
256
(6.3)
Aug 1 Germany
PMI Manufacturing
53.7
53.7
Sparc
357
(4.9)
Aug 1
UK
PMI Manufacturing
49.1
49.1
Gsfc
70
(4.9)
Aug 3
China
PMI Manufacturing
50.0
50.0
Kpit
132
(4.4)
Aug 4
US
Initial Jobless claims
266.0
265.0
As on July 29, 2016
Aug 4
US
Unemployment rate
4.9
4.8
6.(
More Events on Pg7
Market Outlook
August 1, 2016
Result Review
UPL (CMP: `625 / TP: `684 /Upside: 9.4%)
For 1QFY2017, the company posted sales of
`3,452cr V/s
`3,205cr in
1QFY2016, a yoy growth of 7.7%. All markets, except the Indian and USA, which
posted growth of 1% and 5% respectively, posted double digit growth. Volume
growth during the quarter was 8%, while price dip was 2% and exchange rates
aided 2% growth. On the operating profit front, the OPM came in at 20.0% V/s
19.0% in 1QFY2016. The improvement in the OPM was on back of gross margins
which came in at 42% V/s 41% in 1QFY2016. This lead company to post an Adj.
net profit of `402cr V/s `325cr in 1QFY2016, a yoy growth of 24.0%. We
maintain our Accumulate rating.
Y/E
Sales OPM
PAT
EPS ROE P/E P/BV EV/EBITDA EV/Sales
Mar
(` cr)
(%)
(` cr)
(`)
(%)
(x)
(x)
(x)
(x)
FY2017E
15,176
18.5
1,601
37.4
21.4
16.7
3.3
9.1
1.7
FY2018E
17,604
18.5
1,912
44.6
21.2
14.0
2.7
7.6
1.4
Indoco Remedies (CMP: `308 / TP: `225 /Upside: -26.9%)
For 1QFY2017, the company posted sales of `253cr V/s `220cr expected V/s
`216cr in 1QFY2016, a yoy growth of 17.0%. The formulations (`234.5cr), a yoy
growth of
14.8% yoy, while API
(`175.9cr), a yoy growth of
40.8%. The
formulations growth was driven by domestic formulation (`142.1cr), a yoy growth
of 12.7%, while export domestic (`92.3cr), a yoy growth of 18.4%. On the
operating profit front, the OPM came in at 14.7% V/s 16.3% in 1QFY2016, V/s
17.0% expected. Dip in the OPM was mainly on back of 85.0% yoy rise in the R&D
expenses, which were around 4.7% V/s 3.0% in 1QFY2016. This lead company to
post an Adj. net profit of `19.7cr V/s `20.3cr in 1QFY2016, a yoy de-growth of
2.7%. We maintain our Sell rating.
Y/E
Sales OPM
PAT
EPS ROE P/E P/BV EV/EBITDA EV/Sales
Mar
(` cr)
(%)
(` cr)
(`)
(%)
(x)
(x)
(x)
(x)
FY2017E
1,112
18.2
122
13.2
19.2
23.3
4.2
14.6
2.7
FY2018E
1,289
18.2
144
15.6
19.2
19.8
3.5
12.3
2.2
Alembic Pharma (CMP: `627 / TP: / Upside: )
For 1QFY2017, the company posted sales of `727cr V/s `780cr expected V/s
`583cr in 1QFY2016, a yoy growth of 24.8%. The formulations `607.6cr), a yoy
growth of 29.3% yoy, while API (`128cr), a yoy growth of 7.0%. The formulations
growth was driven by International formulation (`309cr), a yoy growth of 72.0%,
while Indian formulation (`278cr), a yoy growth of 6.0%. On the operating profit
front, the OPM came in at 21.4% V/s 17.4% in 1QFY2016, V/s 22.7% expected.
Expansion in the OPM was mainly on back of gross margin expansion 73.7% V/s
63.4%. R&D expenses, during the quarter was at 10.9% of sales V/s 8.2% in
1QFY2016. This lead company to post an Adj. net profit of `102.0cr V/s `69.8cr
in 1QFY2016, a yoy growth of 46.1%. We maintain our Neutral rating.
Market Outlook
August 1, 2016
Y/E
Sales OPM
PAT
EPS ROE P/E P/BV EV/EBITDA EV/Sales
Mar
(` cr)
(%)
(` cr)
(`)
(%)
(x)
(x)
(x)
(x)
FY2017E
3,483
16.2
352
18.7
20.1
33.6
6.2
20.6
3.3
FY2018E
4,083
17.4
447
23.7
21.3
26.5
5.2
16.1
2.8
ICICI Bank reported mixed set of results for the quarter
ICICI Bank reported mixed set of results for the quarter, while the PAT number was
on expected line, this has come on the back of higher other income backed by
trading gains and lower than expected provisions due to utilisation of `800cr from
contingency provisions. On NII front the bank has disappointed which remained
flat. Slippages remained elevated at `8,249cr, of which 55% came from the watch
list of `44,000cr and 16% came from the restructured loan book. Considering that
the bank has sold NPAs worth `2,232cr in the quarters the slippages number are
higher than what we were expecting.
While the bank has not given any specific credit cost guidance we feel it will
remain high. Overall loan growth remained moderate at 12% YoY, however, good
part is that retail loans continued to grow strong at 22% and management expects
that to accelerate in the quarters to come. We believe problem on asset quality is
going to continue to impact the profitability for few more quarters and slippages
other than the watch list can be a negative surprise going ahead. Key would be the
timing for upgradation of the assets which has been classified as NPAs. While the
bank would continue to fight NPA issues it also intends to expand the loan book
selectively, from this point of view we believe the stock could remain range bound
now, any corrections should be considered for accumulation.
Result Preview
Tech Mahindra (CMP: `487 / TP: `700 /Upside: 43.7%)
For 1QFY2017, the company is expected to post sales of `6,880cr V/s `6,884cr in
4QFY2016, a QoQ de-growth of 0.1%. In US$ terms, it’s expected to come in at
US$1,027mn V/s US$1,023mn, a QoQ growth of 0.4%. On the operating profit
front, the EBIT margin is expected to come in at 12.3% V/s 13.7% in 4QFY2016,
QoQ dip of 137bps. Thus, the Adj. net profit is expected to come in at `816cr V/s
`897cr in 4QFY2016, a QoQ de-growth of 9.0%. We maintain our Buy rating.
Y/E
Sales OPM
PAT
EPS ROE P/E P/BV EV/EBITDA EV/Sales
Mar
(` cr)
(%)
(` cr)
(`)
(%)
(x)
(x)
(x)
(x)
FY2017E
30,347
17.0
3,633
37.5
21.8
13.0
2.8
8.0
1.4
FY2018E
33,685
17.0
3,999
41.3
20.7
11.8
2.4
6.8
1.2
Neyveli Lignite to set up 4,000MW of Solar Power
As per media reports, Neyveli Lignite (NLC) has initiated plans to set up 4,000
Mega Watt (MW) of Solar power projects, in-line with Centre's National Solar
Mission. Construction works have commenced for 65MW Solar Power plant at
Block-1, Neyveli last week. This 65 MW Solar power plant will be constructed in an
area of 325 acres at Neyveli and approx. 2,30,465 Solar Photovoltaic Modules
(Solar Panels), each with power generating capacity of 305/310 Watt will be
installed in the project. Power generated from this plant is fed to Tamilnadu
Market Outlook
August 1, 2016
Generation and Distribution Corporation (TANGEDCO). M/s Jakson Engineering
Ltd. is the Engineering, Procurement and Commissioning contractor for this
project.
Earlier NLC had established 10MW Solar Photo Voltaic project at Neyveli, at a cost
of `74.60cr commissioned by BHEL. Works for another 65MW Solar power project
to be installed in Northern side of Block-5 of Neyveli Town Ship by BHEL is also
under progress.
Economic and Political News
Fiscal deficit at 61.1% of BE in Q1FY17
FDI rises 7% to $10.55bn in Q1
Rajya Sabha to take up GST bill today
Iron ore traffic zooms 416% in April-June period
Corporate News
BPCL picks up 21% stake in Fino PayTech for `251cr
Mahindra Holidays to invest `550cr to add new inventories
Royal Enfield to invest `600cr in new plant
Quarterly Bloomberg Brokers Consensus Estimate
Tech Mahindra Ltd - Aug 1, 2016
Particulars (` cr)
1QFY17E
1QFY16
y-o-y (%)
4QFY16
q-o-q (%)
Net sales
6,895
6,294
9.5
6,884
0.2
EBITDA
1,092
935
16.8
1,161
(5.9)
EBITDA margin (%)
15.8
14.9
16.9
Net profit
726
676
7.3
897
(19.1)
HCL Technologies Ltd - Aug 3, 2016
Particulars (` cr)
1QFY17E
1QFY16
y-o-y (%)
4QFY16
q-o-q (%)
Net sales
10,780
9,777
10.3
10,698
0.8
EBITDA
2,388
2,100
13.7
2,379
0.4
EBITDA margin (%)
22.1
21.5
22.2
Net profit
1,920
1,783
7.7
1,926
(0.3)
Cadila Healthcare Ltd - Aug 3, 2016
Particulars (` cr)
1QFY17E
1QFY16
y-o-y (%)
4QFY16
q-o-q (%)
Net sales
2519.8
2421.7
4.05
2375.5
6.1
EBITDA
558.9
620.33
(9.9)
606.3
(7.8)
EBITDA margin (%)
22.1
25.6
22.2
Net profit
385.6
353.4
9.1
388.7
(0.8)
Market Outlook
August 1, 2016
Tata Power Co Ltd Consol- Aug 4, 2016
Particulars (` cr)
1QFY17E
1QFY16
y-o-y (%)
4QFY16
q-o-q (%)
Net sales
9,250
9,235
0.2
9,375
(1.3)
EBITDA
2,000
2,181
(8.3)
1,913
4.5
EBITDA margin (%)
21.6
23.6
20.4
Net profit
337
241
39.6
360
(6.5)
Siemens Ltd - Aug 4, 2016
Particulars (` cr)
3QSY16E
3QSY15
y-o-y (%)
2QSY16
q-o-q (%)
Net sales
2,498
2,322
7.6
2,725
(8.3)
EBITDA
273
253
7.7
306
(11.0)
EBITDA margin (%)
10.9
10.9
11.2
Net profit
163
168
(3.2)
177
(8.2)
Cummins India Ltd - Aug 4, 2016
Particulars (` cr)
1QFY17E
1QFY16
y-o-y (%)
4QFY16
q-o-q (%)
Net sales
1,307
1,282
1.9
1,038
25.9
EBITDA
204
218
(6.6)
171
19.2
EBITDA margin (%)
15.6
17.0
16.5
Net profit
198
211
(5.9)
164
20.9
Market Outlook
August 1, 2016
Top Picks
Large Cap
M
arket Cap
CM
P
T
arget
Upsid
e
Company
Rationale
(` Cr)
(`)
(`)
(%)
To outpace battery industry growth due to better technological
Amara Raja Batteries
16,004
937
1,076
14.8
products leading to market share gains in both the automotive
OEM and replacement segments.
Uptick in defense capex by government, coupled with BELs
Bharat Electronics
29,662
1,236
1,414
14.4
strong market positioning, indicate good times ahead for BEL.
HCL Tech
1,06,159
753
1,000
32.9
Stock is trading at attractive valuations & factors all bad news.
Back on the growth trend, expect a long term growth of 14% to
Infosys
2,46,680
1,074
1,374
27.9
be a US$20bn in FY2020.
Continues to grow its retail loan book at healthy pace with
LIC Housing Fin.
26,189
519
582
12.1
improvement in asset quality. Expect LICHF to post a healthy
loan book which is likely to reflect in a strong earnings growth.
Strong market positioning within the domestic AC markets to
Voltas
11,573
350
407
16.4
continue, EMP business set to revive
Source: Company, Angel Research
Mid Cap
M
arket Cap
CM
P
T
arget
Upsid
e
Company
Rationale
(` Cr)
(`)
(`)
(%)
Favourable outlook for the AC industry to augur well for
Cooling products business which is out pacing the market
4,641
487
537
10.3
Blue Star
growth. EMPPAC division's profitability to improve once
operating environment turns around.
With a focus on the low and medium income (LMI) consumer
Dewan Housing
6,513
223
270
21.0
segment, the company has increased its presence in tier-II & III
cities where the growth opportunity is immense.
Strong loan growth backed by diversified loan portfolio and
Equitas Holdings
6,578
196
235
19.8
adequate CAR. ROE & ROA likely to remain decent as risk of
dilution remains low. Attractive valuations considering growth.
Expectations of above average monsoon augurs well for
Goodyear India
1,207
523
631
20.6
Goodyear India as it derives ~50% of its turnover from farm
tyre segment.
Commencement of new projects, downtrend in the interest rate
IL&FS Transport
2,434
74
93
25.7
cycle, to lead to stock re-rating
Economic recovery to have favourable impact on advertising &
Jagran Prakashan
5,858
179
205
14.4
circulation revenue growth. Further, the acquisition of a radio business
(Radio City) would also boost the company`s revenue growth.
Speedier execution and speedier sales, strong revenue visibility
Mahindra Lifespace
1,825
445
554
24.5
in short-to-long run, attractive valuations
Massive capacity expansion along with rail advantage at ICD
Navkar Corporation
3,053
214
265
23.8
as well CFS augurs well for the company
Earnings boost on back of stable material prices and
Radico Khaitan
1,202
90
125
38.4
favourable pricing environment. Valuation discount to peers
provides additional comfort
Strong brands and distribution network would boost growth
Siyaram Silk Mills
963
1,028
1,347
31.1
going ahead. Stock currently trades at an inexpensive
valuation.
Source: Company, Angel Research
Market Outlook
August 01, 2016
Key Upcoming Events
Result Calendar
Date
Company
Aug 1, 2016
Blue Star, Tech Mahindra, Banco, Interglobe Aviation, VRL Logistics
Aug 2, 2016
Indian Bank, UFO Moviez
Aug 3, 2016
Ramco Cements, HCL Tech, Cadila Healthcare, Dishman Pharma, The Byke Hospitality
Aug 4, 2016
Siemens, Cummins India, Hindustan Media Ventures, Kirloskar Engines India Ltd, Tata Power Co.
Aug 5, 2016
Bharat Forge, LMW, GlaxoSmith Con, Quick Heal
Aug 6, 2016
Amara Raja Batteries, Mangalam Cement, Union Bank, Andhra Bank
Aug 8, 2016
Subros, Colgate, Britannia, Vesuvius India, Sterling Tools
Aug 9, 2016
Apollo Tyres, Finolex Cables, Lupin, Team Lease Serv., S H Kelkar & Co.
Aug 10, 2016
M&M, Motherson Sumi, Thermax, ITD Cementation
Source: Bloomberg, Angel Research
Global economic events release calendar
Date
Time
Country
Event Description
Unit
Period
Bloomberg Data
Last Reported Estimated
Aug 1, 2016
1:25PM
Germany
PMI Manufacturing
Value
Jul F
53.70
53.70
2:00PM
UK
PMI Manufacturing
Value
Jul F
49.10
49.10
1:25PM
Germany
PMI Services
Value
Jul F
54.60
54.60
Aug 3, 2016
6:30AM
China
PMI Manufacturing
Value
Jul
50.00
50.00
Aug 4, 2016
6:00PM
US
Initial Jobless claims
Thousands
Jul 30
266.00
265.00
6:00PM
US
Unnemployment rate
%
Jul
4.90
4.80
Aug 5, 2016
4:30PM
UK
BOE Announces rates
% Ratio
Aug 4
0.50
0.25
6:00PM
US
Change in Nonfarm payrolls
Thousands
Jul
287.00
175.00
Aug 8, 2016
China
Exports YoY%
% Change
Jul
(4.80)
(3.30)
Aug 9, 2016
7:00AM
China
Consumer Price Index (YoY)
% Change
Jul
1.90
1.90
2:00PM
UK
Industrial Production (YoY)
% Change
Jun
1.40
--
11:00AM
India
RBI Reverse Repo rate
%
Aug 9
6.00
--
11:00AM
India
RBI Repo rate
%
Aug 9
6.50
--
11:00AM
India
RBI Cash Reserve ratio
%
Aug 9
4.00
--
Aug 10, 2016
India
Imports YoY%
% Change
Jul
(7.30)
--
India
Exports YoY%
% Change
Jul
1.30
--
Aug 12, 2016 2:30PM
Euro Zone
Euro-Zone GDP s.a. (QoQ)
% Change
2Q P
0.30
--
7:30AM
China
Industrial Production (YoY)
% Change
Jul
6.20
--
US
Producer Price Index (mom)
% Change
Jul
0.80
--
5:30PM
India
Industrial Production YoY
% Change
Jun
1.20
--
11:30AM
Germany
GDP nsa (YoY)
% Change
2Q P
1.30
--
Aug 15, 2016 12:00PM
India
Monthly Wholesale Prices YoY%
% Change
Jul
1.62
--
Aug 16, 2016 6:00PM
US
Housing Starts
Thousands
Jul
1,189.00
--
6:00PM
US
Building permits
Thousands
Jul
1,153.00
--
2:00PM
UK
CPI (YoY)
% Change
Jul
0.50
--
6:00PM
US
Consumer price index (mom)
% Change
Jul
0.20
--
6:45PM
US
Industrial Production
%
Jul
0.60
--
Source: Bloomberg, Angel Research
Market Outlook
August 1, 2016
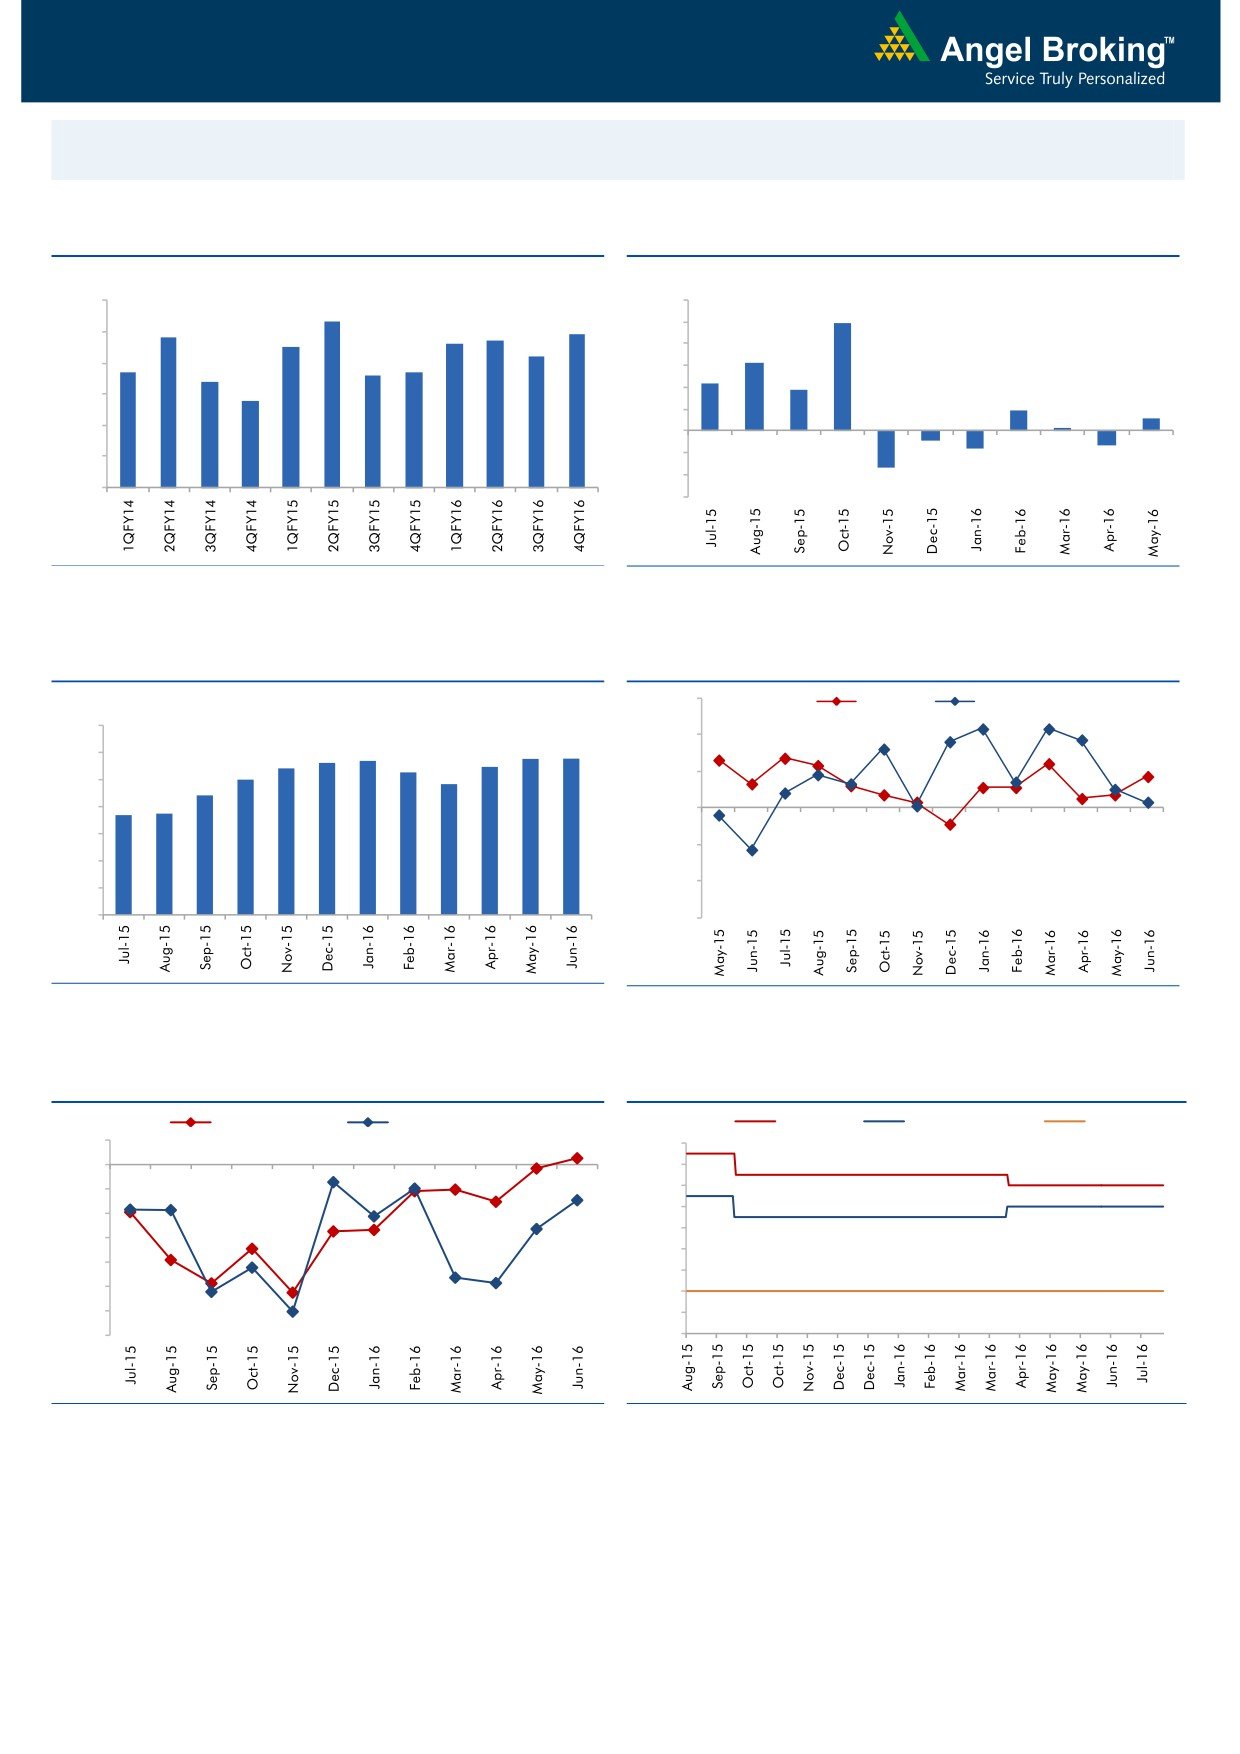
Macro watch
Exhibit 1: Quarterly GDP trends
Exhibit 2: IIP trends
(%)
(%)
9.0
8.3
12.0
9.9
7.8
7.7
7.9
10.0
8.0
7.5
7.6
7.2
8.0
6.3
6.7
6.6
6.7
7.0
6.4
6.0
4.3
3.7
5.8
4.0
6.0
1.9
1.2
2.0
0.3
5.0
-
4.0
(2.0)
(0.9)
(1.3)
(1.6)
(4.0)
3.0
(3.4)
(6.0)
Source: CSO, Angel Research
Source: MOSPI, Angel Research
Exhibit 3: Monthly CPI inflation trends
Exhibit 4: Manufacturing and services PMI
56.0
Mfg. PMI
Services PMI
(%)
7.0
54.0
5.7
5.8
5.8
5.4
5.6
5.5
6.0
5.3
5.0
4.8
52.0
5.0
4.4
3.7
3.7
4.0
50.0
3.0
48.0
2.0
46.0
1.0
-
44.0
Source: MOSPI, Angel Research
Source: Market, Angel Research; Note: Level above 50 indicates expansion
Exhibit 5: Exports and imports growth trends
Exhibit 6: Key policy rates
(%)
Exports yoy growth
Imports yoy growth
(%)
Repo rate
Reverse Repo rate
CRR
5.0
7.50
0.0
7.00
(5.0)
6.50
6.00
(10.0)
5.50
(15.0)
5.00
(20.0)
4.50
(25.0)
4.00
(30.0)
3.50
(35.0)
3.00
Source: Bloomberg, Angel Research
Source: RBI, Angel Research
Market Outlook
August 1, 2016
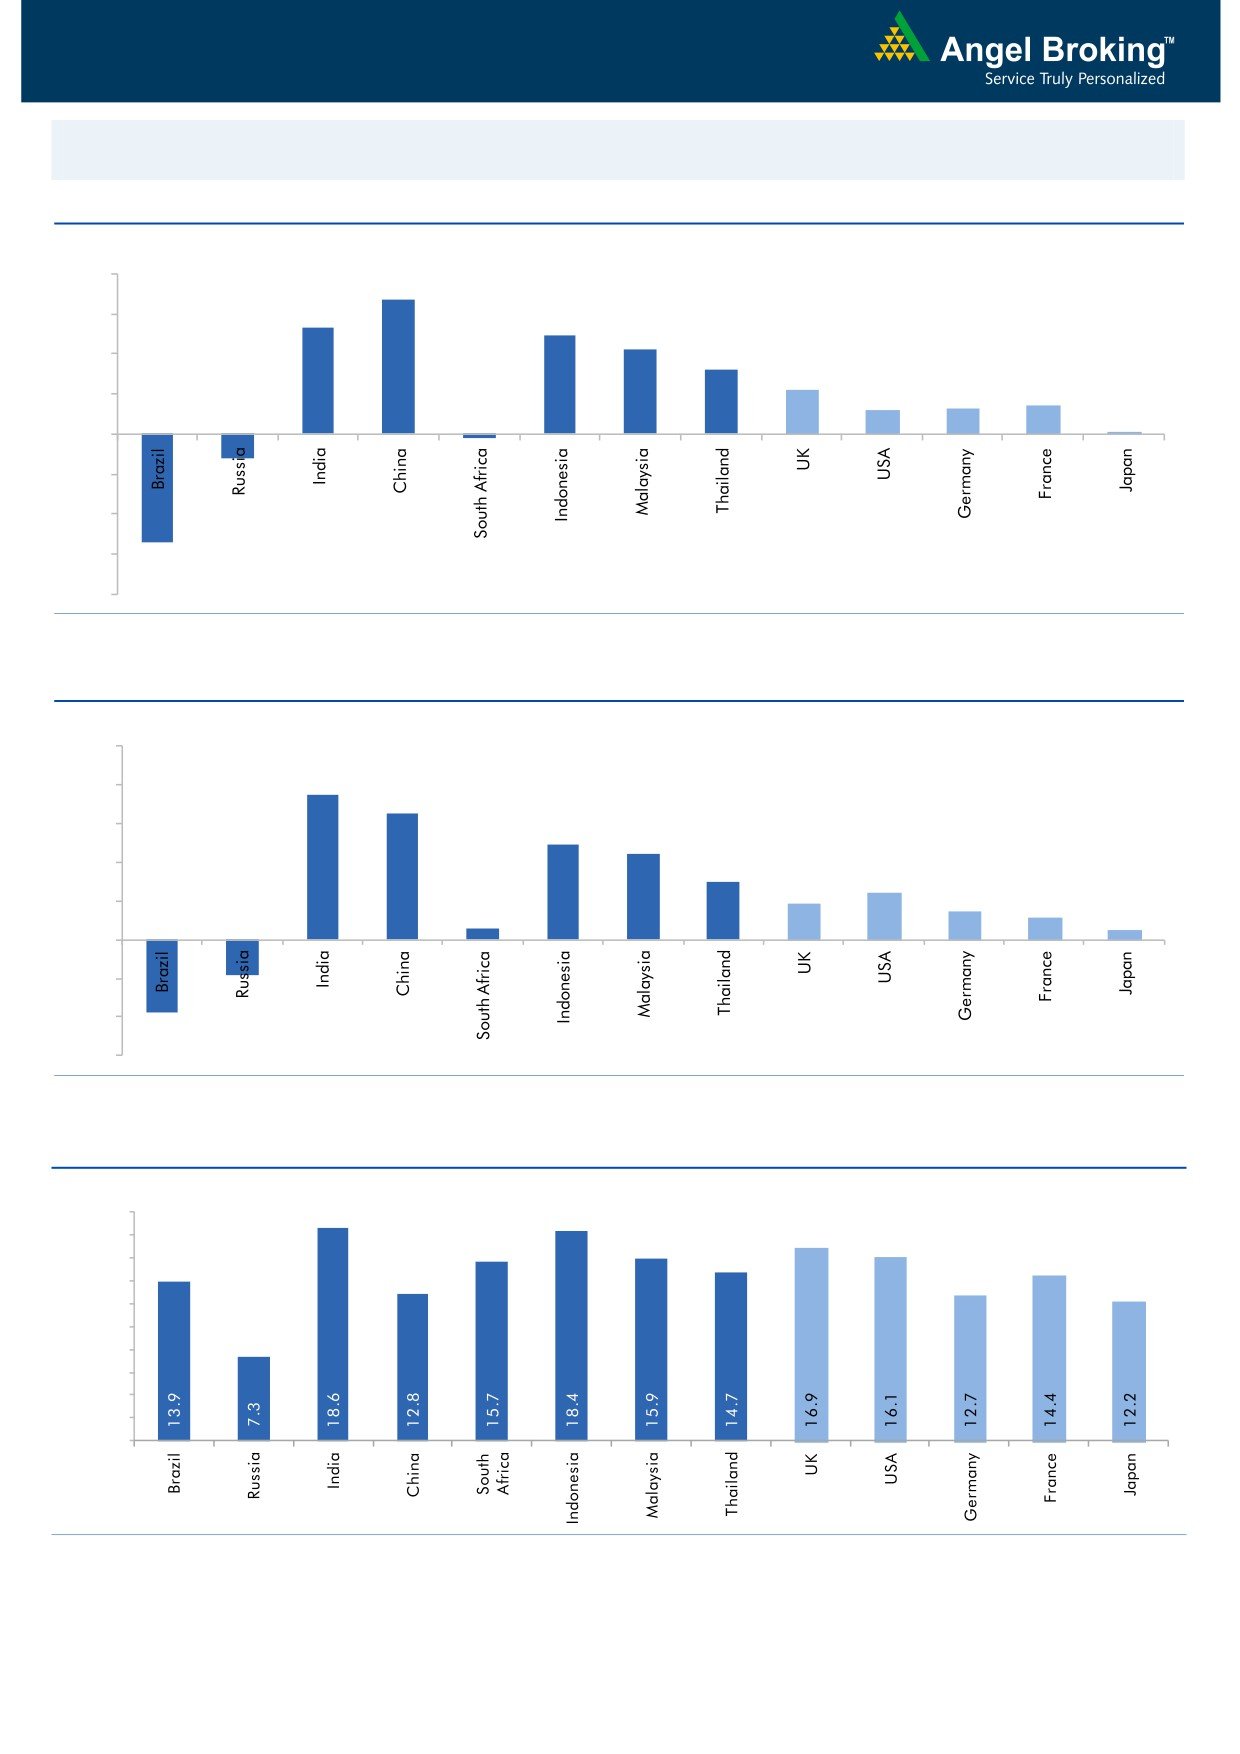
Global watch
Exhibit 1: Latest quarterly GDP Growth (%, yoy) across select developing and developed countries
(%)
8.0
6.7
6.0
5.3
4.9
4.2
4.0
3.2
2.2
1.3
1.4
2.0
1.2
0.1
-
(2.0)
(4.0)
(1.2)
(6.0)
(5.4)
(0.2)
(8.0)
Source: Bloomberg, Angel Research
Exhibit 2: 2016 GDP Growth projection by IMF (%, yoy) across select developing and developed countries
(%)
10.0
7.5
8.0
6.5
6.0
4.9
4.4
4.0
3.0
2.4
1.9
1.5
2.0
1.1
0.6
0.5
(3.8)
(1.8)
-
(2.0)
(4.0)
(6.0)
Source: IMF, Angel Research
Exhibit 3: One year forward P-E ratio across select developing and developed countries
(x)
20.0
18.0
16.0
14.0
12.0
10.0
8.0
6.0
4.0
2.0
-
Source: IMF, Angel Research
Market Outlook
August 1, 2016
Exhibit 4: Relative performance of indices across globe
Returns (%)
Country
Name of index
Closing price
1M
3M
1YR
Brazil
Bovespa
57,308
12.4
6.3
16.4
Russia
Micex
1,945
3.0
(0.1)
19.9
India
Nifty
8,639
6.3
10.0
0.6
China
Shanghai Composite
2,979
1.6
0.9
(25.8)
South Africa
Top 40
45,916
0.4
(1.9)
(0.4)
Mexico
Mexbol
46,661
2.6
2.1
4.3
Indonesia
LQ45
893
6.8
5.0
6.4
Malaysia
KLCI
1,653
1.5
(2.3)
(4.4)
Thailand
SET 50
964
8.0
6.1
(0.8)
USA
Dow Jones
18,432
5.9
3.4
4.2
UK
FTSE
6,724
5.7
6.4
0.5
Japan
Nikkei
16,569
8.1
(5.0)
(20.5)
Germany
DAX
10,338
7.5
3.0
(9.8)
France
CAC
4,440
5.8
(0.1)
(13.9)
Source: Bloomberg, Angel Research
Stock Watch
August 01, 2016
Company Name
Reco
CMP
Target
Mkt Cap
Sales ( Čcr )
OPM(%)
EPS (Č)
PER(x)
P/BV(x)
RoE(%)
EV/Sales(x)
(Č)
Price ( Č)
( Č cr )
FY16E FY17E
FY16E
FY17E
FY16E
FY17E
FY16E
FY17E
FY16E
FY17E
FY16E
FY17E
FY16E
FY17E
Agri / Agri Chemical
Rallis
Neutral
224
-
4,359
1,612
1,911
13.3
13.3
7.4
9.5
30.3
23.6
4.9
4.3
16.7
18.4
2.7
2.3
United Phosphorus
Accumulate
625
684
26,766
13,083
15,176
18.5
18.5
31.5
37.4
19.8
16.7
3.9
3.3
21.4
21.4
2.2
1.8
Auto & Auto Ancillary
Ashok Leyland
Buy
95
111
27,164
17,995
21,544
11.4
11.6
3.4
4.7
28.1
20.3
4.9
4.5
17.7
22.2
1.4
1.2
Bajaj Auto
Neutral
2,702
-
78,187
22,709
25,860
20.9
20.1
129.0
143.6
21.0
18.8
6.4
5.5
30.7
29.4
2.9
2.5
Bharat Forge
Buy
759
875
17,671
7,351
8,318
19.9
19.7
31.2
36.5
24.3
20.8
4.4
3.7
19.3
19.2
2.5
2.2
Eicher Motors
Neutral
22,461
-
61,006
15,556
16,747
15.5
17.3
464.8
597.5
48.3
37.6
17.7
13.0
36.2
34.3
3.6
3.3
Gabriel India
Neutral
102
-
1,466
1,415
1,544
8.7
9.0
4.6
5.4
22.2
18.9
4.0
3.6
18.1
18.9
1.0
0.9
Hero Motocorp
Neutral
3,206
-
64,029
28,244
30,532
15.5
15.9
156.7
168.5
20.5
19.0
8.2
6.9
39.9
36.4
2.1
1.9
Jamna Auto Industries Neutral
192
-
1,530
1,281
1,473
11.2
11.5
7.6
9.2
25.2
20.8
6.4
5.2
25.4
25.2
1.2
1.0
L G Balakrishnan & Bros Neutral
465
-
729
1,254
1,394
11.6
11.8
35.9
41.7
13.0
11.2
1.8
1.5
13.5
13.8
0.7
0.6
Mahindra and Mahindra Neutral
1,467
-
91,108
38,416
42,904
13.7
13.9
54.8
63.4
26.8
23.1
4.1
3.7
15.4
15.8
2.0
1.7
Maruti
Neutral
4,755
-
143,645
57,865
68,104
16.4
16.7
176.3
225.5
27.0
21.1
5.2
4.5
19.4
21.2
2.3
1.9
Minda Industries
Neutral
1,170
-
1,856
2,523
2,890
8.7
9.0
55.0
65.4
21.3
17.9
4.1
3.3
19.3
18.7
0.8
0.7
Motherson Sumi
Neutral
330
-
43,710
39,343
45,100
8.8
9.1
10.1
12.5
32.7
26.4
10.4
8.1
35.3
34.4
1.2
1.0
Rane Brake Lining
Neutral
587
-
465
454
511
11.5
12.0
25.2
31.0
23.3
18.9
3.5
3.1
14.9
16.6
1.2
1.1
Setco Automotive
Neutral
49
-
648
594
741
12.7
13.7
1.7
3.2
28.5
15.2
3.0
2.6
10.4
16.9
1.5
1.3
Tata Motors
Neutral
503
-
145,226
259,686
273,957
13.0
13.4
25.9
29.5
19.4
17.1
2.5
2.2
8.0
9.0
0.7
0.7
TVS Motor
Accumulate
291
330
13,844
11,263
13,122
6.9
8.5
9.2
15.0
31.7
19.4
7.2
5.8
22.7
29.6
1.2
1.0
Amara Raja Batteries
Buy
937
1,076
16,004
4,690
5,429
17.5
17.5
28.5
35.3
32.9
26.5
7.6
6.3
23.1
25.9
3.2
2.8
Exide Industries
Neutral
179
-
15,202
6,950
7,784
14.4
14.8
6.6
7.3
27.1
24.5
3.4
3.1
12.6
12.8
1.9
1.7
Apollo Tyres
Accumulate
163
183
8,302
12,056
12,714
17.2
16.4
23.0
20.3
7.1
8.0
1.3
1.1
17.7
13.6
0.7
0.8
Ceat
Buy
862
1,119
3,488
6,041
6,597
14.1
13.7
99.5
111.9
8.7
7.7
1.7
1.4
19.6
18.5
0.7
0.6
JK Tyres
Neutral
90
-
2,040
7,446
7,669
15.2
14.0
19.6
18.4
4.6
4.9
1.2
1.0
25.2
19.5
0.7
0.6
Swaraj Engines
Neutral
1,164
-
1,445
552
630
14.2
14.7
44.6
54.1
26.1
21.5
6.1
5.5
23.2
25.6
2.5
2.1
Subros
Neutral
96
-
577
1,293
1,527
11.8
11.9
4.2
6.7
22.9
14.4
1.7
1.6
7.7
11.5
0.8
0.6
Indag Rubber
Neutral
186
-
488
283
329
17.0
17.2
13.0
15.4
14.4
12.1
3.1
2.6
21.8
21.6
1.4
1.2
Capital Goods
ACE
Neutral
48
-
476
660
839
4.7
8.2
1.0
3.9
48.1
12.3
1.5
1.3
3.2
11.3
0.9
0.7
BEML
Buy
1,014
1,157
4,224
3,277
4,006
6.0
8.9
36.2
64.3
28.0
15.8
1.9
1.8
5.7
11.7
1.4
1.1
Bharat Electronics
Buy
1,236
1,414
29,662
7,295
8,137
20.0
16.8
56.5
58.7
21.9
21.1
3.3
2.9
42.1
44.6
3.2
2.7
Stock Watch
August 01, 2016
Company Name
Reco
CMP
Target
Mkt Cap
Sales ( Čcr )
OPM(%)
EPS (Č)
PER(x)
P/BV(x)
RoE(%)
EV/Sales(x)
(Č)
Price ( Č)
( Č cr )
FY16E
FY17E
FY16E
FY17E
FY16E
FY17E
FY16E
FY17E
FY16E
FY17E
FY16E
FY17E
FY16E
FY17E
Capital Goods
Voltas
Buy
350
407
11,573
5,857
6,511
7.5
7.9
11.7
12.9
29.9
27.1
4.9
4.3
17.1
16.7
2.0
1.8
BGR Energy
Neutral
121
-
870
3,615
3,181
9.5
9.4
16.7
12.4
7.2
9.7
0.7
0.7
10.0
7.0
0.7
0.8
BHEL
Neutral
146
-
35,686
33,722
35,272
10.8
11.7
10.5
14.2
13.9
10.3
1.0
1.0
7.0
9.0
1.2
1.1
Blue Star
Accumulate
487
537
4,641
3,770
4,351
5.7
6.4
11.4
17.2
42.6
28.4
6.6
6.2
18.4
23.1
1.3
1.1
Crompton Greaves
Neutral
78
-
4,914
13,484
14,687
4.9
6.2
4.5
7.1
17.4
11.0
1.2
1.2
7.2
10.8
0.5
0.4
Greaves Cotton
Neutral
144
-
3,509
1,655
1,755
16.6
16.8
7.4
7.8
19.4
18.4
3.9
3.7
21.1
20.6
2.1
2.0
Inox Wind
Buy
223
286
4,942
5,605
6,267
15.7
16.4
24.8
30.0
9.0
7.4
2.5
1.8
25.9
24.4
1.0
0.9
KEC International
Neutral
144
-
3,689
8,791
9,716
6.1
6.8
5.4
8.2
26.6
17.5
2.7
2.4
10.0
14.0
0.6
0.6
Thermax
Neutral
882
-
10,513
6,413
7,525
7.4
8.5
30.5
39.3
28.9
22.5
4.5
3.9
15.0
17.0
1.6
1.3
VATech Wabag
Buy
579
681
3,154
3,136
3,845
8.9
9.1
26.0
35.9
22.3
16.1
2.8
2.4
13.4
15.9
0.9
0.7
Cement
ACC
Neutral
1,690
-
31,735
13,151
14,757
16.4
18.3
63.9
83.4
26.5
20.3
3.4
3.1
13.3
16.1
2.2
1.9
Ambuja Cements
Neutral
271
-
42,080
11,564
12,556
19.4
20.7
8.9
10.1
30.5
26.9
3.8
3.6
12.8
13.8
3.3
3.0
HeidelbergCement
Neutral
127
-
2,867
1,772
1,926
13.3
15.4
1.0
3.0
126.5
42.2
3.2
3.0
2.6
7.9
2.2
1.9
India Cements
Neutral
124
-
3,820
4,216
4,840
18.0
19.5
4.0
9.9
31.1
12.6
1.2
1.2
4.0
9.5
1.2
1.0
JK Cement
Neutral
708
-
4,953
3,661
4,742
10.1
15.8
7.5
28.5
94.4
24.9
2.8
2.5
7.5
22.9
1.8
1.4
J K Lakshmi Cement
Neutral
426
-
5,007
2,947
3,616
16.7
19.9
11.5
27.2
37.0
15.7
3.5
3.0
9.8
20.8
2.1
1.7
Mangalam Cements
Neutral
298
-
796
1,053
1,347
10.5
13.3
8.4
26.0
35.5
11.5
1.5
1.4
4.3
12.5
1.1
0.8
Orient Cement
Neutral
170
-
3,487
1,854
2,524
21.2
22.2
7.7
11.1
22.1
15.3
3.2
2.7
13.3
15.7
2.6
1.8
Ramco Cements
Neutral
547
-
13,022
4,036
4,545
20.8
21.3
15.1
18.8
36.2
29.1
4.4
3.9
12.9
14.3
3.8
3.3
Shree Cement^
Neutral
16,110
-
56,122
7,150
8,742
26.7
28.6
228.0
345.5
70.6
46.6
10.4
8.7
15.7
20.3
7.7
6.2
UltraTech Cement
Neutral
3,706
-
101,700
24,669
29,265
18.2
20.6
82.0
120.0
45.2
30.9
4.9
4.3
11.3
14.7
4.2
3.5
Construction
ITNL
Buy
74
93
2,434
7,360
8,682
34.0
32.2
7.0
8.6
10.6
8.6
0.4
0.4
3.2
2.5
3.7
3.6
KNR Constructions
Neutral
598
-
1,683
937
1,470
14.3
14.0
44.2
38.6
13.5
15.5
2.7
2.3
15.4
15.4
1.9
1.2
Larsen & Toubro
Accumulate
1,558
1,700
145,207
58,870
65,708
8.3
10.3
42.0
53.0
37.1
29.4
2.6
2.3
8.8
11.2
2.7
2.5
Gujarat Pipavav Port
Neutral
172
-
8,318
629
684
51.0
52.2
6.4
5.9
26.9
29.2
3.5
3.3
15.9
12.7
13.1
11.8
MBL Infrastructures
Buy
135
285
561
2,313
2,797
12.2
14.6
19.0
20.0
7.1
6.8
0.7
0.7
11.3
10.6
1.0
0.9
Nagarjuna Const.
Neutral
82
-
4,539
7,892
8,842
8.8
9.1
3.0
5.3
27.2
15.4
1.4
1.3
5.0
8.5
0.8
0.7
PNC Infratech
Buy
578
647
2,965
1,873
2,288
13.2
13.5
24.0
32.0
24.1
18.1
2.3
2.1
12.1
12.3
1.6
1.4
Simplex Infra
Neutral
303
-
1,500
5,955
6,829
10.3
10.5
16.0
31.0
19.0
9.8
1.0
0.9
5.3
9.9
0.8
0.6
Stock Watch
August 01, 2016
Company Name
Reco
CMP
Target
Mkt Cap
Sales ( Čcr )
OPM(%)
EPS (Č)
PER(x)
P/BV(x)
RoE(%)
EV/Sales(x)
(Č)
Price ( Č)
( Č cr )
FY16E
FY17E
FY16E
FY17E
FY16E
FY17E
FY16E
FY17E
FY16E
FY17E
FY16E
FY17E
FY16E
FY17E
Construction
Power Mech Projects
Neutral
569
-
837
1,539
1,801
12.8
12.7
59.0
72.1
9.7
7.9
1.5
1.2
18.6
16.8
0.5
0.5
Sadbhav Engineering
Neutral
285
-
4,889
3,186
3,598
10.2
10.3
8.0
9.0
35.6
31.7
3.3
2.9
9.4
9.9
1.9
1.7
NBCC
Neutral
247
-
14,832
5,838
7,428
6.0
7.9
5.2
8.2
47.5
30.2
1.5
1.2
21.9
28.2
2.3
1.7
MEP Infra
Neutral
45
-
725
1,956
1,876
28.1
30.5
1.3
3.0
34.3
14.9
7.2
4.9
21.2
32.8
1.8
1.8
SIPL
Neutral
99
-
3,476
675
1,042
62.4
64.7
-
-
3.7
4.2
-
-
16.9
11.4
Engineers India
Neutral
227
-
7,654
1,667
1,725
13.5
16.0
9.7
11.4
23.4
19.9
2.8
2.7
11.7
13.4
3.3
3.3
Financials
Allahabad Bank
Neutral
77
-
5,582
8,569
9,392
2.8
2.9
16.3
27.5
4.7
2.8
0.4
0.4
7.6
11.9
-
-
Axis Bank
Neutral
546
-
130,329
26,204
29,738
3.6
3.5
34.5
35.4
15.8
15.4
2.5
2.2
16.8
14.9
-
-
Bank of Baroda
Neutral
152
-
35,069
18,802
21,088
2.0
2.2
(7.4)
13.0
11.7
1.2
1.0
(4.2)
7.3
-
-
Bank of India
Neutral
111
-
10,386
15,972
17,271
1.9
2.0
15.3
33.4
7.3
3.3
0.3
0.3
3.6
7.6
-
-
Canara Bank
Neutral
251
-
13,640
15,441
16,945
2.0
2.1
46.6
70.4
5.4
3.6
0.5
0.4
8.0
11.2
-
-
Dena Bank
Neutral
39
-
2,581
3,440
3,840
2.1
2.3
7.3
10.0
5.3
3.9
0.4
0.3
6.1
7.9
-
-
Dewan Housing Finance Buy
223
270
6,513
1,828
2,225
2.9
3.0
24.9
29.7
9.0
7.5
1.4
1.2
15.1
16.1
-
-
Equitas Holdings
Buy
196
235
6,578
679
1,076
12.4
11.7
6.2
6.7
31.7
29.3
4.0
2.9
13.3
12.5
-
-
Federal Bank
Neutral
65
-
11,117
3,279
3,787
2.8
2.9
3.9
5.5
16.4
11.7
1.3
1.2
8.4
10.8
-
-
HDFC
Neutral
1,374
-
217,280
10,358
11,852
3.3
3.3
41.1
47.0
33.5
29.2
6.4
5.8
24.7
24.9
-
-
HDFC Bank
Neutral
1,247
-
315,594
38,606
47,696
4.4
4.5
48.8
61.4
25.5
20.3
4.3
3.8
18.7
20.0
-
-
ICICI Bank
Neutral
263
-
152,898
34,279
39,262
3.3
3.3
21.0
24.4
12.5
10.8
2.1
1.8
14.4
14.7
-
-
IDBI Bank
Neutral
70
-
14,381
9,625
10,455
1.8
1.8
8.5
14.2
8.2
4.9
0.5
0.5
5.9
9.3
-
-
Indian Bank
Neutral
158
-
7,610
6,160
6,858
2.5
2.5
24.5
29.8
6.5
5.3
0.5
0.5
7.7
8.6
-
-
LIC Housing Finance
Accumulate
519
582
26,189
3,179
3,758
2.6
2.6
32.9
40.6
15.8
12.8
2.9
2.5
19.6
20.7
-
-
Oriental Bank
Neutral
117
-
4,042
7,643
8,373
2.4
2.4
37.2
45.4
3.1
2.6
0.3
0.3
8.2
9.4
-
-
Punjab Natl.Bank
Neutral
123
-
24,241
23,122
26,022
2.8
2.8
7.0
21.6
17.7
5.7
0.9
0.8
3.4
10.0
-
-
South Ind.Bank
Neutral
21
-
2,876
1,965
2,185
2.5
2.5
2.5
3.3
8.6
6.5
0.9
0.8
9.5
11.7
-
-
St Bk of India
Neutral
229
-
177,806
79,958
86,061
2.6
2.6
13.4
20.7
17.1
11.1
1.4
1.3
11.5
12.8
-
-
Union Bank
Neutral
127
-
8,761
12,646
14,129
2.3
2.4
31.0
39.1
4.1
3.3
0.4
0.4
9.8
11.4
-
-
Vijaya Bank
Neutral
41
-
4,115
3,536
3,827
1.9
1.9
5.5
6.7
7.5
6.2
0.6
0.6
7.8
8.8
-
-
Yes Bank
Neutral
1,217
-
51,244
7,190
9,011
3.2
3.3
58.2
69.7
20.9
17.5
3.7
3.2
19.2
19.6
-
-
FMCG
Asian Paints
Neutral
1,115
-
106,922
15,534
17,445
17.7
16.8
18.4
19.6
60.7
56.9
21.5
20.2
34.6
35.6
6.8
6.1
Stock Watch
August 01, 2016
Company Name
Reco
CMP
Target
Mkt Cap
Sales ( Čcr )
OPM(%)
EPS (Č)
PER(x)
P/BV(x)
RoE(%)
EV/Sales(x)
(Č)
Price ( Č)
( Č cr )
FY16E FY17E
FY16E
FY17E
FY16E
FY17E
FY16E
FY17E
FY16E
FY17E
FY16E
FY17E
FY16E
FY17E
FMCG
Britannia
Neutral
2,930
-
35,151
8,481
9,795
14.0
14.1
65.5
78.3
44.7
37.4
21.2
17.4
38.3
41.2
4.0
3.4
Colgate
Neutral
933
-
25,378
4,136
4,632
22.5
23.3
22.2
25.3
42.0
36.9
25.6
22.8
68.6
67.5
6.0
5.3
Dabur India
Neutral
304
-
53,425
9,370
10,265
17.6
17.3
7.3
8.1
41.4
37.5
10.7
9.8
31.7
30.6
5.6
5.1
GlaxoSmith Con*
Neutral
6,331
-
26,624
4,519
5,142
19.6
19.8
164.3
191.2
38.5
33.1
10.7
9.1
30.8
29.9
5.3
4.6
Godrej Consumer
Neutral
1,591
-
54,191
9,003
10,335
18.1
18.7
34.1
41.8
46.7
38.1
10.1
8.6
23.9
24.8
6.3
5.5
HUL
Neutral
922
-
199,435
33,194
35,252
17.8
17.6
19.0
20.4
48.5
45.1
42.7
37.1
87.4
82.2
5.8
5.4
ITC
Accumulate
252
283
304,728
36,837
40,059
38.7
39.0
8.2
9.1
31.0
27.8
8.6
7.6
27.8
27.2
7.8
7.1
Marico
Neutral
284
-
36,660
6,151
6,966
17.2
17.3
5.4
6.4
52.6
44.4
16.5
13.0
33.2
32.4
5.8
5.1
Nestle*
Neutral
7,166
-
69,088
9,393
10,507
22.2
22.3
106.8
121.8
67.1
58.8
23.6
21.2
34.8
36.7
7.2
6.4
Tata Global
Neutral
142
-
8,972
8,635
9,072
9.8
9.9
5.8
7.2
24.5
19.7
2.2
2.1
6.8
7.4
1.1
1.0
Procter & Gamble
Accumulate
6,590
7,369
21,393
2,588
2,939
23.3
23.2
130.2
146.2
50.6
45.1
100.9
96.8
27.6
25.3
7.6
6.6
Hygiene
IT
HCL Tech^
Buy
753
1,000
106,159
37,061
30,781
21.5
20.5
51.4
40.0
14.6
18.8
3.8
2.8
20.1
20.3
2.6
2.8
Infosys
Buy
1,074
1,374
246,680
62,441
70,558
27.5
27.5
59.0
65.3
18.2
16.5
3.7
3.3
22.2
22.4
3.4
2.9
TCS
Buy
2,619
3,004
515,966
108,646
122,770
28.3
28.3
123.7
141.0
21.2
18.6
7.0
6.4
33.1
34.6
4.3
3.7
Tech Mahindra
Buy
487
700
47,249
26,494
30,347
16.3
17.0
32.2
37.5
15.1
13.0
3.3
2.8
21.7
21.8
1.5
1.3
Wipro
Buy
545
680
134,728
50,808
56,189
23.7
23.8
37.3
40.7
14.6
13.4
2.8
2.5
19.2
17.7
2.2
1.8
Media
D B Corp
Neutral
401
-
7,371
2,025
2,187
27.4
27.4
17.4
18.9
23.0
21.3
5.2
4.7
22.9
23.7
3.7
3.4
HT Media
Neutral
85
-
1,975
2,495
2,673
12.9
13.2
6.8
7.2
12.5
11.8
1.0
0.9
7.5
7.8
0.4
0.3
Jagran Prakashan
Accumulate
179
205
5,858
2,107
2,355
33.5
28.0
10.1
10.8
17.8
16.6
4.2
3.6
23.3
21.7
2.9
2.5
Sun TV Network
Neutral
449
-
17,706
2,510
2,763
71.8
71.5
21.9
24.8
20.5
18.1
4.9
4.4
22.8
24.3
6.5
5.9
Hindustan Media
Neutral
275
-
2,015
914
1,016
21.7
21.5
21.9
23.3
12.5
11.8
2.3
1.9
18.0
16.2
1.6
1.4
Ventures
Metals & Mining
Coal India
Buy
328
380
207,177
76,167
84,130
19.9
22.3
22.4
25.8
14.6
12.7
5.3
5.1
35.5
41.0
2.1
1.8
Hind. Zinc
Neutral
204
-
86,112
14,641
14,026
50.4
50.4
17.7
16.0
11.6
12.7
1.8
1.6
16.2
13.2
3.5
3.4
Hindalco
Neutral
133
-
27,557
104,356
111,186
8.7
9.5
6.7
11.1
19.9
12.1
0.7
0.7
3.5
5.9
0.8
0.7
JSW Steel
Neutral
1,674
-
40,457
42,308
45,147
16.4
20.7
(10.3)
49.5
33.8
1.9
1.8
(1.0)
5.6
2.0
1.9
NMDC
Neutral
100
-
39,726
8,237
10,893
46.6
44.5
10.0
11.7
10.1
8.6
1.1
1.0
12.5
13.0
4.7
3.6
SAIL
Neutral
47
-
19,391
45,915
53,954
7.2
10.5
1.5
4.4
31.2
10.7
0.5
0.4
2.3
4.1
1.1
1.0
Vedanta
Neutral
165
-
48,814
71,445
81,910
26.2
26.3
12.9
19.2
12.8
8.6
0.9
0.8
7.2
8.9
1.2
0.9
Tata Steel
Neutral
355
-
34,454
126,760
137,307
8.9
11.3
6.4
23.1
55.8
15.4
1.1
1.1
2.0
7.1
0.8
0.8
Stock Watch
August 01, 2016
Company Name
Reco
CMP
Target
Mkt Cap
Sales ( Čcr )
OPM(%)
EPS (Č)
PER(x)
P/BV(x)
RoE(%)
EV/Sales(x)
(Č)
Price ( Č)
( Č cr )
FY16E FY17E
FY16E
FY17E
FY16E
FY17E
FY16E
FY17E
FY16E
FY17E
FY16E
FY17E
FY16E
FY17E
Oil & Gas
Cairn India
Neutral
191
-
35,810
11,323
12,490
49.4
51.0
20.7
20.7
9.2
9.3
0.6
0.6
6.4
6.1
2.3
1.6
GAIL
Neutral
382
-
48,481
64,856
70,933
9.1
9.6
24.0
28.9
16.0
13.2
1.4
1.3
8.8
9.6
0.9
0.8
ONGC
Neutral
220
-
188,178
154,564
145,998
36.8
37.4
20.8
22.6
10.6
9.7
1.0
0.9
10.1
9.7
1.4
1.6
Petronet LNG
Neutral
298
-
22,335
29,691
31,188
5.8
6.2
12.8
13.4
23.3
22.2
3.5
3.1
15.8
14.8
0.8
0.8
Indian Oil Corp
Neutral
544
-
132,178
359,607
402,760
5.9
6.1
42.5
48.7
12.8
11.2
1.7
1.5
14.1
14.4
0.5
0.4
Reliance Industries
Neutral
1,016
-
329,270
304,775
344,392
12.6
13.4
91.3
102.6
11.1
9.9
1.3
1.1
11.8
12.0
1.0
0.9
Pharmaceuticals
Alembic Pharma
Neutral
627
-
11,819
3,145
3,483
31.9
16.2
38.2
18.7
16.4
33.5
7.4
6.2
57.9
20.1
3.6
3.3
Aurobindo Pharma
Accumulate
792
880
46,363
13,651
15,702
21.7
21.7
33.9
38.4
23.4
20.6
6.6
5.1
32.5
27.7
3.6
3.2
Aventis*
Neutral
4,565
-
10,513
2,049
2,375
15.4
17.3
115.4
153.5
39.6
29.7
6.5
5.0
19.3
25.8
4.9
4.2
Cadila Healthcare
Accumulate
366
400
37,474
9,469
11,246
21.2
22.0
14.9
17.1
24.6
21.4
7.0
5.5
28.8
26.6
3.9
3.2
Cipla
Neutral
528
-
42,440
13,372
15,378
16.4
17.4
18.8
21.6
28.1
24.5
3.6
3.2
13.3
13.7
3.2
3.0
Dr Reddy's
Buy
2,937
3,476
50,092
15,471
17,479
24.6
24.6
138.2
152.4
21.3
19.3
3.9
3.3
19.7
18.7
3.2
2.8
Dishman Pharma
Neutral
156
-
2,523
1,733
1,906
21.5
21.5
10.1
10.0
15.5
15.6
1.8
1.6
10.5
11.2
2.0
1.7
GSK Pharma*
Neutral
3,315
-
28,076
2,741
3,528
16.5
18.9
44.2
60.1
75.0
55.2
16.6
16.4
21.2
29.9
10.0
7.8
Indoco Remedies
Neutral
308
-
2,842
977
1,112
14.9
18.2
9.0
13.2
34.3
23.4
4.9
4.2
15.1
19.2
3.2
2.8
Ipca labs
Buy
515
613
6,500
2,844
3,799
10.6
15.3
10.6
17.3
48.6
29.8
2.8
2.6
5.9
9.1
2.3
1.8
Lupin
Accumulate
1,741
1,809
78,480
13,702
15,912
23.7
26.4
50.5
58.1
34.5
30.0
7.1
5.8
22.9
21.4
6.1
4.9
Sun Pharma
Accumulate
830
944
199,695
27,744
31,129
26.0
30.0
22.0
28.0
37.7
29.6
5.5
4.5
18.3
18.7
7.0
6.0
Power
Tata Power
Neutral
72
-
19,473
35,923
37,402
22.6
22.8
4.1
5.2
17.8
14.0
1.4
1.3
7.5
9.3
1.5
1.4
NTPC
Neutral
158
-
130,649
87,271
99,297
23.5
23.5
11.8
13.3
13.5
11.9
1.5
1.4
11.5
12.2
2.5
2.2
Power Grid
Neutral
176
-
92,024
20,702
23,361
86.7
86.4
12.1
13.2
14.6
13.3
2.1
1.9
15.6
15.1
9.4
8.7
Real Estate
MLIFE
Buy
445
554
1,825
826
1,011
20.1
21.9
22.7
30.7
19.6
14.5
1.2
1.1
6.0
7.4
4.2
3.1
Telecom
Bharti Airtel
Neutral
362
-
144,726
101,748
109,191
32.1
31.7
12.0
12.5
30.2
29.0
2.1
2.0
6.9
6.7
2.1
1.9
Idea Cellular
Neutral
105
-
37,628
34,282
36,941
32.0
31.5
5.9
6.2
17.7
16.9
1.6
1.5
9.9
9.3
1.7
1.6
zOthers
Abbott India
Neutral
4,645
-
9,871
2,715
3,153
14.5
14.1
134.3
152.2
34.6
30.5
8.6
7.1
27.4
25.6
3.4
2.8
Bajaj Electricals
Neutral
267
-
2,701
4,612
5,351
5.6
5.7
9.5
12.4
28.2
21.6
3.5
3.1
12.5
14.4
0.6
0.5
Finolex Cables
Neutral
394
-
6,027
2,520
2,883
12.2
12.0
12.7
14.2
31.1
27.8
4.2
3.8
13.6
13.5
2.1
1.8
Goodyear India*
Buy
523
631
1,207
1,750
1,598
11.3
10.4
53.7
49.4
9.7
10.6
2.1
1.8
23.0
18.2
0.5
0.5
Hitachi
Neutral
1,448
-
3,938
1,779
2,081
7.8
8.8
21.8
33.4
66.4
43.3
10.7
8.7
17.4
22.1
2.3
2.0
Stock Watch
August 01, 2016
Company Name
Reco
CMP
Target
Mkt Cap
Sales ( Čcr )
OPM(%)
EPS (Č)
PER(x)
P/BV(x)
RoE(%)
EV/Sales(x)
(Č)
Price ( Č)
( Č cr )
FY16E
FY17E
FY16E
FY17E
FY16E
FY17E
FY16E
FY17E
FY16E
FY17E
FY16E
FY17E
FY16E
FY17E
zOthers
Jyothy Laboratories
Neutral
287
-
5,203
1,620
1,847
11.5
11.5
7.3
8.5
39.4
33.9
5.1
4.7
13.3
14.4
3.1
2.6
MRF
Buy
33,798
45,575
14,334
20,316
14,488
21.4
21.1
5,488.0
3,798.0
6.2
8.9
2.1
1.7
41.1
21.2
0.7
0.9
Page Industries
Neutral
14,318
-
15,970
1,929
2,450
19.8
20.1
229.9
299.0
62.3
47.9
27.5
19.1
52.1
47.1
7.9
6.2
Relaxo Footwears
Neutral
491
-
5,899
1,767
2,152
12.3
12.5
19.3
25.1
25.5
19.6
6.3
4.8
27.7
27.8
3.4
2.8
Siyaram Silk Mills
Buy
1,028
1,347
963
1,619
1,799
11.6
11.6
93.5
104.9
11.0
9.8
1.9
1.6
17.1
16.4
0.8
0.8
Styrolution ABS India* Neutral
614
-
1,079
1,271
1,440
8.6
9.2
32.0
41.1
19.2
15.0
2.0
1.8
10.7
12.4
0.8
0.7
TVS Srichakra
Buy
2,352
2,932
1,801
2,035
2,252
15.9
15.3
248.6
268.1
9.5
8.8
4.1
3.0
43.6
33.9
0.9
0.8
HSIL
Neutral
313
-
2,261
2,123
2,384
16.1
16.5
15.0
18.9
20.8
16.6
1.6
1.5
8.0
9.4
1.4
1.2
Kirloskar Engines India
Neutral
277
-
4,009
2,403
2,554
8.6
9.9
9.2
10.5
30.2
26.4
2.9
2.8
9.7
10.7
1.3
1.2
Ltd
M M Forgings
Buy
426
546
514
511
615
21.7
21.6
43.1
55.8
9.9
7.6
1.8
1.5
19.9
21.2
1.2
0.9
Banco Products (India) Neutral
170
-
1,213
1,208
1,353
11.0
12.3
10.8
14.5
15.7
11.7
1.8
1.6
11.9
14.5
1.0
0.9
Competent Automobiles Neutral
175
-
107
1,040
1,137
3.2
3.1
25.7
28.0
6.8
6.2
1.0
0.9
15.0
14.3
0.1
0.1
Nilkamal
Neutral
1,271
-
1,897
1,871
2,031
10.7
10.5
63.2
69.8
20.1
18.2
3.3
2.8
17.6
16.6
1.1
1.0
Visaka Industries
Neutral
161
-
256
1,020
1,120
8.7
9.1
13.9
20.1
11.6
8.0
0.7
0.7
6.4
8.7
0.5
0.4
Transport Corporation of
Neutral
373
-
2,857
2,830
3,350
8.8
9.0
14.4
18.3
26.0
20.4
4.0
3.5
15.4
17.1
1.1
1.0
India
Elecon Engineering
Neutral
60
-
648
1,359
1,482
10.3
13.7
0.8
3.9
74.1
15.3
1.2
1.2
1.6
7.8
0.8
0.8
Surya Roshni
Buy
169
201
740
2,992
3,223
8.1
8.4
14.7
18.3
11.5
9.2
1.1
1.0
9.7
11.0
0.5
0.5
MT Educare
Neutral
155
-
619
286
366
18.3
17.7
7.7
9.4
20.1
16.6
4.2
3.7
20.2
21.1
2.1
1.6
Radico Khaitan
Buy
90
125
1,202
1,543
1,659
12.6
13.0
5.8
6.3
15.6
14.3
1.3
1.2
8.5
8.6
1.3
1.2
Garware Wall Ropes
Neutral
453
-
991
828
898
11.2
10.3
28.3
29.0
16.0
15.6
2.7
2.3
16.8
14.9
1.1
1.0
Wonderla Holidays
Neutral
412
-
2,326
206
308
44.0
43.6
9.0
12.9
45.7
31.9
6.3
5.7
13.7
17.8
11.0
7.4
Linc Pen & Plastics
Neutral
274
-
406
344
382
9.1
9.1
12.4
13.1
22.1
21.0
4.0
3.5
18.0
16.7
1.3
1.1
The Byke Hospitality
Neutral
163
-
652
222
287
20.5
20.5
5.6
7.6
28.8
21.5
5.4
4.5
18.9
20.8
3.0
2.3
Interglobe Aviation
Neutral
988
-
35,596
17,022
21,122
20.7
14.5
63.9
53.7
15.5
18.4
23.2
19.0
149.9
103.2
2.0
1.6
Coffee Day Enterprises
Neutral
245
-
5,045
2,692
2,964
17.0
18.6
-
4.7
-
51.7
3.0
2.8
0.2
5.5
2.3
2.1
Ltd
Navneet Education
Neutral
98
-
2,339
998
1,062
24.1
24.0
5.8
6.1
17.1
16.1
3.8
3.3
22.0
20.6
2.4
2.3
Navkar Corporation
Buy
214
265
3,053
347
408
43.2
42.9
6.7
6.8
32.1
31.6
2.4
2.2
7.3
6.9
9.4
8.5
UFO Moviez
Neutral
578
-
1,596
558
619
32.0
33.2
22.5
30.0
25.7
19.3
3.1
2.7
12.0
13.8
2.8
2.4
VRL Logistics
Neutral
361
-
3,294
1,725
1,902
16.5
16.7
12.2
14.6
29.7
24.8
6.2
5.4
20.8
21.9
2.1
1.8
Stock Watch
August 01, 2016
Company Name
Reco
CMP
Target Mkt Cap
Sales ( Čcr )
OPM(%)
EPS (Č)
PER(x)
P/BV(x)
RoE(%)
EV/Sales(x)
(Č)
Price ( Č)
( Č cr )
FY16E FY17E FY16E FY17E FY16E FY17E FY16E FY17E FY16E FY17E FY16E FY17E FY16E FY17E
zOthers
Team Lease Serv.
Neutral
1,047
-
1,789
2,565
3,229
1.3
1.5
15.2
22.8
69.0
46.0
5.5
4.9
8.0
10.7
0.6
0.5
S H Kelkar & Co.
Neutral
255
-
3,686
928
1,036
15.3
15.1
4.9
6.1
51.6
41.7
4.8
4.5
9.4
10.7
3.9
3.4
Quick Heal
Neutral
275
-
1,925
339
408
27.8
27.3
7.1
7.7
38.9
35.5
3.3
3.3
8.5
9.3
4.7
4.0
Narayana Hrudaya
Neutral
291
-
5,948
1,603
1,873
10.9
11.5
1.0
2.6
305.5
110.0
7.4
6.8
2.4
6.1
3.8
3.3
Manpasand Bever.
Neutral
678
-
3,393
540
836
19.9
19.6
10.2
16.9
66.2
40.1
5.4
4.8
8.1
12.0
5.9
3.8
Parag Milk Foods
Neutral
323
-
2,718
1,645
1,919
9.0
9.3
6.7
9.5
48.1
34.2
6.3
5.3
13.1
15.5
1.9
1.6
Source: Company, Angel Research; Note: *December year end; #September year end; &October year end; Price as on July 29, 2016
Market Outlook
August 01, 2016
Research Team Tel: 022 - 39357800
DISCLAIMER
Angel Broking Private Limited (hereinafter referred to as “Angel”) is a registered Member of National Stock Exchange of India Limited,
Bombay Stock Exchange Limited and Metropolitian Stock Exchange of India Limited. It is also registered as a Depository Participant with
CDSL and Portfolio Manager with SEBI. It also has registration with AMFI as a Mutual Fund Distributor. Angel Broking Private Limited is a
registered entity with SEBI for Research Analyst in terms of SEBI (Research Analyst) Regulations, 2014 vide registration number
INH000000164. Angel or its associates has not been debarred/ suspended by SEBI or any other regulatory authority for accessing
/dealing in securities Market. Angel or its associates including its relatives/analyst do not hold any financial interest/beneficial ownership
of more than 1% in the company covered by Analyst. Angel or its associates/analyst has not received any compensation / managed or co
-managed public offering of securities of the company covered by Analyst during the past twelve months. Angel/analyst has not served as
an officer, director or employee of company covered by Analyst and has not been engaged in market making activity of the company
covered by Analyst.
This document is solely for the personal information of the recipient, and must not be singularly used as the basis of any investment
decision. Nothing in this document should be construed as investment or financial advice. Each recipient of this document should make
such investigations as they deem necessary to arrive at an independent evaluation of an investment in the securities of the companies
referred to in this document (including the merits and risks involved), and should consult their own advisors to determine the merits and
risks of such an investment.
Reports based on technical and derivative analysis center on studying charts of a stock's price movement, outstanding positions and
trading volume, as opposed to focusing on a company's fundamentals and, as such, may not match with a report on a company's
fundamentals.
The information in this document has been printed on the basis of publicly available information, internal data and other reliable sources
believed to be true, but we do not represent that it is accurate or complete and it should not be relied on as such, as this document is for
general guidance only. Angel Broking Pvt. Limited or any of its affiliates/ group companies shall not be in any way responsible for any
loss or damage that may arise to any person from any inadvertent error in the information contained in this report. Angel Broking Pvt.
Limited has not independently verified all the information contained within this document. Accordingly, we cannot testify, nor make any
representation or warranty, express or implied, to the accuracy, contents or data contained within this document. While Angel Broking
Pvt. Limited endeavors to update on a reasonable basis the information discussed in this material, there may be regulatory, compliance,
or other reasons that prevent us from doing so.
This document is being supplied to you solely for your information, and its contents, information or data may not be reproduced,
redistributed or passed on, directly or indirectly.
Neither Angel Broking Pvt. Limited, nor its directors, employees or affiliates shall be liable for any loss or damage that may arise from or
in connection with the use of this information.
Note: Please refer to the important ‘Stock Holding Disclosure' report on the Angel website (Research Section). Also, please refer to the
latest update on respective stocks for the disclosure status in respect of those stocks. Angel Broking Pvt. Limited and its affiliates may have
investment positions in the stocks recommended in this report.