Market Outlook
June 1, 2016
T
Market Cues
Domestic Indices
Chg (%)
(Pts)
(Close)
BSE Sensex
(0.2)
(58)
26,668
Indian Markets are expected to open on a flat note tracking the SGX Nifty and
Nifty
(0.2)
(18)
8,160
Global cues.
Mid Cap
(0.2)
(20)
11,366
US Markets closed on a mixed close as traders shrugged off the data from the
Small Cap
(0.1)
(15)
11,142
commerce department which showed that the US consumer spending rose by 1% in
May while Conference Board survey showed its consumer confidence index fell to
Bankex
0.7
135
20,112
92.6 in May from 94.7 in April.
Major European markets ended lower on Tuesday on mixed reaction to economic
Global Indices
Chg (%)
(Pts)
(Close)
reports from Europe which showed that Eurozone consumer prices dropped in May
Dow Jones
(0.5)
(86)
17,787
while the unemployment rate was stable. The fears of Britain exiting the European
Nasdaq
0.3
15
4,948
Union weighed down on European markets.
FTSE
(0.6)
(40)
6,231
Indian markets edged down yesterday after five consecutive sessions of gains as
Nikkei
1.0
167
17,235
investors took profits while remaining cautious ahead of annual GDP numbers which
Hang Seng
0.9
186
20,815
were to be released later in the day.
Shanghai Com
3.3
94
2,917
News Analysis
India economy posts 7.6% annual growth
Advances / Declines
BSE
NSE
PVR completes DT cinemas acquisition
Advances
995
590
Detailed analysis on Pg2
Declines
1,588
970
Investor’s Ready Reckoner
Unchanged
162
72
Key Domestic & Global Indicators
Volumes (` Cr)
Stock Watch: Latest investment recommendations on 150+ stocks
Refer Pg4 onwards
BSE
3,866
NSE
35,856
Top Picks
CMP
Target
Upside
Company
Sector
Rating
(`)
(`)
(%)
Net Inflows (` Cr)
Net
Mtd
Ytd
Amara Raja
Auto/Auto Ancillary
Buy
841
1,076
28.0
FII
390
2,559
14,349
HCL Tech
IT
Buy
740
1,000
35.2
MFs
326
5,830
8,425
LIC Housing
Financials
Buy
469
592
26.0
Bharat Electronics
Capital Goods
Buy
1,178
1,414
20.0
Top Gainers
Price (`)
Chg (%)
Navkar Corporation Others
Buy
200
265
32.4
Tatamotors
458
9.0
More Top Picks on Pg3
Canbk
206
6.6
Key Upcoming Events
Supremeind
986
5.5
Previous
Consensus
Date
Region
Event Description
Reading
Expectations
Feldvr
17
5.4
June 01 UK
PMI Manufacturing
49.2
49.6
Justdial
678
5.1
June 01 China
PMI Manufacturing
50.1
50.0
June 02 US
Initial Jobless claims
268.0
270.0
Top Losers
Price (`)
Chg (%)
June 03 Euro Zone
ECB announces interest rates
0.0
--
6.(
Gvkpil
5
(7.7)
More Events on Pg4
Amtekauto
32
(6.8)
Mfsl
356
(6.6)
Sunpharma
763
(6.1)
Trent
1,639
(5.9)
As on May 31, 2016
Market Outlook
June 1, 2016
India economy posts 7.6% annual growth
India’s Quarterly GDP leapt by 7.9% per cent in March quarter from a revised
7.2% in the previous quarter while the full year growth stood at 7.6%.
The sectors registering growth rate of more than 7% during year were; financial,
real estate and professional services (10.3%), manufacturing (9.3%), trade, hotels,
transport, communication and services related to broadcasting (9%), and mining
and quarrying (7.4%).
Agriculture, forestry and fishing grew by 1.2% and construction by 3.9%. Electricity,
gas, water supply and other utility services posted growth of 6.6%, as did the
public administration, defence and other services sector.
PVR completes DT cinemas acquisition
PVR has announced that it has closed the deal on its acquisition of DT cinemas
which was announced in 2015. The company has initially agreed to acquire 39
screens for consideration of
`500cr but the deal was scrutinized by the
Competition Commission of India (CCI).
The Company on May 30, 2016 executed an amendment agreement with DLF (DT
Cinemas) for exclusion of DT Savitri (1 screen) and DT Saket (6 screens) from the
aforementioned transaction (as per condition by the CCI). As a result, the
company will acquire 32 screens at outlay of `433cr.
The cinema exhibition space in India has been going through a consolidation
phase over the last few years where major players like PVR, Inox Leisure, Carnival
and Cinepolis have been acquiring smaller/other multiplexes thereby creating a
strong footing for themselves. PVR is a most recognized multiplex in India with a
leadership position and market share of ~27% amongst all multiplexes (prior to
the acquisition). Such consolidation will not only drive revenues for the cinema
operators but also provides them an edge in terms of both in ticket pricing as well
negotiating better terms with the content providers.
Economic and Political News
Petrol price up by `2.58 per litre, diesel by `2.26
Govt bullish on farm sector growth on hopes of good monsoon
World Bank to offer $9.2 million grant for city bus projects
Corporate News
Glenmark plans to raise up to $200 million via FCCBs
New Sanofi vaccine facility starts commercial production
Reliance Industries temporarily shuts PET, PTA units at Dahej on water
shortage
Market Outlook
June 1, 2016
Top Picks ★★★★★
Large Cap
Market Cap
CMP
Target
Upside
Company
Rationale
(` Cr)
(`)
(`)
(%)
To outpace battery industry growth due to better technological
Amara Raja Batteries
14,361
841
1,076
28.0
products leading to market share gains in both the automotive
OEM and replacement segments.
Uptick in defense capex by government when coupled with
Bharat Electronics
28,278
1,178
1,414
20.0
BELs strong market positioning, indicate that good times are
ahead for BEL.
The stock is trading at attractive valuations and is factoring all
HCL Tech
1,04,367
740
1,000
35.2
the bad news.
Strong visibility for a robust 20% earnings trajectory, coupled
HDFC Bank
2,98,791
1,181
1,262
6.8
with high quality of earnings on account of high quality retail
business and strategic focus on highly rated corporates.
Back on the growth trend, expect a long term growth of 14%
Infosys
2,87,084
1,250
1,374
9.9
to be a US$20bn in FY2020.
LICHF continues to grow its retail loan book at a healthy pace
with improvement in asset quality. We expect the company to
LIC Housing Finance
23,691
469
592
26.0
post a healthy loan book which is likely to reflect in a strong
earnings growth.
Huge bid pipeline of re-development works at Delhi and other
NBCC
11,375
948
1,098
15.8
State Governments and opportunity from Smart City, positions
NBCC to report strong growth, going forward.
Source: Company, Angel Research
Mid Cap
Market Cap
CMP
Target
Upside
Company
Rationale
(` Cr)
(`)
(`)
(%)
Favorable outlook for the AC industry to augur well for
Cooling products business which is out pacing the market
Blue Star
3,742
416
481
15.6
growth. EMPPAC division's profitability to improve once
operating environment turns around.
With a focus on the low and medium income (LMI) consumer
Dewan Housing
5,792
199
270
36.0
segment, the company has increased its presence in tier-II &
III cities where the growth opportunity is immense.
Commencement of new projects, downtrend in the interest
IL&FS Transport
2,270
69
93
34.8
rate cycle, to lead to stock re-rating
Economic recovery to have favourable impact on advertising
& circulation revenue growth. Further, the acquisition of a
Jagran Prakashan
5,522
169
205
21.4
radio business (Radio City) would also boost the company's
revenue growth.
Speedier execution and speedier sales, strong revenue visibilty
Mahindra Lifespace
1,824
445
554
24.6
in short-to-long run, attractive valuations
Massive capacity expansion along with rail advantage at ICD
Navkar Corporation
2,854
200
265
32.4
as well CFS augurs well for the company
Earnings boost on back of stable material prices and
Radico Khaitan
1,137
86
125
46.2
favourable pricing environment. Valuation discount to peers
provides additional comfort
Strong brands and distribution network would boost growth
Siyaram Silk Mills
958
1,022
1,354
32.5
going ahead. Stock currently trades at an inexpensive
valuation.
Source: Company, Angel Research
Market Outlook
June 01, 2016
Key Upcoming Events
Global economic events release calendar
Date
Time
Country
Event Description
Unit
Period
Bloomberg Data
Last Reported Estimated
Jun 1, 2016
2:00PM
UK
PMI Manufacturing
Value
May
49.20
49.60
1:25PM
Germany
PMI Manufacturing
Value
May F
52.40
52.40
6:30AM
China
PMI Manufacturing
Value
May
50.10
50.00
Jun 2, 2016
1:25PM
Germany
PMI Services
Value
May F
55.20
55.20
6:00PM
US
Initial Jobless claims
Thousands
May 28
268.00
270.00
Jun 3, 2016
5:15PM
Euro Zone
ECB announces interest rates
%
Jun 2
--
--
6:00PM
US
Change in Nonfarm payrolls
Thousands
May
160.00
160.00
6:00PM
US
Unnemployment rate
%
May
5.00
5.00
Jun 7, 2016
2:30PM
Euro Zone
Euro-Zone GDP s.a. (QoQ)
% Change
1Q F
0.50
--
11:00AM
India
RBI Reverse Repo rate
%
Jun 7
6.00
--
11:00AM
India
RBI Repo rate
%
Jun 7
6.50
--
11:00AM
India
RBI Cash Reserve ratio
%
Jun 7
4.00
--
Jun 8, 2016
2:00PM
UK
Industrial Production (YoY)
% Change
Apr
(0.20)
--
China
Exports YoY%
% Change
May
(1.80)
--
Jun 9, 2016
7:00AM
China
Consumer Price Index (YoY)
% Change
May
2.30
2.30
Jun 10, 2016
India
Exports YoY%
% Change
May
(6.70)
--
India
Imports YoY%
% Change
May
(23.10)
--
5:30PM
India
Industrial Production YoY
% Change
Apr
0.10
--
Jun 12, 2016
11:00AM
China
Industrial Production (YoY)
% Change
May
6.00
6.20
Jun 14, 2016
12:00PM
India
Monthly Wholesale Prices YoY%
% Change
May
0.34
--
2:00PM
UK
CPI (YoY)
% Change
May
0.30
--
Jun 15, 2016
2:00PM
UK
Jobless claims change
% Change
May
(2.40)
--
US
Producer Price Index (mom)
% Change
May
0.20
--
6:45PM
US
Industrial Production
%
May
0.66
--
11:30PM
US
FOMC rate decision
%
Jun 15
0.50
0.50
Source: Bloomberg, Angel Research
Market Outlook
June 1, 2016
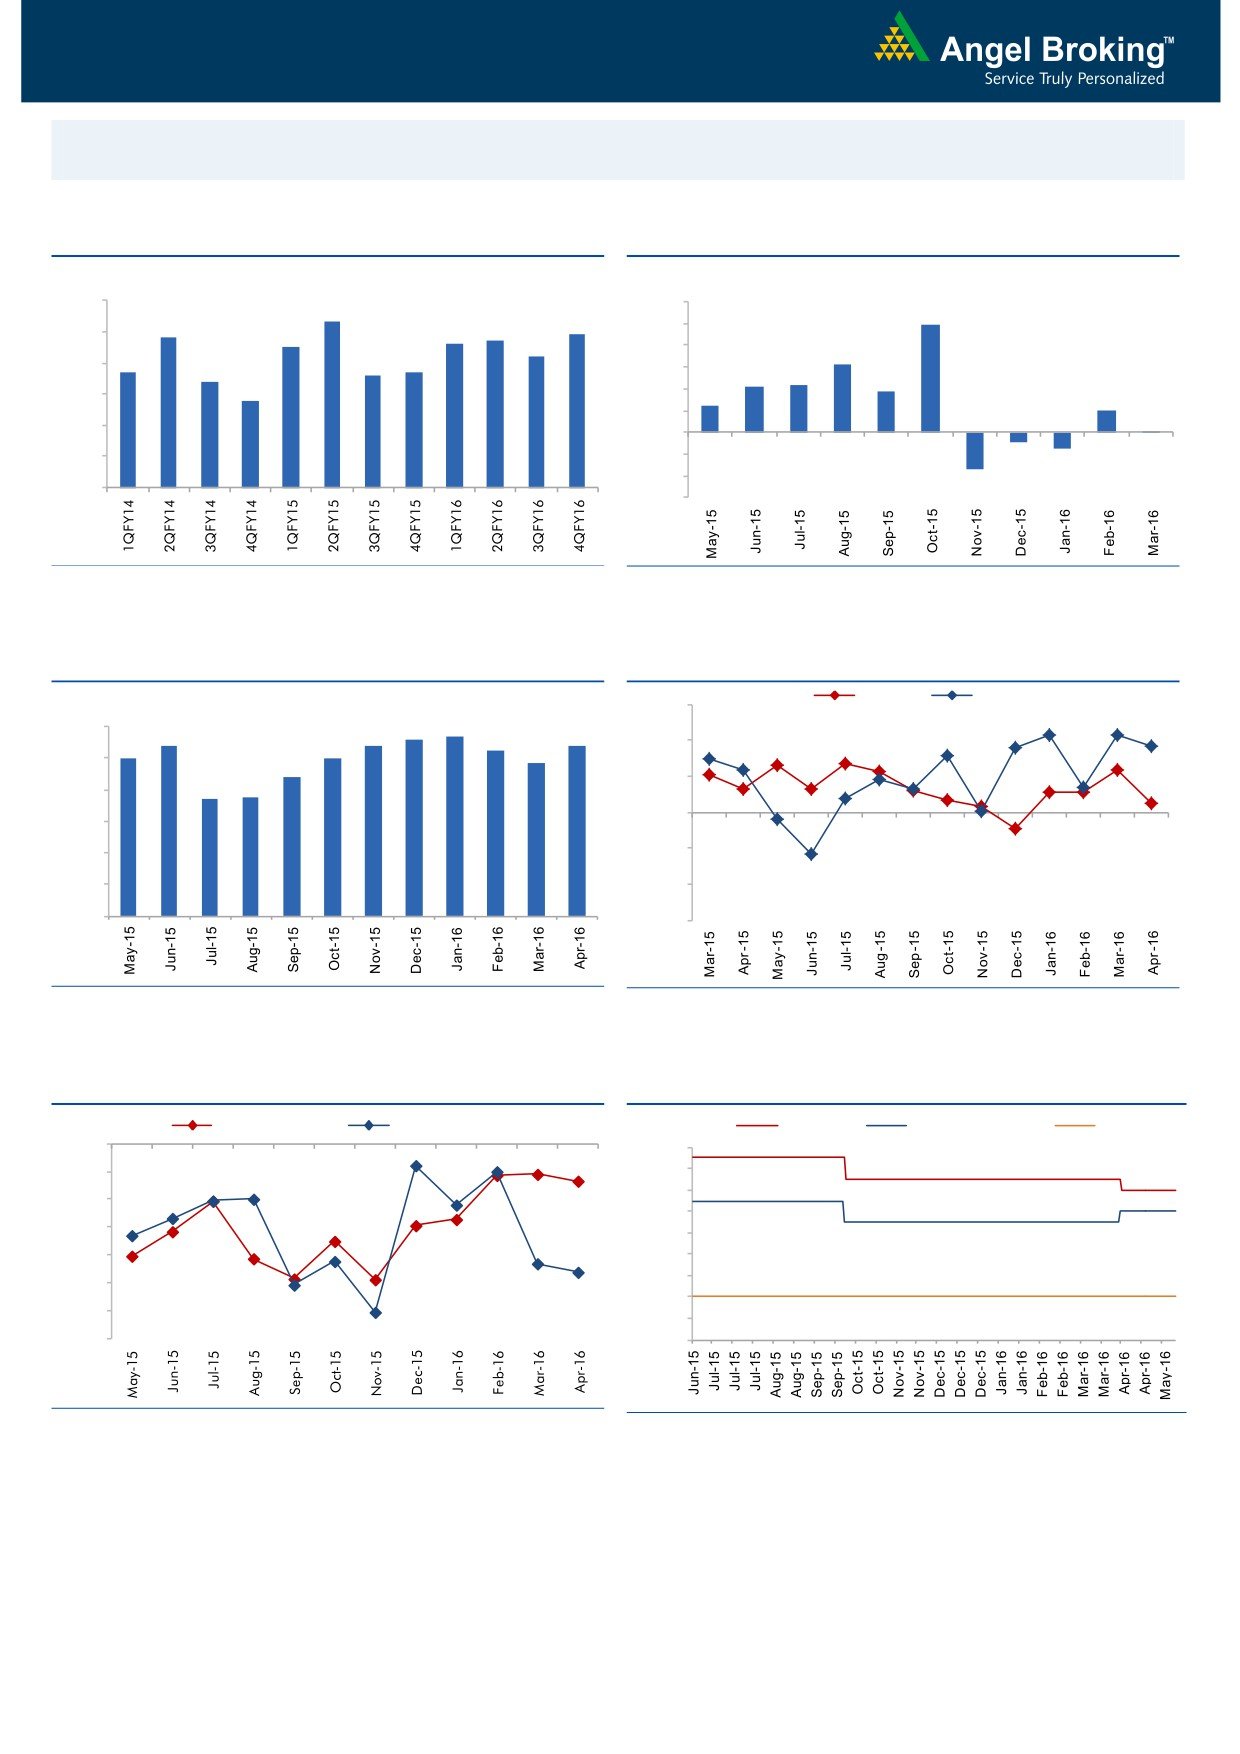
Macro watch
Exhibit 1: Quarterly GDP trends
Exhibit 2: IIP trends
(%)
(%)
9.0
12.0
8.3
9.9
7.8
7.7
7.9
10.0
8.0
7.5
7.6
7.2
8.0
6.3
6.7
6.6
6.7
7.0
6.4
6.0
4.2
4.3
3.7
5.8
4.0
2.5
6.0
2.0
2.0
0.1
5.0
-
4.0
(2.0)
(0.9)
(1.5)
(4.0)
3.0
(3.4)
(6.0)
Source: CSO, Angel Research
Source: MOSPI, Angel Research
Exhibit 3: Monthly CPI inflation trends
Exhibit 4: Manufacturing and services PMI
Mfg. PMI
Services PMI
(%)
56.0
5.6
5.7
6.0
5.4
5.4
5.4
5.3
5.0
5.0
54.0
4.8
5.0
4.4
52.0
3.7
3.7
4.0
50.0
3.0
48.0
2.0
1.0
46.0
-
44.0
Source: MOSPI, Angel Research
Source: Market, Angel Research; Note: Level above 50 indicates expansion
Exhibit 5: Exports and imports growth trends
Exhibit 6: Key policy rates
(%)
Exports yoy growth
Imports yoy growth
(%)
Repo rate
Reverse Repo rate
CRR
0.0
7.50
(5.0)
7.00
6.50
(10.0)
6.00
(15.0)
5.50
(20.0)
5.00
4.50
(25.0)
4.00
(30.0)
3.50
(35.0)
3.00
Source: Bloomberg, Angel Research
Source: RBI, Angel Research
Market Outlook
June 1, 2016
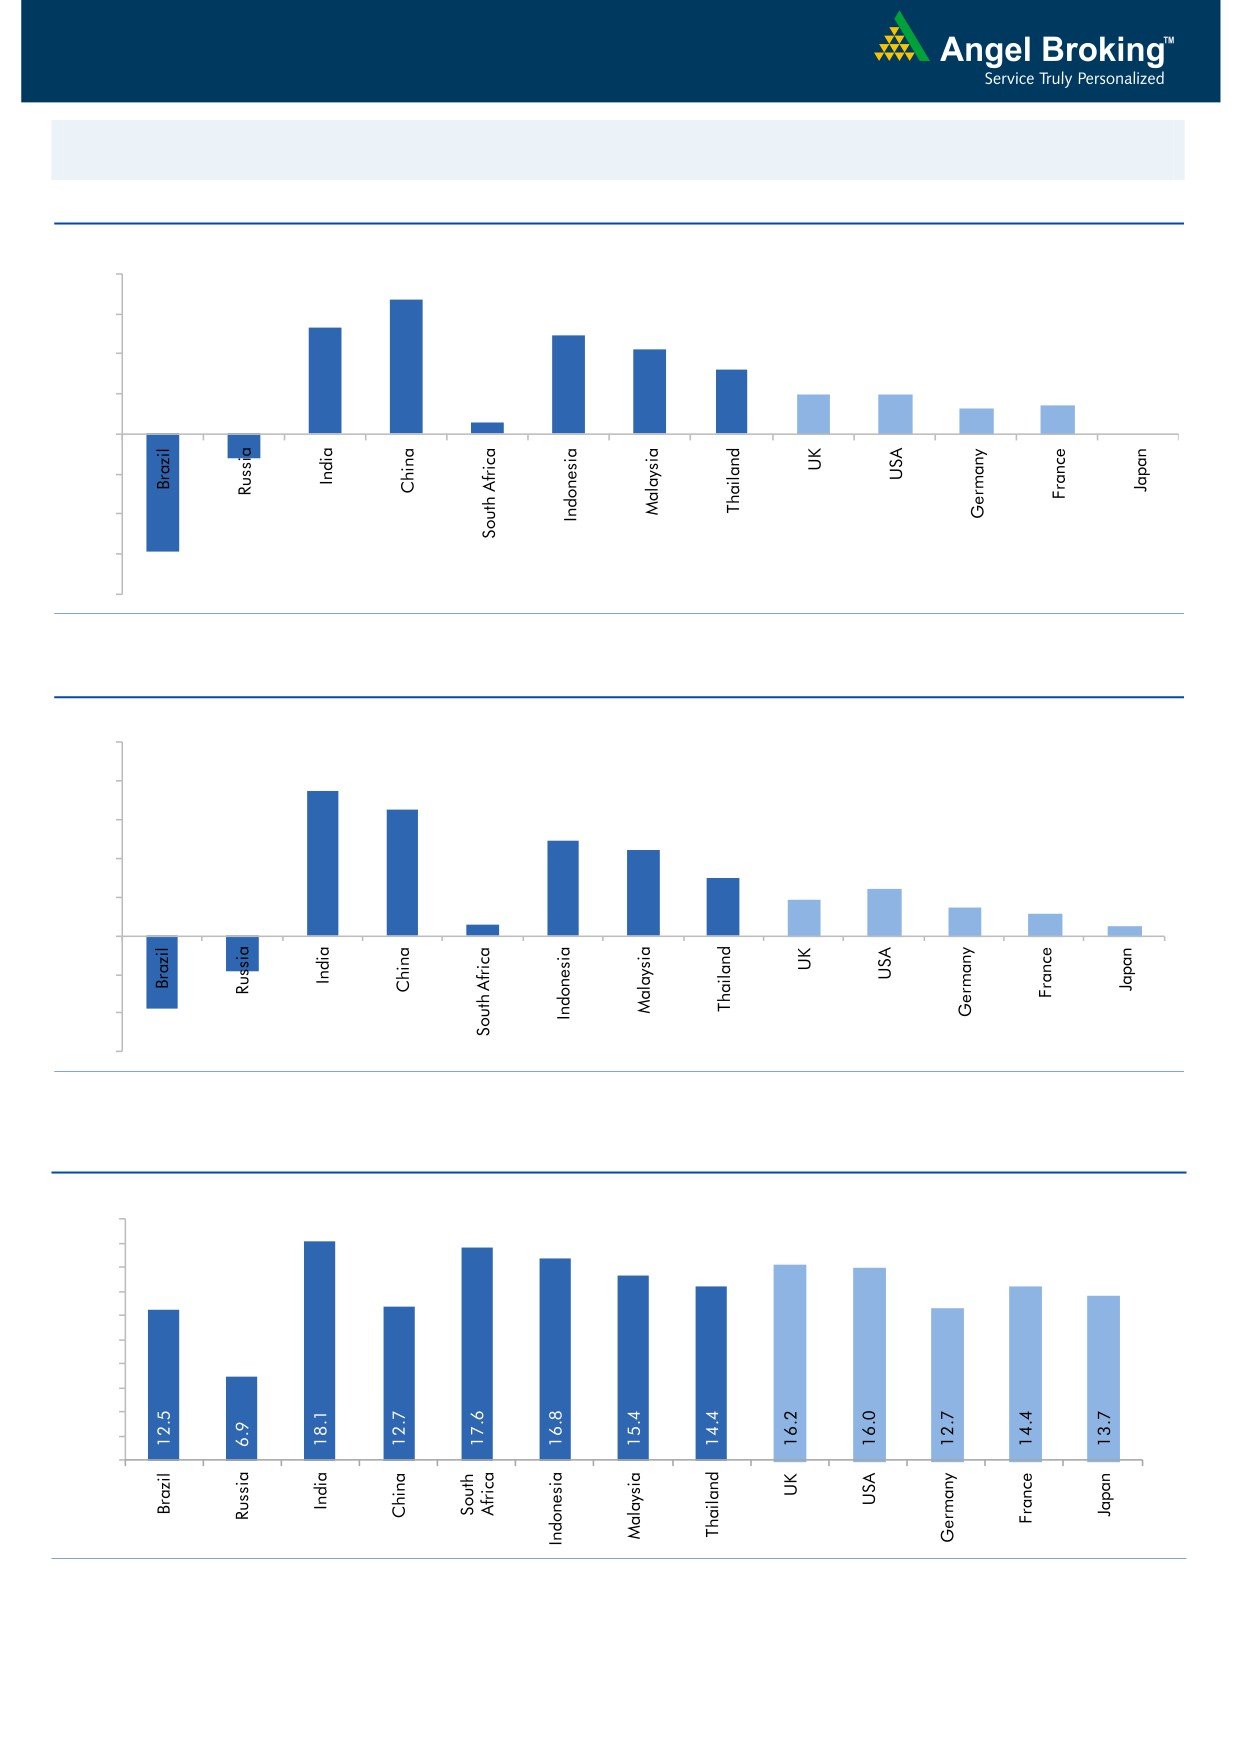
Global watch
Exhibit 1: Latest quarterly GDP Growth (%, yoy) across select developing and developed countries
(%)
8.0
6.7
6.0
5.3
4.9
4.2
4.0
3.2
2.0
2.0
1.3
1.4
2.0
0.6
-
-
(2.0)
(4.0)
(1.2)
(6.0)
(5.9)
(8.0)
Source: Bloomberg, Angel Research
Exhibit 2: 2016 GDP Growth projection by IMF (%, yoy) across select developing and developed countries
(%)
10.0
7.5
8.0
6.5
6.0
4.9
4.4
4.0
3.0
2.4
1.9
1.5
2.0
1.1
0.6
0.5
(3.8)
(1.8)
-
(2.0)
(4.0)
(6.0)
Source: IMF, Angel Research
Exhibit 3: One year forward P-E ratio across select developing and developed countries
(x)
20.0
18.0
16.0
14.0
12.0
10.0
8.0
6.0
4.0
2.0
-
Source: IMF, Angel Research
Market Outlook
June 1, 2016
Exhibit 4: Relative performance of indices across globe
Returns (%)
Country
Name of index
Closing price
1M
3M
1YR
Brazil
Bovespa
48,472
(10.8)
16.5
(10.9)
Russia
Micex
1,899
(2.4)
5.3
18.0
India
Nifty
8,160
4.0
14.8
(2.1)
China
Shanghai Composite
2,917
(1.0)
8.5
(37.4)
South Africa
Top 40
47,974
2.5
13.0
3.6
Mexico
Mexbol
45,459
(0.7)
4.6
1.2
Indonesia
LQ45
820
(1.8)
1.1
(11.1)
Malaysia
KLCI
1,626
(2.9)
(2.7)
(7.8)
Thailand
SET 50
911
1.7
10.8
(9.4)
USA
Dow Jones
17,787
(0.2)
7.7
(1.2)
UK
FTSE
6,231
(1.4)
3.6
(10.4)
Japan
Nikkei
17,235
(1.2)
8.3
(14.7)
Germany
DAX
10,263
(0.6)
7.9
(9.5)
France
CAC
4,506
1.7
3.5
(7.1)
Source: Bloomberg, Angel Research
Stock Watch
June 01, 2016
Company Name
Reco
CMP
Target
Mkt Cap
Sales ( Čcr )
OPM(%)
EPS (Č)
PER(x)
P/BV(x)
RoE(%)
EV/Sales(x)
(Č)
Price ( Č)
( Č cr )
FY16E FY17E
FY16E
FY17E
FY16E
FY17E
FY16E
FY17E
FY16E
FY17E
FY16E
FY17E
FY16E
FY17E
Agri / Agri Chemical
Rallis
Neutral
206
-
4,008
1,612
1,911
13.3
13.3
7.4
9.5
27.9
21.7
4.5
4.0
16.7
18.4
2.6
2.2
United Phosphorus
Buy
596
684
25,558
13,083
15,176
18.5
18.5
31.5
37.4
18.9
15.9
3.8
3.1
21.4
21.4
2.1
1.8
Auto & Auto Ancillary
Ashok Leyland
Neutral
109
-
30,992
17,995
21,544
11.4
11.6
3.4
4.7
32.0
23.2
5.6
5.2
17.7
22.2
1.6
1.3
Bajaj Auto
Neutral
2,619
-
75,782
22,709
25,860
20.9
20.1
129.0
143.6
20.3
18.2
6.2
5.4
30.7
29.4
2.9
2.5
Bharat Forge
Buy
756
875
17,607
7,351
8,318
19.9
19.7
31.2
36.5
24.2
20.7
4.3
3.7
19.3
19.2
2.5
2.2
Eicher Motors
Accumulate
18,486
20,044
50,210
15,556
16,747
15.5
17.3
464.8
597.5
39.8
30.9
14.5
10.7
36.2
34.3
3.2
2.9
Gabriel India
Accumulate
90
101
1,288
1,415
1,544
8.7
9.0
4.6
5.4
19.5
16.6
3.5
3.1
18.1
18.9
0.9
0.8
Hero Motocorp
Neutral
3,099
-
61,886
28,244
30,532
15.5
15.9
156.7
168.5
19.8
18.4
7.9
6.7
39.9
36.4
2.0
1.8
Jamna Auto Industries Accumulate
146
160
1,170
1,281
1,473
11.2
11.5
7.6
9.2
19.3
15.9
4.9
4.0
25.4
25.2
1.0
0.8
L G Balakrishnan & Bros Neutral
455
-
714
1,254
1,394
11.6
11.8
35.9
41.7
12.7
10.9
1.7
1.5
13.5
13.8
0.7
0.6
Mahindra and Mahindra Neutral
1,325
-
82,276
38,416
42,904
13.7
13.9
54.8
63.4
24.2
20.9
3.7
3.3
15.4
15.8
1.8
1.6
Maruti
Neutral
4,168
-
125,904
57,865
68,104
16.4
16.7
176.3
225.5
23.6
18.5
4.6
3.9
19.4
21.2
1.9
1.6
Minda Industries
Neutral
1,197
-
1,899
2,523
2,890
8.7
9.0
55.0
65.4
21.8
18.3
4.2
3.4
19.3
18.7
0.8
0.7
Motherson Sumi
Accumulate
285
313
37,692
39,343
45,100
8.8
9.1
10.1
12.5
28.2
22.8
8.9
7.0
35.3
34.4
1.0
0.9
Rane Brake Lining
Buy
375
465
297
454
511
11.5
12.0
25.2
31.0
14.9
12.1
2.2
2.0
14.9
16.6
0.8
0.7
Setco Automotive
Neutral
31
-
417
594
741
12.7
13.7
1.7
3.2
18.4
9.8
1.9
1.7
10.4
16.9
1.1
0.9
Tata Motors
Neutral
458
-
132,292
259,686
273,957
13.0
13.4
25.9
29.5
17.7
15.5
2.3
2.0
8.0
9.0
0.6
0.6
TVS Motor
Accumulate
286
330
13,576
11,263
13,122
6.9
8.5
9.2
15.0
31.1
19.1
7.1
5.6
22.7
29.6
1.2
1.0
Amara Raja Batteries
Buy
841
1,076
14,361
4,892
5,871
17.4
17.6
28.8
37.1
29.2
22.7
6.8
5.5
23.4
24.1
2.9
2.4
Exide Industries
Neutral
164
-
13,906
6,950
7,784
14.4
14.8
6.6
7.3
24.8
22.4
3.1
2.9
12.6
12.8
1.7
1.5
Apollo Tyres
Buy
156
183
7,954
12,056
12,714
17.2
16.4
23.0
20.3
6.8
7.7
1.2
1.0
17.7
13.6
0.7
0.7
Ceat
Buy
925
1,119
3,741
6,041
6,597
14.1
13.7
99.5
111.9
9.3
8.3
1.8
1.5
19.6
18.5
0.8
0.7
JK Tyres
Neutral
86
-
1,947
7,446
7,669
15.2
14.0
19.6
18.4
4.4
4.7
1.1
0.9
25.2
19.5
0.7
0.6
Swaraj Engines
Neutral
1,111
-
1,380
552
630
14.2
14.7
44.6
54.1
24.9
20.5
5.8
5.3
23.2
25.6
2.4
2.0
Subros
Neutral
90
-
540
1,293
1,527
11.8
11.9
4.2
6.7
21.4
13.4
1.6
1.5
7.7
11.5
0.7
0.6
Indag Rubber
Neutral
187
-
491
283
329
17.0
17.2
13.0
15.4
14.5
12.1
3.2
2.6
21.8
21.6
1.5
1.2
Capital Goods
ACE
Neutral
40
-
396
660
839
4.7
8.2
1.0
3.9
40.0
10.3
1.3
1.1
3.2
11.3
0.8
0.6
BEML
Buy
869
1,157
3,621
3,277
4,006
6.0
8.9
36.2
64.3
24.0
13.5
1.7
1.5
5.7
11.7
1.2
0.9
Bharat Electronics
Buy
1,178
1,414
28,278
7,737
8,634
16.8
17.2
54.0
61.5
21.8
19.2
3.1
2.8
39.3
45.6
2.8
2.4
Stock Watch
June 01, 2016
Company Name
Reco
CMP
Target
Mkt Cap
Sales ( Čcr )
OPM(%)
EPS (Č)
PER(x)
P/BV(x)
RoE(%)
EV/Sales(x)
(Č)
Price ( Č)
( Č cr )
FY16E
FY17E
FY16E
FY17E
FY16E
FY17E
FY16E
FY17E
FY16E
FY17E
FY16E
FY17E
FY16E
FY17E
Capital Goods
Voltas
Buy
336
407
11,114
5,363
5,963
8.0
9.1
11.0
13.8
30.5
24.3
4.7
4.1
16.2
17.9
2.0
1.8
BGR Energy
Neutral
113
-
818
3,615
3,181
9.5
9.4
16.7
12.4
6.8
9.1
0.6
0.6
10.0
7.0
0.6
0.8
BHEL
Neutral
121
-
29,543
33,722
35,272
10.8
11.7
10.5
14.2
11.5
8.5
0.9
0.8
7.0
9.0
1.0
0.9
Blue Star
Accumulate
416
481
3,742
3,548
3,977
6.3
6.9
13.7
17.2
30.4
24.3
7.6
5.0
26.1
25.4
1.2
1.0
Crompton Greaves
Neutral
66
-
4,155
13,484
14,687
4.9
6.2
4.5
7.1
14.7
9.3
1.0
1.0
7.2
10.8
0.4
0.4
Greaves Cotton
Neutral
136
-
3,314
1,655
1,755
16.6
16.8
7.4
7.8
18.3
17.4
3.7
3.5
21.1
20.6
2.0
1.9
Inox Wind
Buy
219
286
4,852
4,406
5,605
15.5
15.7
20.4
24.8
10.7
8.8
2.5
1.8
27.9
25.9
1.3
1.0
KEC International
Neutral
138
-
3,557
8,791
9,716
6.1
6.8
5.4
8.2
25.6
16.9
2.6
2.3
10.0
14.0
0.6
0.6
Thermax
Neutral
733
-
8,735
6,413
7,525
7.4
8.5
30.5
39.3
24.0
18.7
3.7
3.2
15.0
17.0
1.4
1.1
VATech Wabag
Neutral
578
-
3,148
2,722
3,336
7.9
8.1
19.5
24.6
29.6
23.5
3.1
2.8
11.1
12.4
1.3
1.0
Cement
ACC
Neutral
1,532
-
28,759
13,151
14,757
16.4
18.3
63.9
83.4
24.0
18.4
3.1
2.8
13.3
16.1
2.0
1.7
Ambuja Cements
Neutral
229
-
35,492
11,564
12,556
19.4
20.7
8.9
10.1
25.7
22.6
3.2
3.1
12.8
13.8
2.7
2.5
HeidelbergCement
Neutral
102
-
2,309
1,772
1,926
13.3
15.4
1.0
3.0
101.9
34.0
2.6
2.4
2.6
7.9
1.8
1.6
India Cements
Neutral
94
-
2,895
4,216
4,840
18.0
19.5
4.0
9.9
23.6
9.5
0.9
0.9
4.0
9.5
1.0
0.8
JK Cement
Neutral
580
-
4,054
3,661
4,742
10.1
15.8
7.5
28.5
77.3
20.3
2.3
2.1
7.5
22.9
1.6
1.2
J K Lakshmi Cement
Neutral
340
-
3,995
2,947
3,616
16.7
19.9
11.5
27.2
29.5
12.5
2.8
2.4
9.8
20.8
1.8
1.4
Mangalam Cements
Neutral
253
-
674
1,053
1,347
10.5
13.3
8.4
26.0
30.1
9.7
1.3
1.2
4.3
12.5
1.0
0.8
Orient Cement
Neutral
161
-
3,292
1,854
2,524
21.2
22.2
7.7
11.1
20.9
14.5
3.0
2.6
13.3
15.7
2.5
1.8
Ramco Cements
Neutral
492
-
11,716
4,036
4,545
20.8
21.3
15.1
18.8
32.6
26.2
4.0
3.5
12.9
14.3
3.5
3.0
Shree Cement^
Neutral
13,200
-
45,984
7,150
8,742
26.7
28.6
228.0
345.5
57.9
38.2
8.5
7.2
15.7
20.3
6.3
5.1
UltraTech Cement
Neutral
3,229
-
88,624
24,669
29,265
18.2
20.6
82.0
120.0
39.4
26.9
4.2
3.7
11.3
14.7
3.6
3.1
Construction
ITNL
Buy
69
93
2,270
7,360
8,825
34.0
35.9
7.0
9.0
9.9
7.7
0.3
0.3
3.2
3.7
3.7
3.6
KNR Constructions
Accumulate
554
603
1,559
937
1,470
14.3
14.0
44.2
38.6
12.5
14.4
2.5
2.2
15.4
15.4
1.7
1.1
Larsen & Toubro
Neutral
1,474
-
137,380
58,870
65,708
8.3
10.3
42.0
53.0
35.1
27.8
2.4
2.2
8.8
11.2
2.6
2.3
Gujarat Pipavav Port
Neutral
160
-
7,745
629
684
51.0
52.2
6.4
5.9
25.0
27.2
3.3
3.0
15.9
12.7
12.1
10.9
MBL Infrastructures
Buy
125
285
520
2,313
2,797
12.2
14.6
19.0
20.0
6.6
6.3
0.7
0.6
11.3
10.6
0.9
0.8
Nagarjuna Const.
Neutral
74
-
4,097
7,892
8,842
8.8
9.1
3.0
5.3
24.6
13.9
1.2
1.1
5.0
8.5
0.8
0.6
PNC Infratech
Neutral
565
-
2,898
1,873
2,288
13.2
13.5
24.0
32.0
23.5
17.7
2.3
2.0
12.1
12.3
1.7
1.4
Simplex Infra
Neutral
274
-
1,353
5,955
6,829
10.3
10.5
16.0
31.0
17.1
8.8
0.9
0.8
5.3
9.9
0.7
0.6
Stock Watch
June 01, 2016
Company Name
Reco
CMP
Target
Mkt Cap
Sales ( Čcr )
OPM(%)
EPS (Č)
PER(x)
P/BV(x)
RoE(%)
EV/Sales(x)
(Č)
Price ( Č)
( Č cr )
FY16E
FY17E
FY16E
FY17E
FY16E
FY17E
FY16E
FY17E
FY16E
FY17E
FY16E
FY17E
FY16E
FY17E
Construction
Power Mech Projects
Neutral
590
-
868
1,539
1,801
12.8
12.7
59.0
72.1
10.0
8.2
1.5
1.3
18.6
16.8
0.6
0.5
Sadbhav Engineering
Accumulate
276
298
4,726
3,186
3,598
10.2
10.3
8.0
9.0
34.4
30.6
3.2
2.8
9.4
9.9
1.8
1.6
NBCC
Buy
948
1,098
11,375
5,816
7,382
6.9
7.7
29.6
39.8
32.0
23.8
5.8
4.5
24.1
26.7
1.7
1.3
MEP Infra
Neutral
40
-
649
1,956
1,876
28.1
30.5
1.3
3.0
30.7
13.3
6.4
4.3
21.2
32.8
1.8
1.7
SIPL
Neutral
97
-
3,420
675
1,042
62.4
64.7
-
-
3.6
4.2
-
-
16.8
11.3
Engineers India
Neutral
179
-
6,043
1,667
1,725
13.5
16.0
9.7
11.4
18.5
15.7
2.2
2.1
11.7
13.4
2.5
2.5
Financials
Allahabad Bank
Neutral
53
-
3,265
8,569
9,392
2.8
2.9
16.3
27.5
3.3
1.9
0.3
0.2
7.6
11.9
-
-
Axis Bank
Neutral
516
-
122,957
26,204
29,738
3.6
3.5
34.5
35.4
14.9
14.6
2.4
2.1
16.8
14.9
-
-
Bank of Baroda
Neutral
143
-
32,880
18,802
21,088
2.0
2.2
(7.4)
13.0
11.0
1.1
0.9
(4.2)
7.3
-
-
Bank of India
Neutral
87
-
8,079
15,972
17,271
1.9
2.0
15.3
33.4
5.7
2.6
0.3
0.2
3.6
7.6
-
-
Canara Bank
Neutral
206
-
11,161
15,441
16,945
2.0
2.1
46.6
70.4
4.4
2.9
0.4
0.3
8.0
11.2
-
-
Dena Bank
Neutral
29
-
1,921
3,440
3,840
2.1
2.3
7.3
10.0
4.0
2.9
0.3
0.2
6.1
7.9
-
-
Dewan Housing Finance Buy
199
270
5,792
1,828
2,225
2.9
3.0
24.9
29.7
8.0
6.7
1.2
1.1
15.1
16.1
-
-
Federal Bank
Neutral
52
-
8,994
3,279
3,787
2.8
2.9
3.9
5.5
13.3
9.5
1.1
1.0
8.4
10.8
-
-
HDFC
Neutral
1,239
-
195,726
10,358
11,852
3.3
3.3
41.1
47.0
30.2
26.3
5.7
5.2
24.7
24.9
-
-
HDFC Bank
Accumulate
1,181
1,262
298,791
38,606
47,696
4.4
4.5
48.8
61.4
24.2
19.3
4.1
3.6
18.7
20.0
-
-
ICICI Bank
Neutral
245
-
142,597
34,279
39,262
3.3
3.3
21.0
24.4
11.7
10.1
2.0
1.7
14.4
14.7
-
-
IDBI Bank
Neutral
68
-
13,990
9,625
10,455
1.8
1.8
8.5
14.2
8.0
4.8
0.5
0.5
5.9
9.3
-
-
Indian Bank
Neutral
91
-
4,390
6,160
6,858
2.5
2.5
24.5
29.8
3.7
3.1
0.3
0.3
7.7
8.6
-
-
LIC Housing Finance
Buy
469
592
23,691
3,179
3,758
2.6
2.6
32.9
40.6
14.3
11.6
2.6
2.2
19.6
20.7
-
-
Oriental Bank
Neutral
85
-
2,932
7,643
8,373
2.4
2.4
37.2
45.4
2.3
1.9
0.2
0.2
8.2
9.4
-
-
Punjab Natl.Bank
Neutral
79
-
15,532
23,122
26,022
2.8
2.8
7.0
21.6
11.3
3.7
0.6
0.5
3.4
10.0
-
-
South Ind.Bank
Neutral
19
-
2,572
1,965
2,185
2.5
2.5
2.5
3.3
7.7
5.8
0.8
0.7
9.5
11.7
-
-
St Bk of India
Neutral
205
-
159,020
79,958
86,061
2.6
2.6
13.4
20.7
15.3
9.9
1.3
1.2
11.5
12.8
-
-
Union Bank
Neutral
118
-
8,115
12,646
14,129
2.3
2.4
31.0
39.1
3.8
3.0
0.4
0.4
9.8
11.4
-
-
Vijaya Bank
Neutral
31
-
2,849
3,536
3,827
1.9
1.9
5.5
6.7
5.5
4.6
0.5
0.4
7.8
8.8
-
-
Yes Bank
Neutral
1,032
-
43,427
7,190
9,011
3.2
3.3
58.2
69.7
17.7
14.8
3.2
2.7
19.2
19.6
-
-
FMCG
Asian Paints
Neutral
984
-
94,395
16,553
19,160
16.0
16.2
17.7
21.5
55.7
45.8
14.8
13.3
29.4
31.2
5.5
4.8
Britannia
Neutral
2,706
-
32,465
8,481
9,795
14.0
14.1
65.5
78.3
41.3
34.6
19.6
16.0
38.3
41.2
3.8
3.3
Stock Watch
June 01, 2016
Company Name
Reco
CMP
Target
Mkt Cap
Sales ( Čcr )
OPM(%)
EPS (Č)
PER(x)
P/BV(x)
RoE(%)
EV/Sales(x)
(Č)
Price ( Č)
( Č cr )
FY16E FY17E
FY16E
FY17E
FY16E
FY17E
FY16E
FY17E
FY16E
FY17E
FY16E
FY17E
FY16E
FY17E
FMCG
Colgate
Neutral
859
-
23,355
4,136
4,632
22.5
23.3
22.2
25.3
38.7
33.9
23.5
20.9
68.6
67.5
5.5
4.9
Dabur India
Neutral
290
-
51,015
9,370
10,265
17.6
17.3
7.3
8.1
39.5
35.8
10.3
9.4
31.7
30.6
5.4
4.9
GlaxoSmith Con*
Neutral
5,741
-
24,145
4,519
5,142
19.6
19.8
164.3
191.2
35.0
30.0
9.7
8.2
30.8
29.9
5.0
4.3
Godrej Consumer
Neutral
1,487
-
50,624
9,003
10,335
18.1
18.7
34.1
41.8
43.6
35.6
9.4
8.1
23.9
24.8
5.9
5.2
HUL
Neutral
850
-
183,913
33,299
35,497
17.1
17.1
18.9
20.0
45.0
42.5
22.8
26.2
87.6
80.8
5.4
5.0
ITC
Neutral
352
-
282,940
36,804
38,776
37.9
37.9
12.2
12.9
28.8
27.3
8.0
7.1
27.7
25.8
7.4
7.0
Marico
Neutral
249
-
32,145
6,151
6,966
17.2
17.3
5.4
6.4
46.1
38.9
14.5
11.4
33.2
32.4
5.2
4.6
Nestle*
Neutral
6,099
-
58,803
9,393
10,507
22.2
22.3
106.8
121.8
57.1
50.1
20.1
18.0
34.8
36.7
6.3
5.6
Tata Global
Buy
118
137
7,432
8,635
9,072
9.8
9.9
5.8
7.2
20.3
16.4
1.8
1.7
6.8
7.4
0.9
0.8
Procter & Gamble
Buy
6,195
7,369
20,109
2,588
2,939
23.3
23.2
130.2
146.2
47.6
42.4
94.9
91.0
27.6
25.3
7.3
6.4
Hygiene
IT
HCL Tech^
Buy
740
1,000
104,367
37,061
30,781
21.5
20.5
51.4
40.0
14.4
18.5
3.7
2.7
20.1
20.3
2.6
2.8
Infosys
Accumulate
1,250
1,374
287,084
62,441
70,558
27.5
27.5
59.0
65.3
21.2
19.1
4.3
3.9
22.2
22.4
4.1
3.5
TCS
Accumulate
2,575
3,004
507,405
108,646
122,770
28.3
28.3
123.7
141.0
20.8
18.3
6.9
6.3
33.1
34.6
4.3
3.7
Tech Mahindra
Neutral
538
-
52,241
26,524
29,177
16.2
17.0
28.8
33.6
18.7
16.0
3.6
3.1
19.3
19.1
1.8
1.5
Wipro
Buy
546
680
134,950
50,808
56,189
23.7
23.8
37.3
40.7
14.6
13.4
2.8
2.6
19.2
17.7
2.1
1.8
Media
D B Corp
Neutral
374
-
6,876
2,025
2,187
27.4
27.4
17.4
18.9
21.5
19.8
4.9
4.4
22.9
23.7
3.3
3.0
HT Media
Neutral
81
-
1,878
2,495
2,673
12.9
13.2
6.8
7.2
11.9
11.2
0.9
0.9
7.5
7.8
0.3
0.3
Jagran Prakashan
Buy
169
205
5,522
2,170
2,355
27.2
26.2
8.9
9.9
19.0
17.1
4.0
3.5
20.9
20.5
2.5
2.3
Sun TV Network
Neutral
374
-
14,751
2,510
2,763
71.8
71.5
21.9
24.8
17.1
15.1
4.1
3.7
22.8
24.3
5.4
4.9
Hindustan Media
Neutral
263
-
1,931
914
1,016
21.7
21.5
21.9
23.3
12.0
11.3
2.2
1.8
18.0
16.2
1.6
1.3
Ventures
Metals & Mining
Coal India
Buy
292
380
184,217
76,167
84,130
19.9
22.3
22.4
25.8
13.0
11.3
4.7
4.6
35.5
41.0
1.8
1.6
Hind. Zinc
Neutral
171
-
72,190
14,641
14,026
50.4
50.4
17.7
16.0
9.7
10.7
1.5
1.4
16.2
13.2
2.6
2.4
Hindalco
Neutral
105
-
21,713
104,356
111,186
8.7
9.5
6.7
11.1
15.7
9.5
0.6
0.5
3.5
5.9
0.7
0.7
JSW Steel
Neutral
1,391
-
33,628
42,308
45,147
16.4
20.7
(10.3)
49.5
28.1
1.6
1.5
(1.0)
5.6
1.8
1.7
NMDC
Neutral
88
-
35,008
8,237
10,893
46.6
44.5
10.0
11.7
8.9
7.6
1.0
0.9
12.5
13.0
4.1
3.1
SAIL
Neutral
43
-
17,635
45,915
53,954
7.2
10.5
1.5
4.4
28.4
9.8
0.4
0.4
2.3
4.1
1.0
0.9
Vedanta
Neutral
109
-
32,182
71,445
81,910
26.2
26.3
12.9
19.2
8.4
5.7
0.6
0.5
7.2
8.9
0.9
0.7
Tata Steel
Neutral
334
-
32,482
126,760
137,307
8.9
11.3
6.4
23.1
52.6
14.5
1.1
1.0
2.0
7.1
0.8
0.8
Oil & Gas
Cairn India
Neutral
145
-
27,223
11,323
12,490
49.4
51.0
20.7
20.7
7.0
7.0
0.5
0.4
6.4
6.1
1.5
0.8
Stock Watch
June 01, 2016
Company Name
Reco
CMP
Target
Mkt Cap
Sales ( Čcr )
OPM(%)
EPS (Č)
PER(x)
P/BV(x)
RoE(%)
EV/Sales(x)
(Č)
Price ( Č)
( Č cr )
FY16E FY17E
FY16E
FY17E
FY16E
FY17E
FY16E
FY17E
FY16E
FY17E
FY16E
FY17E
FY16E
FY17E
Oil & Gas
GAIL
Neutral
371
-
47,041
64,856
70,933
9.1
9.6
24.0
28.9
15.5
12.8
1.3
1.2
8.8
9.6
0.9
0.8
ONGC
Neutral
211
-
180,649
154,564
145,998
36.8
37.4
20.8
22.6
10.2
9.3
1.0
0.9
10.1
9.7
1.4
1.5
Petronet LNG
Neutral
274
-
20,565
29,691
31,188
5.8
6.2
12.8
13.4
21.5
20.4
3.2
2.9
15.8
14.8
0.8
0.7
Indian Oil Corp
Accumulate
416
455
101,027
359,607
402,760
5.9
6.1
42.5
48.7
9.8
8.5
1.3
1.2
14.1
14.4
0.4
0.3
Reliance Industries
Buy
959
1,150
310,823
304,775
344,392
12.6
13.4
91.3
102.6
10.5
9.4
1.2
1.1
11.8
12.0
1.0
0.8
Pharmaceuticals
Alembic Pharma
Neutral
535
-
10,087
3,274
3,802
26.9
19.4
35.0
28.7
15.3
18.6
6.8
5.1
55.6
31.2
3.0
2.5
Aurobindo Pharma
Accumulate
786
856
45,968
14,923
17,162
22.0
23.0
35.7
42.8
22.0
18.4
6.5
4.9
34.0
30.2
3.3
2.8
Aventis*
Accumulate
4,192
4,738
9,655
2,049
2,375
15.4
17.3
115.4
153.5
36.3
27.3
5.9
4.6
19.3
25.8
4.5
3.8
Cadila Healthcare
Buy
336
400
34,413
9,469
11,246
21.2
22.0
14.9
17.1
22.6
19.7
6.4
5.1
28.8
26.6
3.6
3.0
Cipla
Buy
472
605
37,952
13,979
16,447
20.2
18.6
25.7
27.5
18.4
17.2
3.0
2.6
17.6
16.1
2.7
2.2
Dr Reddy's
Accumulate
3,184
3,476
54,307
15,471
17,479
24.6
24.6
138.2
152.4
23.0
20.9
4.2
3.6
19.7
18.7
3.5
3.1
Dishman Pharma
Neutral
152
-
2,447
1,733
1,906
21.5
21.5
10.1
10.0
15.0
15.2
1.8
1.6
10.5
11.2
1.9
1.7
GSK Pharma*
Neutral
3,547
-
30,046
2,870
3,158
20.0
22.1
59.5
68.3
59.6
51.9
17.6
18.1
28.5
34.3
10.1
9.2
Indoco Remedies
Neutral
278
-
2,565
1,033
1,199
15.9
18.2
9.4
13.6
29.6
20.5
4.4
3.7
15.7
19.7
2.7
2.3
Ipca labs
Buy
431
750
5,435
3,363
3,909
12.9
18.6
13.4
28.0
32.2
15.4
2.3
2.0
7.4
14.0
1.9
1.7
Lupin
Buy
1,474
1,809
66,451
13,702
15,912
23.7
26.4
50.5
58.1
29.2
25.4
6.0
4.9
22.9
21.4
5.3
4.2
Sun Pharma
Buy
763
950
183,559
28,163
32,610
25.8
30.7
17.4
26.9
43.8
28.4
4.2
3.6
13.0
16.6
6.4
5.3
Power
Tata Power
Neutral
74
-
19,947
35,923
37,402
22.6
22.8
4.1
5.2
18.2
14.3
1.4
1.3
7.5
9.3
1.5
1.4
NTPC
Neutral
143
-
118,116
87,271
99,297
23.5
23.5
11.8
13.3
12.2
10.8
1.4
1.3
11.5
12.2
2.4
2.1
Power Grid
Accumulate
150
170
78,474
20,702
23,361
86.7
86.4
12.1
13.2
12.4
11.4
1.8
1.6
15.6
15.1
8.8
8.1
Real Estate
MLIFE
Buy
445
554
1,824
826
1,133
20.1
21.8
22.6
30.7
19.7
14.5
1.2
1.1
6.0
7.4
4.1
2.7
Telecom
Bharti Airtel
Neutral
352
-
140,569
101,748
109,191
32.1
31.7
12.0
12.5
29.3
28.1
2.0
1.9
6.9
6.7
2.0
1.8
Idea Cellular
Neutral
115
-
41,298
34,282
36,941
32.0
31.5
5.9
6.2
19.4
18.5
1.8
1.6
9.9
9.3
1.8
1.7
zOthers
Abbott India
Neutral
4,702
-
9,991
2,715
3,153
14.5
14.1
134.3
152.2
35.0
30.9
8.7
7.2
27.4
25.6
3.4
2.9
Bajaj Electricals
Neutral
235
-
2,375
4,719
5,287
5.2
5.8
8.6
12.7
27.5
18.6
3.1
2.8
11.4
14.8
0.5
0.5
Finolex Cables
Neutral
353
-
5,400
2,520
2,883
12.2
12.0
12.7
14.2
27.9
24.9
3.8
3.4
13.6
13.5
1.8
1.6
Goodyear India*
Accumulate
506
582
1,167
1,800
1,600
11.7
11.5
58.7
52.9
8.6
9.6
1.9
1.7
24.6
18.7
0.4
0.4
Hitachi
Neutral
1,294
-
3,518
1,779
2,081
7.8
8.8
21.8
33.4
59.4
38.7
9.6
7.8
17.4
22.1
2.2
1.9
Jyothy Laboratories
Neutral
282
-
5,112
1,620
1,847
11.5
11.5
7.3
8.5
38.7
33.3
5.0
4.6
13.3
14.4
3.0
2.6
Stock Watch
June 01, 2016
Company Name
Reco
CMP
Target
Mkt Cap
Sales ( Čcr )
OPM(%)
EPS (Č)
PER(x)
P/BV(x)
RoE(%)
EV/Sales(x)
(Č)
Price ( Č)
( Č cr )
FY16E
FY17E
FY16E
FY17E
FY16E
FY17E
FY16E
FY17E
FY16E
FY17E
FY16E
FY17E
FY16E
FY17E
zOthers
MRF
Buy
33,806
45,575
14,338
20,316
14,488
21.4
21.1
5,488.0
3,798.0
6.2
8.9
2.1
1.7
41.1
21.2
0.6
0.9
Page Industries
Neutral
13,808
-
15,401
1,929
2,450
19.8
20.1
229.9
299.0
60.1
46.2
26.5
18.4
52.1
47.1
8.1
6.4
Relaxo Footwears
Neutral
447
-
5,362
1,767
2,152
12.3
12.5
19.3
25.1
23.2
17.8
5.7
4.4
27.7
27.8
3.1
2.5
Siyaram Silk Mills
Buy
1,022
1,354
958
1,636
1,815
11.5
11.5
89.9
104.1
11.4
9.8
1.9
1.6
17.9
17.8
0.7
0.7
Styrolution ABS India* Neutral
594
-
1,044
1,271
1,440
8.6
9.2
32.0
41.1
18.5
14.5
1.9
1.7
10.7
12.4
0.8
0.7
TVS Srichakra
Buy
2,345
2,932
1,796
2,035
2,252
15.9
15.3
248.6
268.1
9.4
8.8
4.1
3.0
43.6
33.9
0.9
0.8
HSIL
Accumulate
280
310
2,027
2,123
2,384
16.1
16.5
15.0
18.9
18.6
14.9
1.5
1.3
8.0
9.4
1.3
1.2
Kirloskar Engines India
Neutral
245
-
3,541
2,403
2,554
8.6
9.9
9.2
10.5
26.7
23.3
2.6
2.4
9.7
10.7
1.1
1.0
Ltd
M M Forgings
Buy
449
546
542
511
615
21.7
21.6
43.1
55.8
10.4
8.0
1.9
1.6
19.9
21.2
1.3
1.0
Banco Products (India) Neutral
131
-
938
1,208
1,353
11.0
12.3
10.8
14.5
12.2
9.1
1.4
1.2
11.9
14.5
0.8
0.7
Competent Automobiles Neutral
143
-
88
1,040
1,137
3.2
3.1
25.7
28.0
5.6
5.1
0.8
0.7
15.0
14.3
0.1
0.1
Nilkamal
Neutral
1,217
-
1,816
1,871
2,031
10.7
10.5
63.2
69.8
19.3
17.5
3.1
2.7
17.6
16.6
1.0
0.9
Visaka Industries
Accumulate
139
162
221
1,020
1,120
8.7
9.1
13.9
20.1
10.0
6.9
0.6
0.6
6.4
8.7
0.5
0.4
Transport Corporation of
Neutral
282
-
2,146
2,830
3,350
8.8
9.0
14.4
18.3
19.6
15.4
3.0
2.6
15.4
17.1
0.9
0.8
India
Elecon Engineering
Neutral
58
-
632
1,359
1,482
10.3
13.7
0.8
3.9
72.2
14.9
1.2
1.1
1.6
7.8
0.8
0.7
Surya Roshni
Buy
150
201
659
2,992
3,223
8.1
8.4
14.7
18.3
10.2
8.2
1.0
0.9
9.7
11.0
0.5
0.5
MT Educare
Neutral
185
-
735
286
366
18.3
17.7
7.7
9.4
23.9
19.7
5.0
4.4
20.2
21.1
2.4
1.8
Radico Khaitan
Buy
86
125
1,137
1,543
1,659
12.6
13.0
5.8
6.3
14.8
13.5
1.3
1.2
8.5
8.6
1.2
1.1
Garware Wall Ropes
Buy
364
473
797
862
974
11.2
11.2
24.9
29.6
14.6
12.3
2.2
1.9
15.1
15.4
0.9
0.8
Wonderla Holidays
Neutral
378
-
2,134
206
308
44.0
43.6
9.0
12.9
42.0
29.3
5.7
5.2
13.7
17.8
10.4
6.9
Linc Pen & Plastics
Neutral
201
-
297
340
371
8.3
8.9
10.8
13.2
18.6
15.2
3.0
2.6
16.0
17.1
0.9
0.8
The Byke Hospitality
Neutral
172
-
690
222
287
20.5
20.5
5.6
7.6
30.5
22.8
5.8
4.7
18.9
20.8
3.2
2.4
Interglobe Aviation
Neutral
1,064
-
38,353
17,022
21,122
20.7
14.5
63.9
53.7
16.7
19.8
25.0
20.5
149.9
103.2
2.3
1.8
Coffee Day Enterprises
Neutral
268
-
5,519
2,692
2,964
17.0
18.6
-
4.7
-
56.5
3.3
3.1
0.2
5.5
2.4
2.2
Ltd
Navneet Education
Neutral
87
-
2,076
998
1,062
24.1
24.0
5.8
6.1
15.2
14.3
3.3
2.9
22.0
20.6
2.2
2.1
Navkar Corporation
Buy
200
265
2,854
365
436
38.3
37.5
5.6
5.9
35.5
34.0
2.2
2.1
6.3
6.1
8.2
7.0
UFO Moviez
Neutral
521
-
1,437
558
619
32.0
33.2
22.5
30.0
23.1
17.4
2.8
2.4
12.0
13.8
2.5
2.1
VRL Logistics
Neutral
277
-
2,526
1,725
1,902
16.5
16.7
12.2
14.6
22.7
19.0
4.7
4.2
20.8
21.9
1.6
1.5
Team Lease Serv.
Neutral
931
-
1,591
2,565
3,229
1.3
1.5
15.2
22.8
61.3
40.9
4.9
4.4
8.0
10.7
0.5
0.4
Stock Watch
June 01, 2016
Company Name
Reco
CMP
Target Mkt Cap
Sales ( Čcr )
OPM(%)
EPS (Č)
PER(x)
P/BV(x)
RoE(%)
EV/Sales(x)
(Č)
Price ( Č)
( Č cr )
FY16E FY17E FY16E FY17E FY16E FY17E FY16E FY17E FY16E FY17E FY16E FY17E FY16E FY17E
zOthers
S H Kelkar & Co.
Neutral
219
-
3,164
928
1,036
15.3
15.1
4.9
6.1
44.3
35.8
4.2
3.8
9.4
10.7
3.4
3.0
Quick Heal
Neutral
229
-
1,602
339
408
27.8
27.3
7.1
7.7
32.4
29.6
2.7
2.7
8.5
9.3
3.7
3.1
Narayana Hrudaya
Neutral
315
-
6,440
1,603
1,873
10.9
11.5
1.0
2.6
330.8
119.2
8.0
7.3
2.4
6.1
4.0
3.4
Manpasand Bever.
Neutral
539
-
2,698
540
836
19.9
19.6
10.2
16.9
52.6
31.9
4.3
3.8
8.1
12.0
4.6
2.9
Source: Company, Angel Research; Note: *December year end; #September year end; &October year end; Price as on May 31, 2016
Market Outlook
June 01, 2016
Research Team Tel: 022 - 39357800
DISCLAIMER
Angel Broking Private Limited (hereinafter referred to as “Angel”) is a registered Member of National Stock Exchange of India Limited,
Bombay Stock Exchange Limited and Metropolitian Stock Exchange of India Limited. It is also registered as a Depository Participant with
CDSL and Portfolio Manager with SEBI. It also has registration with AMFI as a Mutual Fund Distributor. Angel Broking Private Limited is a
registered entity with SEBI for Research Analyst in terms of SEBI (Research Analyst) Regulations, 2014 vide registration number
INH000000164. Angel or its associates has not been debarred/ suspended by SEBI or any other regulatory authority for accessing
/dealing in securities Market. Angel or its associates including its relatives/analyst do not hold any financial interest/beneficial ownership
of more than 1% in the company covered by Analyst. Angel or its associates/analyst has not received any compensation / managed or co
-managed public offering of securities of the company covered by Analyst during the past twelve months. Angel/analyst has not served as
an officer, director or employee of company covered by Analyst and has not been engaged in market making activity of the company
covered by Analyst.
This document is solely for the personal information of the recipient, and must not be singularly used as the basis of any investment
decision. Nothing in this document should be construed as investment or financial advice. Each recipient of this document should make
such investigations as they deem necessary to arrive at an independent evaluation of an investment in the securities of the companies
referred to in this document (including the merits and risks involved), and should consult their own advisors to determine the merits and
risks of such an investment.
Reports based on technical and derivative analysis center on studying charts of a stock's price movement, outstanding positions and
trading volume, as opposed to focusing on a company's fundamentals and, as such, may not match with a report on a company's
fundamentals.
The information in this document has been printed on the basis of publicly available information, internal data and other reliable sources
believed to be true, but we do not represent that it is accurate or complete and it should not be relied on as such, as this document is for
general guidance only. Angel Broking Pvt. Limited or any of its affiliates/ group companies shall not be in any way responsible for any
loss or damage that may arise to any person from any inadvertent error in the information contained in this report. Angel Broking Pvt.
Limited has not independently verified all the information contained within this document. Accordingly, we cannot testify, nor make any
representation or warranty, express or implied, to the accuracy, contents or data contained within this document. While Angel Broking
Pvt. Limited endeavors to update on a reasonable basis the information discussed in this material, there may be regulatory, compliance,
or other reasons that prevent us from doing so.
This document is being supplied to you solely for your information, and its contents, information or data may not be reproduced,
redistributed or passed on, directly or indirectly.
Neither Angel Broking Pvt. Limited, nor its directors, employees or affiliates shall be liable for any loss or damage that may arise from or
in connection with the use of this information.
Note: Please refer to the important ‘Stock Holding Disclosure' report on the Angel website (Research Section). Also, please refer to the
latest update on respective stocks for the disclosure status in respect of those stocks. Angel Broking Pvt. Limited and its affiliates may have
investment positions in the stocks recommended in this report.