Market Outlook
April 20, 2015
Dealer’s Diary
Indian markets are expected to open on flat note tracking the SGX Nifty and most
Domestic Indices
Chg (%)
(Pts)
(Close)
of its Asian peers.
BSE Sensex
(0.8)
(224)
28,442
U.S. markets moved sharply lower over the course of the trading day on Friday,
Nifty
(1.2)
(101)
8,606
adding to the modest losses posted in the previous session. The weakness on Wall
MID CAP
(0.5)
(57)
11,071
Street was partly attributed to a sell-off in Chinese futures, which fell sharply amid
SMALL CAP
(0.3)
(41)
11,901
concerns about new trading regulations.
BSE HC
(1.5)
(285)
18,140
The European markets ended Friday's session solidly in negative territory. Concerns
BSE PSU
0.1
6
7,997
over the situation in Greece also had a negative impact on the markets. German
BANKEX
(1.6)
(351)
21,091
Finance Minister Wolfgang Schaeuble refused further concessions to Greece and
AUTO
(1.1)
(218)
19,113
the International Monetary Fund ruled out giving the country any leeway on 1
METAL
1.1
114
10,129
billion euros of debt repayments due by early May.
OIL & GAS
(0.4)
(35)
9,810
BSE IT
(1.5)
(170)
11,502
Back home, Indian shares fell for a third consecutive session on Friday as investors
Global Indices
Chg (%)
(Pts)
(Close)
digested some lackluster earnings reports and monitored crude price movements
Dow Jones
(1.5)
(279)
17,826
amid concerns weak monsoon rains and a rebound in oil prices could again flare
NASDAQ
(1.5)
(76)
4,932
up inflation.
FTSE
(0.9)
(66)
6,995
News Analysis
Nikkei
(1.2)
(233)
19,653
Sebi moves SC against DLF
Hang Sang
(0.3)
(87)
27,653
Refer detailed news analysis on the following page
Straits Times
(0.2)
(6)
3,525
Markets Today
Shanghai Com
2.2
92
4,287
The trend deciding level for the day is 28,514 / 8,634 levels. If NIFTY trades above
this level during the first half-an-hour of trade then we may witness a further rally
Indian ADR
Chg (%)
(Pts)
(Close)
up to 28,624 - 28,806 / 8,672 - 8,737 levels. However, if NIFTY trades below 28,514
INFY
(0.6)
(0.2)
$35.1
/ 8,634 levels for the first half-an-hour of trade then it may correct towards 28,332 -
WIT
(1.3)
(0.2)
$12.8
28,222 / 8,569 - 8,531 levels.
IBN
(1.5)
(0.2)
$10.3
Indices
S2
S1
PIVOT
R1
R2
HDB
(1.8)
(1.1)
$57.6
SENSEX
28,222
28,332
28,514
28,624
28,806
NIFTY
8,531
8,569
8,634
8,672
8,737
Advances / Declines
BSE
NSE
Advances
1,142
490
Net Inflows (Apr 16, 2015)
Declines
1,699
1,029
` cr
Purch
Sales
Net
MTD
YTD
Unchanged
112
62
FII
4,363
4,574
(211)
1,837
136,252
MFs
743
697
46
(25)
32,342
Volumes (` cr)
BSE
3,457
FII Derivatives (Apr 17, 2015)
NSE
17,779
` cr
Purch
Sales
Net
Open Interest
Index Futures
1,647
1,238
409
17,970
Stock Futures
2,286
3,179
(893)
56,160
Gainers / Losers
Gainer
Loser
Company
Price (`)
chg (%)
Company
Price (`)
chg (%)
GUJRATGAS
805
7.8
BHARATFORG
1,197
(7.9)
IDBI
82
4.6
CENTURYTEX
708
(7.1)
SRF
1,062
3.6
CRISIL
2,181
(7.0)
MRPL
74
3.3
MINDTREE
1,296
(6.9)
FINOLEXIND
306
3.2
LUPIN
1,769
(6.8)
Market Outlook
April 20, 2015
Sebi moves SC against DLF
The Securities and Exchange Board of India (Sebi) has moved the Supreme Court,
challenging a tribunal order in the matter of disclosure norm violations in IPO by
DLF. The SAT had in March quashed Sebi's October order banning DLF, its
promoters and related entities from the capital market for three years. While
banning the company from the capital markets, Sebi had alleged the company
deliberately withheld information from its Initial Public Offering investors about a
(police) First Information Report filed by a Kimsuk Krishna Sinha against the
company. Sinha claimed a subsidiary of DLF had cheated him of `34 cr.
Although initially Sebi had not taken any action on Sinha's complaint, it initiated
investigation following a direction from the Delhi high court in 2011.In its order,
SAT chastised Sebi for the loss caused to investors following the order of the
markets regulator, terming it a case of "over-regulation" by Sebi.
Quarterly Bloomberg Brokers Consensus Estimate
Hindustan Zinc Ltd - April 20, 2015
Particulars (` cr)
4QFY15E
4QFY14
y-o-y (%)
3QFY15
q-o-q (%)
Net sales
3,935
3,589
9.7
3,804
3.5
EBITDA
1,892
1,855
2.0
2,089
(9.4)
EBITDA margin (%)
48.1
51.7
54.9
Net profit
2,081
1,881
10.6
2,379
(12.5)
Wipro Ltd Consol - April 21, 2015
Particulars (` cr)
4QFY15E
4QFY14
y-o-y (%)
3QFY15
q-o-q (%)
Net sales
12,030
11,653
3.2
11,993
0.3
EBITDA
2,718
2,818
(3.6)
2,676
1.6
EBITDA margin (%)
22.6
24.2
22.3
Net profit
2,165
2,227
(2.8)
2,193
(1.3)
HCL Technologies Ltd Consol - April 21, 2015
Particulars (` cr)
3QFY15E
3QFY14
y-o-y (%)
2QFY15
q-o-q (%)
Net sales
9,355
8,349
12.0
9,283
0.8
EBITDA
2,257
2,232
1.1
2,319
(2.7)
EBITDA margin (%)
24.1
26.7
25.0
Net profit
1,811
1,624
11.5
1,915
(5.4)
Economic and Political News
Indian economy to grow at 7.3% in 2015: Moody's Analytics
Indian delegation to visit Iran to discuss oil deals
Paswan asks UP to settle sugarcane farmers' dues
Market Outlook
April 20, 2015
Corporate News
EBR closure wont impact our plans: Hero
Piramal Enterprises acquires minority stake in Apollo's Health Super Hiway
India Yamaha Motor targets sale of 12 lakh units by 2017
Market Outlook
April 20, 2015
Result Calendar
Date
Company
April 20, 2015
Persistent, Hind. Zinc
April 21, 2015
Wipro, HCL Tech
April 22, 2015
Rallis, Yes Bank
April 23, 2015
HDFC Bank, Infotech Enterprises, Cairn India, Gujarat Gas, MRF
April 24, 2015
FAG Bearings, Siemens, Infosys
April 25, 2015
UltraTech Cement, Petronet LNG
April 27, 2015
United Phosphorus, Maruti, ICICI Bank, Alembic Pharma
April 28, 2015
Godrej Consumer, KPIT Cummins
April 29, 2015
TVS Motor, Ambuja Cements, HDFC, Federal Bank, Hexaware, Sesa Goa, Aventis
April 30, 2015
Axis Bank, IDFC, Shriram Trans., L G Balakrishnan & Bros
May 1, 2015
Elecon Engineering
Source: Bloomberg, Angel Research
Global economic events release calendar
Date
Time
Country Event Description
Unit
Period
Bloomberg Data
Last Reported Estimated
April 17, 2015
6:00PM US
Consumer price index (mom)
% Change
Mar
0.22
0.30
2:30PM Euro Zone Euro-Zone CPI (YoY)
%
Mar F
(0.10)
(0.10)
2:00PM UK
Jobless claims change
% Change
Mar
(31.00)
(29.50)
April 22, 2015
7:30PM Euro Zone Euro-Zone Consumer Confidence
Value
Apr A
(3.70)
--
7:30PM US
Existing home sales
Million
Mar
4.88
--
April 23, 2015
1:00PM Germany PMI Services
Value
Apr P
55.40
--
1:00PM Germany PMI Manufacturing
Value
Apr P
52.80
--
7:30PM US
New home sales
Thousands
Mar
539.00
--
April 28, 2015
2:00PM UK
GDP (YoY)
% Change
1Q A
3.00
--
7:30PM US
Consumer Confidence
S.A./ 1985=100
Apr
101.30
--
April 29, 2015
6:00PM US
GDP Qoq (Annualised)
% Change
1Q A
2.20
--
April 30, 2015
1:25PM Germany Unemployment change (000's)
Thousands
Apr
(14.00)
--
May 1,, 2015
6:30AM China PMI Manufacturing
Value
Apr
50.10
--
2:00PM UK
PMI Manufacturing
Value
Apr
54.40
--
May 8,, 2015
6:00PM US
Change in Nonfarm payrolls
Thousands
Apr
126.00
--
6:00PM US
Unnemployment rate
%
Apr
5.50
--
May 9,, 2015
7:00AM China Consumer Price Index (YoY)
% Change
Apr
1.40
--
May 11, 2015
4:30PM UK
BOE Announces rates
% Ratio
May 11
0.50
0.50
Source: Bloomberg, Angel Research
Market Outlook
April 20, 2015
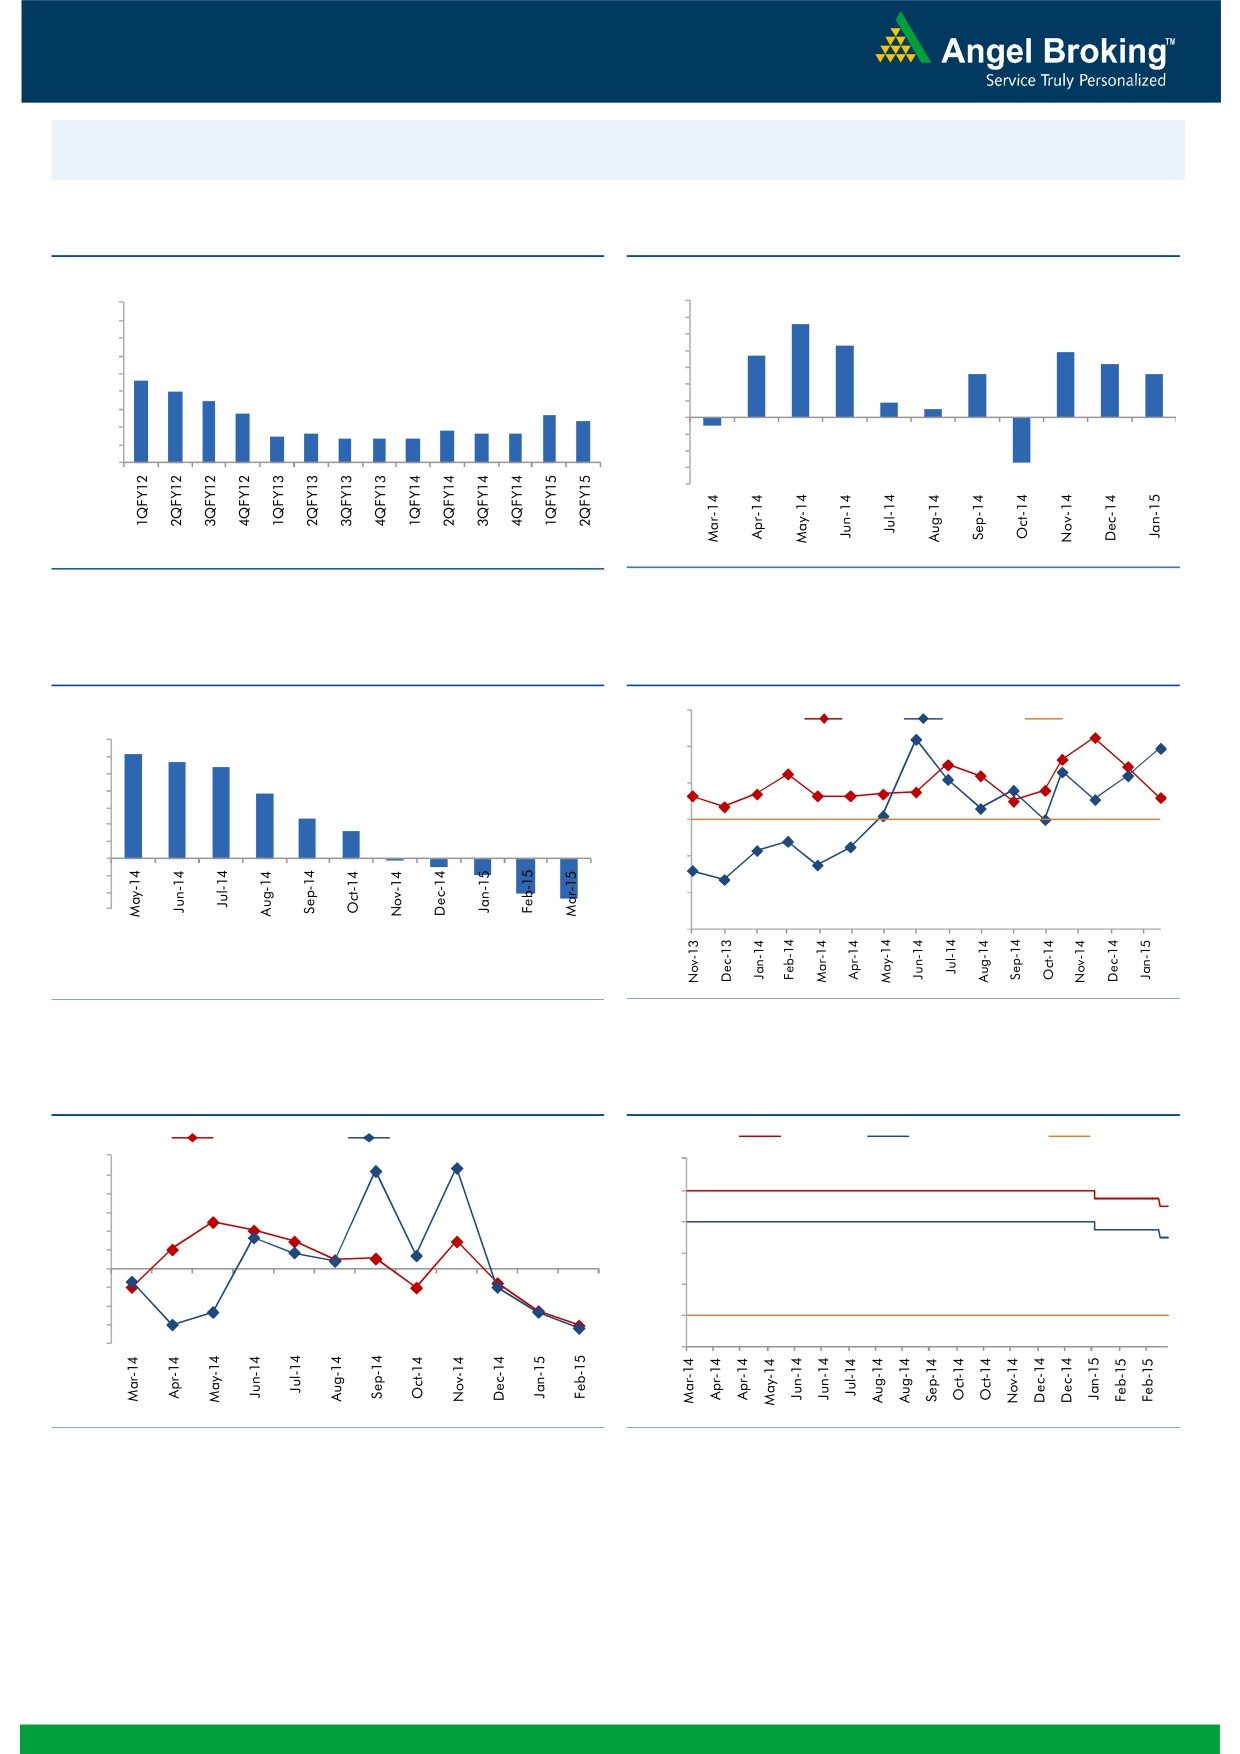
Macro watch
Exhibit 1: Quarterly GDP trends
Exhibit 2: IIP trends
(%)
(%)
12.0
7.0
5.6
11.0
6.0
4.3
10.0
5.0
3.7
3.9
4.0
3.2
9.0
2.6
2.6
7.6
3.0
8.0
7.0
6.5
2.0
0.9
7.0
0.5
5.8
5.7
1.0
5.3
6.0
4.6
4.8
4.6
4.6
-
4.5
4.4
4.4
4.4
5.0
(1.0)
4.0
(0.5)
(2.0)
3.0
(3.0)
(4.0)
(2.7)
Source: CSO, Angel Research
Source: MOSPI, Angel Research
Exhibit 3: Monthly WPI inflation trends
Exhibit 4: Manufacturing and services PMI
(%)
56.0
Mfg. PMI
Services PMI
7.0
6.2
5.7
5.4
54.0
6.0
5.0
3.9
52.0
4.0
2.4
3.0
1.7
50.0
2.0
1.0
-0.2
-0.5
-1.0
-2.1
-2.3
0.0
48.0
-1.0
-2.0
46.0
-3.0
44.0
Source: MOSPI, Angel Research
Source: Market, Angel Research; Note: Level above 50 indicates expansion
Exhibit 5: Exports and imports growth trends
Exhibit 6: Key policy rates
(%)
Exports yoy growth
Imports yoy growth
(%)
Repo rate
Reverse Repo rate
CRR
30.0
9.00
25.0
20.0
8.00
15.0
7.00
10.0
5.0
6.00
0.0
(5.0)
5.00
(10.0)
4.00
(15.0)
(20.0)
3.00
Source: Bloomberg, Angel Research
Source: RBI, Angel Research
Market Outlook
April 20, 2015
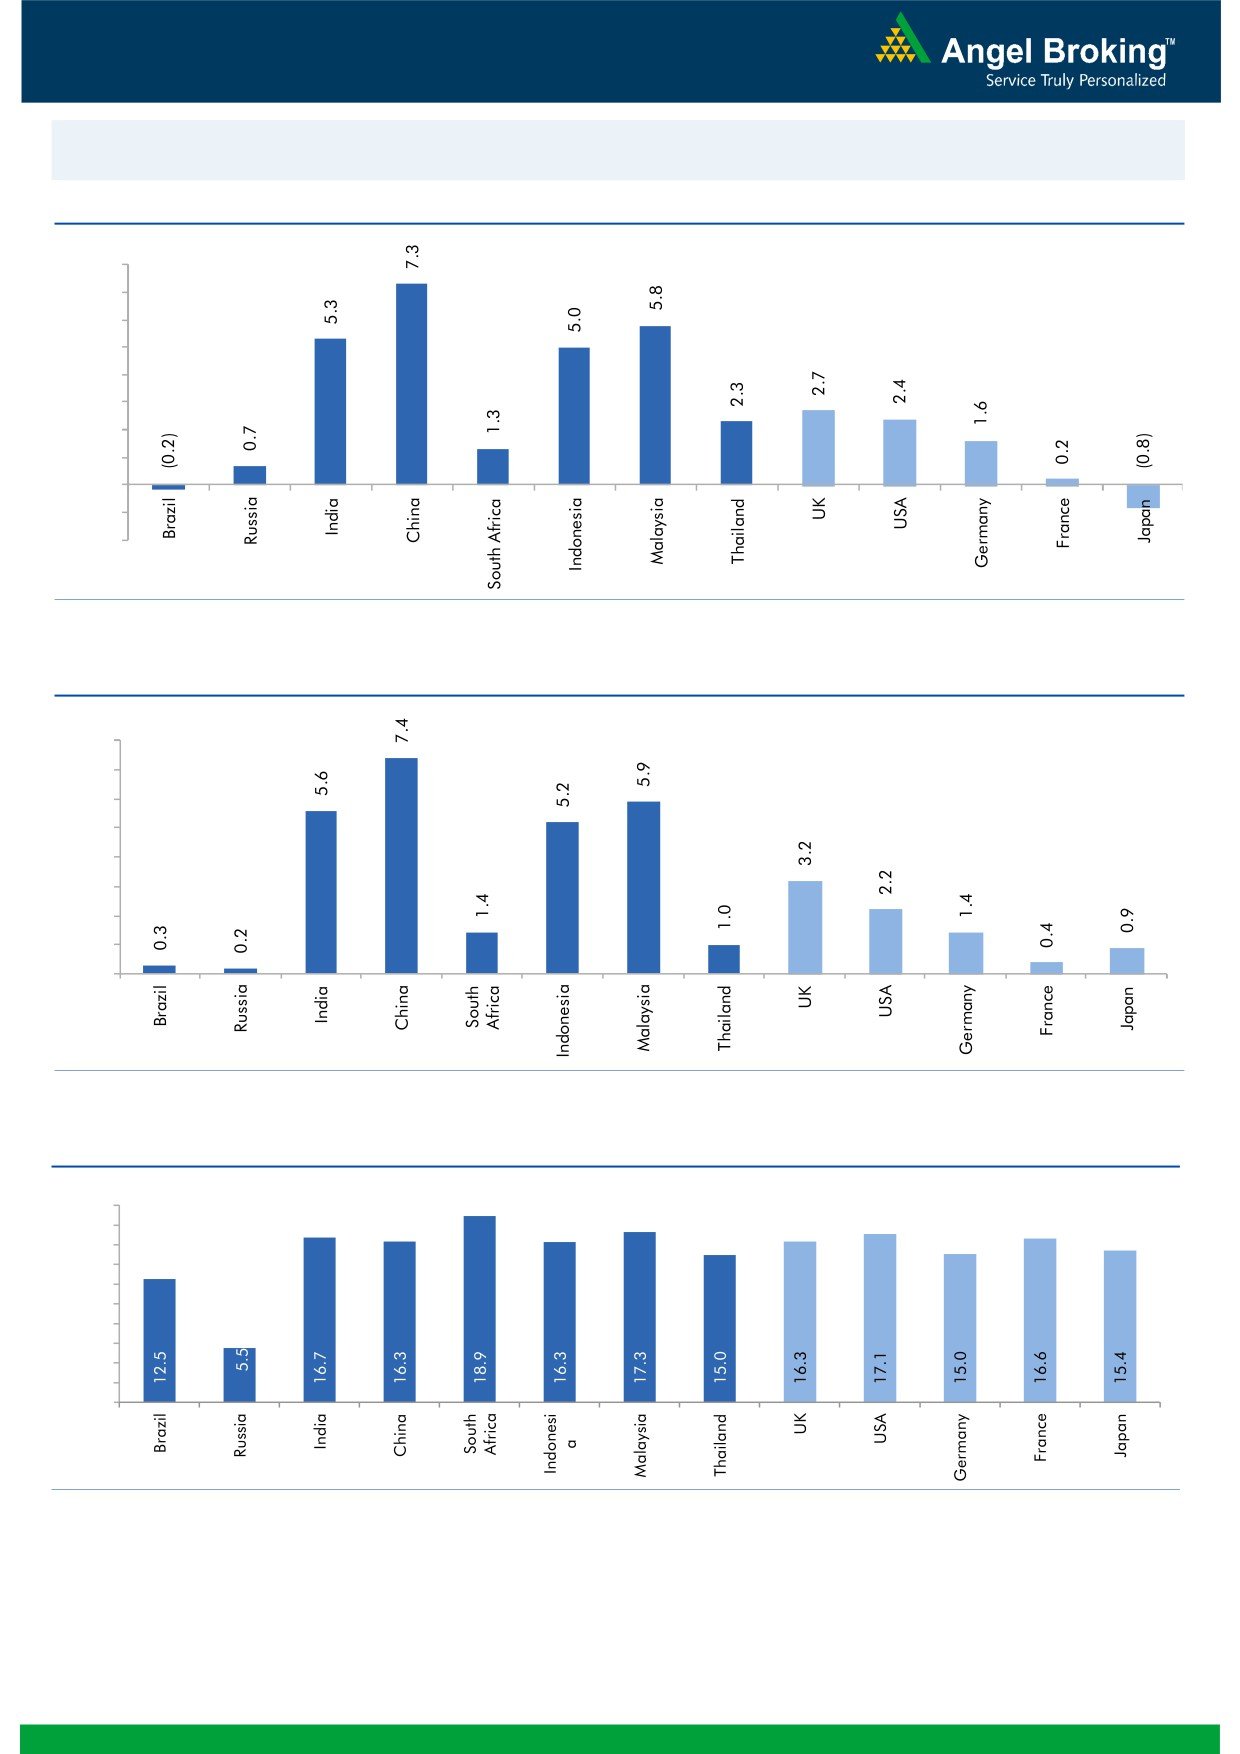
Global watch
Exhibit 1: Latest quarterly GDP Growth (%, yoy) across select developing and developed countries
(%)
8.0
7.0
6.0
5.0
4.0
3.0
2.0
1.0
-
(1.0)
(2.0)
Source: Bloomberg, Angel Research
Exhibit 2: 2014 GDP Growth projection by IMF (%, yoy) across select developing and developed countries
(%)
8.0
7.0
6.0
5.0
4.0
3.0
2.0
1.0
-
Source: IMF, Angel Research
Exhibit 3: One year forward P-E ratio across select developing and developed countries
(x)
20.0
18.0
16.0
14.0
12.0
10.0
8.0
6.0
4.0
2.0
-
Source: Bloomberg, Angel Research
Market Outlook
April 20, 2015
Exhibit 4: Relative performance of indices across globe
Returns (%)
Country
Name of index
Closing price
1M
3M
1YR
Brazil
Bovespa
53,955
13.0
14.1
7.4
Russia
Micex
1,657
4.2
9.4
28.0
India
Nifty
8,606
0.6
6.3
30.2
China
Shanghai Composite
4,287
21.1
21.0
98.4
South Africa
Top 40
47,492
2.5
9.3
10.1
Mexico
Mexbol
45,012
4.7
6.8
11.7
Indonesia
LQ45
939
(0.2)
4.8
14.7
Malaysia
KLCI
1,846
3.4
6.5
(0.6)
Thailand
SET 50
1,040
2.0
1.2
8.6
USA
Dow Jones
17,826
2.0
2.7
10.3
UK
FTSE
6,995
5.0
8.5
7.8
Japan
Nikkei
19,653
2.3
16.2
39.1
Germany
DAX
11,689
3.7
23.0
33.3
France
CAC
5,143
5.4
22.5
17.2
Source: Bloomberg, Angel Research
Market Outlook
April 20, 2015
Stock Watch
Company Name
Reco
CMP
Target
Mkt Cap
Sales ( Čcr )
OPM(%)
EPS (Č)
PER(x)
P/BV(x)
RoE(%)
EV/Sales(x)
(Č)
Price ( Č)
( Č cr )
FY16E FY17E
FY16E
FY17E
FY16E
FY17E
FY16E
FY17E
FY16E
FY17E
FY16E
FY17E
FY16E
FY17E
Agri / Agri Chemical
Rallis
Neutral
232
-
4,509
2,344
2,755
13.9
13.9
10.5
12.3
22.1
18.9
4.6
3.8
22.3
22.1
1.9
1.6
United Phosphorus
Buy
430
510
18,417
13,627
15,671
17.5
17.5
35.7
42.0
12.0
10.2
2.4
2.0
21.8
21.3
1.4
1.1
Auto & Auto Ancillary
Ashok Leyland
Accumulate
73
78
20,761
17,882
21,104
9.5
11.0
2.8
4.7
26.1
15.5
3.6
3.4
14.0
21.6
1.1
0.9
Bajaj Auto
Accumulate
2,066
2,360
59,775
25,715
29,956
19.6
19.5
127.0
147.5
16.3
14.0
4.8
4.1
29.3
29.3
1.9
1.6
Eicher Motors
Buy
15,311
18,347
41,504
12,526
16,478
14.9
16.6
416.9
637.3
36.7
24.0
12.4
9.0
33.4
37.2
3.2
2.4
Hero Motocorp
Buy
2,410
3,118
48,128
32,123
38,053
13.4
13.7
159.2
183.4
15.1
13.1
6.6
5.7
43.5
43.6
1.3
1.1
L G Balakrishnan & Bros Buy
503
723
790
1,354
1,529
13.3
13.3
49.2
55.6
10.2
9.0
1.8
1.5
17.6
16.9
0.7
0.6
Mahindra and Mahindra Accumulate
1,224
1,343
76,040
41,266
45,755
12.0
12.1
54.4
62.4
22.5
19.6
3.5
3.1
15.5
15.8
1.6
1.4
Maruti
Accumulate
3,642
4,135
110,030
60,257
70,931
14.8
14.5
181.0
217.6
20.1
16.7
4.0
3.5
20.1
20.7
1.6
1.3
Setco Automotive
Accumulate
250
286
668
718
862
13.3
14.3
13.4
19.0
18.7
13.2
2.9
2.4
15.4
18.5
1.2
1.0
Tata Motors
Buy
535
620
152,125
290,857
319,151
15.4
15.2
54.3
61.5
9.9
8.7
1.8
1.5
18.9
17.9
0.7
0.6
TVS Motor
Accumulate
245
267
11,621
12,215
14,451
7.2
8.2
12.4
17.8
19.7
13.7
5.6
4.2
28.2
30.5
0.9
0.7
Amara Raja Batteries
Neutral
863
-
14,745
5,355
6,641
17.4
17.8
31.8
40.9
27.1
21.1
6.8
5.4
25.2
25.5
2.7
2.1
Exide Industries
Accumulate
188
200
15,976
8,383
9,640
13.9
14.4
8.4
10.1
22.4
18.6
3.5
3.1
15.6
16.8
1.6
1.4
Apollo Tyres
Accumulate
185
197
9,417
13,097
14,330
15.7
15.4
20.2
19.7
9.2
9.4
1.5
1.3
15.8
13.4
0.8
0.8
Ceat
Neutral
909
-
3,677
6,482
7,423
12.8
12.1
89.1
99.7
10.2
9.1
1.8
1.5
17.6
16.8
0.7
0.6
JK Tyres
Accumulate
124
140
2,823
8,302
9,230
13.3
12.9
18.6
20.0
6.7
6.2
1.6
1.3
24.3
21.3
0.6
0.6
Swaraj Engines
Buy
835
986
1,038
656
742
14.1
14.3
55.8
65.7
15.0
12.7
3.7
3.2
24.5
25.5
1.4
1.2
Subros
Buy
69
80
417
1,416
1,706
11.3
11.3
4.4
7.3
15.8
9.5
1.2
1.1
8.1
12.4
0.6
0.5
Indag Rubber
Buy
1,045
1,234
549
283
329
17.0
17.2
64.8
77.1
16.1
13.6
3.5
2.9
21.8
21.6
1.7
1.4
Capital Goods
ACE
Buy
42
54
411
660
839
4.7
8.2
1.0
3.9
41.6
10.7
1.3
1.2
3.2
11.3
0.8
0.6
BGR Energy
Neutral
131
-
944
3,615
3,181
9.5
9.4
16.7
12.4
7.8
10.6
0.7
0.7
10.0
7.0
0.7
0.8
BHEL
Neutral
235
-
57,482
33,722
35,272
10.8
11.7
10.5
14.2
22.4
16.5
1.7
1.6
7.0
9.0
1.8
1.7
Blue Star
Accumulate
333
377
2,995
3,619
4,122
4.6
5.2
9.4
13.2
35.5
25.2
5.0
4.3
15.1
14.4
0.9
0.8
Crompton Greaves
Buy
173
220
10,868
15,252
16,870
5.4
5.6
7.9
10.7
22.0
16.2
2.7
2.3
12.0
15.0
0.8
0.7
KEC International
Neutral
105
-
2,694
8,791
9,716
6.1
6.8
5.4
8.2
19.4
12.8
1.9
1.8
10.0
14.0
0.5
0.5
Thermax
Neutral
1,053
-
12,544
6,413
7,525
7.4
8.5
30.5
39.3
34.5
26.8
5.3
4.6
15.0
17.0
1.9
1.6
Cement
ACC
Accumulate
1,520
1,650
28,529
12,882
14,936
16.3
18.9
62.7
88.8
24.2
17.1
3.2
2.9
13.8
17.9
2.1
1.7
Ambuja Cements
Neutral
247
-
38,266
10,930
12,022
22.2
23.2
9.7
11.2
25.4
22.0
3.5
3.2
14.3
15.2
3.1
2.8
Market Outlook
April 20, 2015
Stock Watch
Company Name
Reco
CMP
Target
Mkt Cap
Sales ( Čcr )
OPM(%)
EPS (Č)
PER(x)
P/BV(x)
RoE(%)
EV/Sales(x)
(Č)
Price ( Č)
( Č cr )
FY16E
FY17E
FY16E
FY17E
FY16E
FY17E
FY16E
FY17E
FY16E
FY17E
FY16E
FY17E
FY16E
FY17E
Cement
India Cements
Buy
100
146
3,076
5,349
5,721
15.6
16.3
3.6
6.0
27.5
16.7
0.9
0.9
3.4
5.4
1.0
0.9
JK Cement
Buy
651
778
4,553
4,077
4,772
16.3
18.0
22.4
42.5
29.1
15.3
2.3
2.1
8.2
14.3
1.6
1.3
J K Lakshmi Cement
Buy
349
443
4,106
3,101
3,699
20.2
21.4
18.3
27.8
19.1
12.5
2.6
2.2
14.2
19.1
1.7
1.4
Mangalam Cements
Buy
279
360
745
1,141
1,375
14.6
14.8
24.4
34.7
11.4
8.0
1.3
1.2
11.8
15.3
0.9
0.7
Orient Cement
Neutral
182
-
3,721
2,185
2,728
22.2
23.1
7.6
12.3
24.0
14.8
3.5
3.0
15.5
22.0
2.3
1.7
Ramco Cements
Accumulate
311
350
7,408
4,205
4,860
20.6
21.8
13.4
20.0
23.2
15.6
2.3
1.8
10.7
12.9
2.2
1.7
Shree Cement^
Neutral
10,017
-
34,896
7,150
8,742
26.7
28.6
228.0
345.5
43.9
29.0
6.5
5.4
15.7
20.3
4.6
3.7
UltraTech Cement
Buy
2,807
3,526
77,019
28,131
32,999
22.6
24.0
121.8
161.2
23.1
17.4
3.5
2.9
16.1
18.3
2.8
2.3
Construction
ITNL
Buy
183
211
4,519
7,589
8,021
34.0
35.9
16.0
19.0
11.5
9.6
0.7
0.7
6.5
6.7
3.7
3.9
Larsen & Toubro
Buy
1,742
2,013
161,953
68,920
82,446
10.9
11.5
57.0
73.0
30.6
23.9
2.8
2.6
13.6
15.5
2.6
2.1
Gujarat Pipavav Port
Neutral
236
-
11,385
793
694
53.0
50.9
9.0
8.0
26.2
29.4
5.7
4.6
25.9
18.4
14.0
15.9
MBL Infrastructures
Buy
599
789
1,242
2,507
2,986
12.4
14.4
43.0
41.0
13.9
14.6
1.7
1.5
12.6
12.7
1.3
1.1
Financials
Allahabad Bank
Buy
104
133
5,968
8,859
9,817
3.0
3.0
23.7
30.1
4.4
3.5
0.5
0.4
10.6
12.3
-
-
Axis Bank
Buy
534
688
126,637
26,312
31,472
3.8
3.8
37.4
45.9
14.3
11.6
2.9
2.5
18.6
19.6
-
-
Bank of Baroda
Neutral
178
-
39,265
20,111
23,158
2.1
2.1
21.0
26.0
8.5
6.8
1.0
0.8
11.1
12.5
-
-
Bank of India
Buy
228
288
15,163
17,402
20,003
2.0
2.1
40.3
50.7
5.7
4.5
0.6
0.5
9.0
10.4
-
-
Canara Bank
Accumulate
401
454
19,074
15,805
17,745
2.0
2.2
64.3
73.5
6.3
5.5
0.7
0.6
10.8
11.3
-
-
Dena Bank
Buy
52
63
2,815
3,580
4,040
2.1
2.2
8.4
10.9
6.3
4.8
0.5
0.4
6.8
8.4
-
-
Federal Bank
Buy
132
155
11,268
3,522
4,045
3.2
3.2
12.2
14.1
10.8
9.4
1.3
1.2
12.9
13.4
-
-
HDFC
Accumulate
1,303
1,383
205,104
11,198
13,321
3.5
3.5
45.1
53.7
28.9
24.3
6.0
5.3
27.2
28.2
-
-
HDFC Bank
Buy
1,019
1,240
255,387
37,680
45,854
4.6
4.7
50.6
62.6
20.1
16.3
3.6
3.1
19.3
20.4
-
-
ICICI Bank
Buy
310
384
179,782
35,561
41,738
3.5
3.6
22.7
27.1
13.7
11.4
2.2
1.9
15.5
16.3
-
-
IDBI Bank
Accumulate
82
86
13,120
9,806
11,371
1.7
1.9
10.0
16.3
8.2
5.0
0.6
0.5
6.8
10.4
-
-
Indian Bank
Buy
165
201
7,908
6,454
7,321
2.5
2.6
26.4
33.3
6.3
4.9
0.5
0.5
8.1
9.6
-
-
LIC Housing Finance
Buy
438
612
22,082
2,910
3,468
2.3
2.3
30.3
36.3
14.4
12.1
2.3
2.0
16.6
17.4
-
-
Oriental Bank
Accumulate
230
262
6,886
7,820
8,675
2.4
2.4
43.8
48.1
5.3
4.8
0.5
0.5
9.3
9.5
-
-
Punjab Natl.Bank
Buy
163
202
30,276
25,347
28,924
3.0
3.1
24.6
31.5
6.6
5.2
0.8
0.7
11.4
13.3
-
-
South Ind.Bank
Accumulate
25
28
3,396
1,999
2,249
2.4
2.4
3.5
4.0
7.2
6.3
0.9
0.8
12.6
13.1
-
-
St Bk of India
Accumulate
291
321
220,214
86,900
100,550
3.1
3.1
22.1
27.7
13.2
10.5
1.6
1.4
12.7
14.3
-
-
Market Outlook
April 20, 2015
Stock Watch
Company Name
Reco
CMP
Target
Mkt Cap
Sales ( Čcr )
OPM(%)
EPS (Č)
PER(x)
P/BV(x)
RoE(%)
EV/Sales(x)
(Č)
Price ( Č)
( Č cr )
FY16E FY17E
FY16E
FY17E
FY16E
FY17E
FY16E
FY17E
FY16E
FY17E
FY16E
FY17E
FY16E
FY17E
Financials
Union Bank
Buy
164
194
10,443
12,995
14,782
2.4
2.4
32.3
40.9
5.1
4.0
0.6
0.5
10.7
12.3
-
-
Vijaya Bank
Neutral
47
-
4,038
3,474
3,932
1.8
1.9
5.9
7.2
8.0
6.5
0.7
0.6
8.1
9.3
-
-
Yes Bank
Buy
810
1,083
33,847
6,854
8,571
3.2
3.2
60.5
74.7
13.4
10.8
2.4
2.1
19.7
20.6
-
-
FMCG
Asian Paints
Neutral
819
-
78,563
16,553
19,160
16.0
16.2
17.7
21.5
46.3
38.1
12.3
11.1
29.4
31.2
4.6
4.0
Britannia
Neutral
2,300
-
27,579
8,065
9,395
9.6
10.2
47.2
65.5
48.7
35.1
16.2
15.3
38.3
41.2
3.3
2.8
Colgate
Neutral
2,077
-
28,248
4,836
5,490
19.5
19.7
48.5
53.2
42.8
39.0
31.4
27.3
99.8
97.5
5.7
5.0
Dabur India
Neutral
273
-
47,962
9,370
10,265
17.1
17.2
7.3
8.1
37.2
33.7
11.2
9.1
33.7
30.6
5.0
4.6
GlaxoSmith Con*
Neutral
6,300
-
26,495
4,919
5,742
17.2
17.4
168.3
191.2
37.4
33.0
10.6
9.0
28.8
28.9
4.9
4.2
Godrej Consumer
Neutral
1,171
-
39,858
10,168
12,886
16.1
16.1
32.1
38.4
36.5
30.5
7.4
6.9
19.7
21.0
4.0
3.2
HUL
Neutral
937
-
202,609
34,940
38,957
17.5
17.7
20.8
24.7
45.0
37.9
50.1
40.0
110.5
114.2
5.6
5.0
ITC
Buy
352
409
281,946
41,068
45,068
37.8
37.4
13.9
15.9
25.3
22.1
8.5
7.5
34.1
33.8
6.5
5.9
Marico
Neutral
416
-
26,847
6,551
7,766
15.7
16.0
10.4
12.5
40.1
33.3
11.6
9.7
33.2
32.4
4.0
3.4
Nestle*
Neutral
6,986
-
67,358
11,291
12,847
22.2
22.3
158.9
184.6
44.0
37.9
23.0
20.7
55.0
57.3
5.8
5.1
Tata Global
Buy
158
186
9,743
8,735
9,182
9.8
9.9
8.5
9.3
18.5
16.9
2.4
2.3
7.9
8.1
1.1
1.0
IT
HCL Tech^
Buy
939
1,148
131,995
41,535
46,519
24.0
23.4
54.6
63.8
17.2
14.7
3.9
3.0
23.8
20.2
3.1
2.8
Infosys
Buy
2,182
2,751
250,591
59,985
66,703
28.0
28.0
119.8
131.0
18.2
16.7
3.8
3.3
21.0
19.7
3.4
2.9
TCS
Buy
2,476
3,350
485,020
108,420
123,559
29.2
29.1
123.9
139.6
20.0
17.7
7.1
6.0
35.7
33.9
4.2
3.6
Tech Mahindra
Buy
641
825
61,587
27,754
31,918
20.0
20.0
38.6
48.5
16.6
13.2
3.9
3.0
23.7
22.9
1.8
1.5
Wipro
Buy
587
816
144,823
54,050
61,617
23.7
23.8
37.9
48.0
15.5
12.2
2.9
2.4
19.0
19.7
2.4
2.1
Media
D B Corp
Neutral
369
-
6,777
2,241
2,495
27.8
27.9
21.8
25.6
17.0
14.4
4.4
3.9
26.7
28.5
3.0
2.7
HT Media
Accumulate
113
129
2,636
2,495
2,703
13.5
13.6
9.4
10.7
12.1
10.6
1.2
1.1
10.4
10.6
0.6
0.5
Jagran Prakashan
Buy
122
156
4,000
1,939
2,122
26.0
26.0
8.3
9.2
14.7
13.3
2.5
2.3
17.5
17.1
2.0
1.8
Sun TV Network
Accumulate
373
422
14,691
2,779
3,196
70.2
70.5
22.8
27.3
16.4
13.7
4.0
3.6
26.7
28.3
5.0
4.4
Hindustan Media
Buy
223
292
1,633
920
1,031
20.0
20.0
19.2
20.9
11.6
10.7
1.9
1.6
16.4
15.3
1.3
1.2
Ventures
Metals & Mining
Coal India
Accumulate
381
405
240,717
77,595
89,628
22.9
24.4
27.6
30.0
13.8
12.7
4.6
4.1
33.9
33.2
2.1
1.7
Hind. Zinc
Neutral
172
-
72,718
15,546
16,821
47.5
49.0
19.7
20.3
8.7
8.5
1.5
1.3
17.2
16.6
2.4
1.9
Hindalco
Neutral
140
-
28,868
112,328
119,817
7.7
7.9
16.3
20.1
8.6
7.0
0.6
0.6
8.0
8.5
0.7
0.6
JSW Steel
Buy
957
1,140
23,138
48,125
53,595
18.8
21.0
46.9
97.5
20.4
9.8
1.0
0.9
5.1
9.9
1.3
1.1
NMDC
Neutral
134
-
53,028
12,544
13,330
59.5
59.7
16.3
16.5
8.2
8.1
1.5
1.4
19.1
18.1
3.0
2.9
Market Outlook
April 20, 2015
Stock Watch
Company Name
Reco
CMP
Target
Mkt Cap
Sales ( Čcr )
OPM(%)
EPS (Č)
PER(x)
P/BV(x)
RoE(%)
EV/Sales(x)
(Č)
Price ( Č)
( Č cr )
FY16E FY17E
FY16E
FY17E
FY16E
FY17E
FY16E
FY17E
FY16E
FY17E
FY16E
FY17E
FY16E
FY17E
Metals & Mining
SAIL
Neutral
77
-
31,884
56,365
63,383
6.9
8.0
7.1
8.2
10.8
9.5
0.7
0.7
7.0
7.1
1.1
1.0
Sesa Sterlite
Neutral
211
-
62,629
81,842
88,430
30.6
32.8
20.2
25.7
10.5
8.2
0.8
0.7
7.5
8.5
1.1
0.9
Tata Steel
Buy
346
410
33,589
136,805
149,228
11.3
11.9
26.4
36.8
13.1
9.4
0.8
0.7
6.0
8.0
0.8
0.7
Oil & Gas
Cairn India
Neutral
230
-
43,178
12,617
14,513
33.7
40.0
25.5
27.7
9.1
8.3
0.7
0.6
7.4
7.7
2.1
1.8
GAIL
Neutral
389
-
49,306
75,595
85,554
8.6
8.0
31.8
36.1
12.2
10.8
1.3
1.2
10.7
11.4
0.8
0.7
ONGC
Neutral
330
-
282,246
174,773
192,517
22.7
24.8
34.6
38.2
9.5
8.6
1.4
1.3
14.2
14.9
1.7
1.5
Petronet LNG
Neutral
184
-
13,815
45,759
49,386
3.7
4.0
12.6
14.9
14.6
12.4
2.2
2.0
16.1
16.7
0.4
0.3
Reliance Industries
Accumulate
927
990
299,924
339,083
384,014
7.8
9.5
75.7
94.5
12.3
9.8
1.2
1.2
10.7
12.2
1.2
1.1
Pharmaceuticals
Alembic Pharma
Neutral
485
-
9,143
2,587
3,069
19.7
20.2
19.2
23.6
25.3
20.6
7.5
5.7
33.7
31.3
3.5
2.9
Aurobindo Pharma
Accumulate
1,335
1,502
38,972
14,054
16,162
21.9
21.9
64.5
75.1
20.7
17.8
5.6
4.3
31.2
27.5
3.2
2.7
Aventis*
Buy
3,299
3,886
7,597
2,247
2,534
16.0
16.8
119.1
138.8
27.7
23.8
4.1
3.3
20.0
23.3
3.1
2.6
Cadila Healthcare
Neutral
1,739
-
35,612
10,176
11,846
18.7
19.7
64.3
79.6
27.1
21.9
6.7
5.3
27.4
26.9
3.6
3.0
Cipla
Neutral
680
-
54,625
14,051
16,515
18.9
18.7
25.2
28.9
27.0
23.5
4.1
3.5
16.3
16.1
3.8
3.2
Dr Reddy's
Accumulate
3,651
4,118
62,182
18,807
21,743
23.2
22.6
184.1
205.9
19.8
17.7
4.4
3.6
24.7
22.4
2.7
2.2
Dishman Pharma
Buy
171
219
1,379
1,662
1,828
22.2
22.2
21.9
27.4
7.8
6.2
1.0
0.8
13.0
14.3
1.0
0.8
GSK Pharma*
Neutral
3,255
-
27,572
2,853
3,082
20.5
20.4
59.4
62.3
54.8
52.3
14.0
13.8
25.7
26.6
8.7
8.0
Indoco Remedies
Neutral
354
-
3,266
1,112
1,292
18.2
18.2
12.7
15.3
27.9
23.2
5.2
4.3
20.2
20.2
2.6
2.1
Ipca labs
Buy
660
810
8,329
4,270
4,957
18.6
18.6
39.6
45.0
16.7
14.7
3.1
2.6
20.3
19.4
2.1
1.8
Lupin
Neutral
1,769
-
79,499
16,528
19,183
25.9
25.9
64.1
74.2
27.6
23.8
6.7
5.3
27.3
24.7
4.7
4.0
Sun Pharma
Neutral
1,037
-
249,581
38,178
42,755
31.3
32.4
28.7
38.0
36.1
27.3
6.3
5.0
23.8
24.9
6.2
5.4
Power
Tata Power
Neutral
80
-
21,759
38,302
38,404
14.1
13.1
5.1
6.0
15.7
13.5
1.5
1.4
9.2
10.3
1.5
1.4
NTPC
Neutral
158
-
130,278
89,067
98,329
15.9
16.5
12.1
13.1
13.1
12.1
1.4
1.4
11.0
11.6
2.5
2.4
Power Grid
Accumulate
150
170
78,578
20,085
22,938
86.5
86.7
11.7
13.9
12.8
10.8
1.9
1.7
15.4
16.5
8.9
8.3
Telecom
Bharti Airtel
Neutral
406
-
162,314
101,748
109,191
32.1
31.7
12.0
12.5
33.8
32.5
2.3
2.2
6.9
6.7
2.2
2.0
Idea Cellular
Neutral
197
-
70,860
34,282
36,941
32.0
31.5
5.9
6.2
33.4
31.8
3.1
2.8
9.9
9.3
2.6
2.5
zOthers
Abbott India
Neutral
3,974
-
8,445
2,734
3,166
14.2
13.6
133.1
147.6
29.9
26.9
6.9
5.7
25.6
23.1
2.8
2.4
Bajaj Electricals
Buy
235
312
2,370
4,845
5,753
2.9
3.7
1.6
8.0
148.3
29.4
3.7
3.3
2.5
11.1
0.5
0.4
Cravatex
Neutral
476
-
123
-
0
-
-
-
-
-
-
Finolex Cables
Accumulate
270
298
4,136
2,760
3,089
12.0
12.1
17.5
19.9
15.5
13.6
2.8
2.4
17.8
17.4
1.3
1.1
Market Outlook
April 20, 2015
Stock Watch
Company Name
Reco
CMP
Target
Mkt Cap
Sales ( Čcr )
OPM(%)
EPS (Č)
PER(x)
P/BV(x)
RoE(%)
EV/Sales(x)
(Č)
Price ( Č)
( Č cr )
FY16E
FY17E
FY16E
FY17E
FY16E
FY17E
FY16E
FY17E
FY16E
FY17E
FY16E
FY17E
FY16E
FY17E
zOthers
Goodyear India*
Neutral
650
-
1,498
1,693
1,824
10.4
10.5
50.3
55.0
12.9
11.8
2.6
2.2
21.5
20.1
0.6
0.5
Hitachi
Neutral
1,441
-
3,919
1,684
1,986
9.1
9.2
29.9
37.7
48.2
38.2
10.2
8.1
23.5
23.6
2.3
1.9
Jyothy Laboratories
Neutral
265
-
4,794
1,891
0
17.8
-
10.6
-
25.0
4.3
18.7
-
2.5
MRF
Buy
41,040
47,548
17,406
13,878
14,970
18.5
18.8
3,031.2
3,396.3
13.5
12.1
3.0
2.4
25.0
22.2
1.3
1.1
Page Industries
Neutral
12,943
-
14,437
1,929
2,450
19.8
20.1
229.9
299.0
56.3
43.3
24.8
17.3
52.1
47.1
7.5
5.9
Relaxo Footwears
Neutral
724
-
4,344
1,767
2,152
12.7
-
20.0
-
36.3
9.1
28.6
-
2.5
2.0
Siyaram Silk Mills
Buy
950
1,102
891
1,649
1,855
11.6
11.9
97.6
122.4
9.7
7.8
1.8
1.5
19.6
20.7
0.7
0.6
Styrolution ABS India*
Accumulate
695
758
1,222
1,345
1,508
7.1
9.5
26.6
44.6
26.1
15.6
2.2
1.9
8.6
13.1
0.9
0.8
Tree House
Buy
400
472
1,692
259
313
60.3
60.5
18.6
23.6
21.5
17.0
2.4
2.1
11.0
12.5
6.4
5.3
TVS Srichakra
Accumulate
1,997
2,131
1,529
2,167
2,423
11.5
11.6
166.7
193.7
12.0
10.3
3.7
2.8
35.2
30.8
0.8
0.7
HSIL
Buy
449
554
3,244
2,349
2,702
20.8
20.6
29.6
37.0
15.2
12.1
1.9
1.7
12.8
14.0
1.5
1.2
Kirloskar Engines India
Accumulate
285
319
4,120
2,890
3,298
11.6
12.4
15.8
20.0
18.1
14.3
2.7
2.4
16.0
18.0
1.2
1.0
Ltd
M M Forgings
Neutral
689
-
831
586
671
22.7
23.0
54.2
65.1
12.7
10.6
2.7
2.2
23.9
23.0
1.5
1.3
ITD Cementation India
Neutral
739
-
1,147
2,200
2,728
9.0
9.2
19.8
46.0
37.4
16.1
1.9
1.7
5.2
10.7
0.9
0.7
Banco Products (India)
Accumulate
148
162
1,056
1,312
1,491
12.4
13.4
14.1
18.0
10.5
8.2
1.4
1.2
13.9
15.6
0.8
0.7
Competent Automobiles Neutral
119
-
73
986
1,078
3.0
3.3
24.9
27.9
4.8
4.3
0.7
0.6
14.7
14.4
0.1
0.1
Nilkamal
Buy
431
566
644
1,979
2,167
8.0
8.1
32.8
43.5
13.2
9.9
1.2
1.1
9.6
11.6
0.4
0.4
Visaka Industries
Buy
104
166
166
1,158
1,272
8.6
9.5
23.7
32.7
4.4
3.2
0.4
0.4
10.1
12.5
0.3
0.3
Transport Corporation of
Accumulate
256
293
1,936
2,830
3,350
8.8
9.0
14.4
18.3
17.8
14.0
2.7
2.4
15.4
17.1
0.8
0.7
India
Elecon Engineering
Buy
70
84
766
1,372
1,521
12.8
14.6
3.1
6.0
22.7
11.7
1.3
1.2
6.0
10.9
0.9
0.8
MT Educare
Buy
108
141
426
275
355
18.3
17.3
7.4
8.8
14.6
12.2
2.9
2.6
20.2
21.1
1.5
1.1
Source: Company, Angel Research; Note: *December year end; #September year end; &October year end; Price as on April 17, 2015
Market Outlook
April 20, 2015
Research Team Tel: 022 - 39357800
DISCLAIMER
Angel Broking Private Limited (hereinafter referred to as “Angel”) is a registered Member of National Stock Exchange of India Limited,
Bombay Stock Exchange Limited and MCX Stock Exchange Limited. It is also registered as a Depository Participant with CDSL and
Portfolio Manager with SEBI. It also has registration with AMFI as a Mutual Fund Distributor. Angel has received in-principal approval
from SEBI for registering as a Research Entity in terms of SEBI (Research Analyst) Regulations, 2014. Angel or its associates has not been
debarred/ suspended by SEBI or any other regulatory authority for accessing /dealing in securities Market. Angel or its associates
including its relatives/analyst do not hold any financial interest/beneficial ownership of more than 1% in the company covered by Analyst.
Angel or its associates/analyst has not received any compensation / managed or co-managed public offering of securities of the
company covered by Analyst during the past twelve months. Angel/analyst has not served as an officer, director or employee of company
covered by Analyst and has not been engaged in market making activity of the company covered by Analyst.
This document is solely for the personal information of the recipient, and must not be singularly used as the basis of any investment
decision. Nothing in this document should be construed as investment or financial advice. Each recipient of this document should make
such investigations as they deem necessary to arrive at an independent evaluation of an investment in the securities of the companies
referred to in this document (including the merits and risks involved), and should consult their own advisors to determine the merits and
risks of such an investment.
Reports based on technical and derivative analysis center on studying charts of a stock's price movement, outstanding positions and
trading volume, as opposed to focusing on a company's fundamentals and, as such, may not match with a report on a company's
fundamentals.
The information in this document has been printed on the basis of publicly available information, internal data and other reliable sources
believed to be true, but we do not represent that it is accurate or complete and it should not be relied on as such, as this document is for
general guidance only. Angel Broking Pvt. Limited or any of its affiliates/ group companies shall not be in any way responsible for any
loss or damage that may arise to any person from any inadvertent error in the information contained in this report. Angel Broking Pvt.
Limited has not independently verified all the information contained within this document. Accordingly, we cannot testify, nor make any
representation or warranty, express or implied, to the accuracy, contents or data contained within this document. While Angel Broking
Pvt. Limited endeavors to update on a reasonable basis the information discussed in this material, there may be regulatory, compliance,
or other reasons that prevent us from doing so.
This document is being supplied to you solely for your information, and its contents, information or data may not be reproduced,
redistributed or passed on, directly or indirectly.
Neither Angel Broking Pvt. Limited, nor its directors, employees or affiliates shall be liable for any loss or damage that may arise from or
in connection with the use of this information.
Note: Please refer to the important ‘Stock Holding Disclosure' report on the Angel website (Research Section). Also, please refer to the
latest update on respective stocks for the disclosure status in respect of those stocks. Angel Broking Pvt. Limited and its affiliates may have
investment positions in the stocks recommended in this report.