Market Outlook
November 16, 2016
Market Cues
Domestic Indices
Chg (%)
(Pts)
(Close)
Indian markets are likely to open positive tracking global cues and SGX Nifty.
BSE Sensex
(1.9)
(514)
26,305
Nifty
(2.3)
(188)
8,108
U.S. Markets closed higher on Tuesday, lifted by a sharp rally in energy stocks, while
Mid Cap
(3.9)
(487)
11,977
the technology sector rebounded after a post-election sell-off.
Small Cap
(4.7)
(583)
11,902
The European markets did not venture far from the unchanged level during
Bankex
(2.4)
(551)
22,053
Tuesdays session. The markets were stuck in a sideways trend for most of the session
and fluctuated between small gains and losses over the course of the day. The
Global Indices
Chg (%)
(Pts)
(Close)
majority of the markets ended the day with small gains
Dow Jones
0.3
54
18,923
Indian markets tumbled again Tuesday to extend last weeks steep losses as surging
Nasdaq
1.1
57
5,276
U.S. bond yields and the dollar's strength in international markets on expectations of
higher inflation and interest rates in the U.S. fueled worries about capital flight.
FTSE
0.6
40
6,793
Nikkei
(0.0)
(4)
17,668
News Analysis
Hang Seng
0.5
102
22,324
L&T Infotech bags 5-yr contract from Hartford Steam Boiler
Shanghai Com
(0.1)
(3)
3,207
Detailed analysis on Pg2
Investor’s Ready Reckoner
Advances / Declines
BSE
NSE
Advances
342
169
Key Domestic & Global Indicators
Declines
2,380
1,518
Stock Watch: Latest investment recommendations on 150+ stocks
Unchanged
111
26
Refer Pg5 onwards
Top Picks
Volumes (` Cr)
CMP
Target
Upside
Company
Sector
Rating
(`)
(`)
(%)
BSE
6,530
Amara Raja BatteriesAuto & Auto Ancill.
Buy
877
1,167
33.0
NSE
32,457
HCL Tech
IT
Buy
769
1,000
30.1
Asian Granito
Capital Goods
Buy
200
351
75.8
Net Inflows (` Cr)
Net
Mtd
Ytd
Equitas Holdings
Financials
Buy
150
235
57.0
Navkar Corporation Others
Buy
183
265
44.9
FII
(630)
(2,307)
42,707
More Top Picks on Pg3
MFs
634
3,628
25,681
Key Upcoming Events
Previous
Consensus
Top Gainers
Price (`)
Chg (%)
Date
Region
Event Description
Reading
Expectations
Corpbank
48
13.1
Nov 16 Germany GDP nsa (YoY)
1.50
1.60
Bankbaroda
174
8.5
Nov 16 UK
Jobless claims change
0.70
2.00
Nov 16 US
Producer Price Index (mom)
0.80
-
Suzlon
15
5.3
Nov 17 US
Initial Jobless claims
254.0
257.0
Natcopharm
650
5.1
Nov 17 US
Housing Starts
1,047.0
1,160.0
Bharatforg
894
3.6
Nov 17 US
Building permits
1,225.0
1,195.0
Nov 17 US
Consumer price index (mom)
0.30
0.40
Top Losers
Price (`)
Chg (%)
Nov 17 Euro Zone Euro-Zone CPI (YoY)
0.50
0.50
3.696.(
Manappuram
75
(16.6)
More Events on Pg4
Pcjeweller
355
(14.0)
Dcbbank
101
(13.8)
Shriramcit
1,800
(12.6)
Jisljaleqs
86
(12.1)
As on November 15, 2016
Market Outlook
November 16, 2016
News Analysis
L&T Infotech bags 5-yr contract from Hartford Steam Boiler
IT services and solutions provider L&T Infotech announced that it has been
awarded a five-year contract by Hartford Steam Boiler (HSB), a specialty insurer
with 150 years of industry leadership in equipment breakdown insurance and a
subsidiary of Munich Re. The financial details of the contract were not disclosed. A
key objective of this engagement is to deliver innovation & efficiency improvements
through transitioning management of over 100 applications to a managed
services model enabling HSB to manage by outcomes with an SLA driven
approach.
Supporting a wide variety of legacy and modern technologies such as MS
Dynamics, PeopleSoft, MS SharePoint, .NET, Cognos, among others. Providing
applications maintenance services like monitoring, incident management, problem
management and enhancement services like assurance, release management and
deployment Process, platform and architecture standardization including
application decommissioning. Core business areas covered as part of the
engagement include policy administration, claims, engineering, reporting,
financial systems, and underwriting.
There are other opportunities available to HSB including LTI's automation platform,
MOSAIC Automation to deliver substantial digital platform opportunities focused
on generating revenue and cost reduction, said the company.
Economic and Political News
Andhra Pradesh to buy 1 million set-top boxes for households
Petrol price cut by `1.46, diesel by `1.53 per litre
Govt hikes wheat MSP by `100/qtl; pulses by up to `550/qtl
WPI Inflation cools down to 4-month low of 3.39% in October
Corporate News
Maruti to set up manufacturing institute in Gujarat
Reliance Group launches IoT services venture 'UNLIMIT'
BHEL bags export orders from Togo, Benin
Market Outlook
November 16, 2016
Top Picks ★★★★★
Large Cap
Market Cap
CMP
Target
Upside
Company
Rationale
(` Cr)
(`)
(`)
(%)
To outpace battery industry growth due to better technological
Amara Raja Batteries
14,984
877
1,167
33.0
products leading to market share gains in both the
automotive OEM and replacement segments.
The stock is trading at attractive valuations and is factoring all
HCL Tech
1,08,417
769
1,000
30.1
the bad news.
Back on the growth trend, expect a long term growth of 14%
Infosys
2,12,410
925
1,249
35.0
to be a US$20bn in FY2020.
Source: Company, Angel Research
Mid Cap
Market Cap
CMP
Target
Upside
Company
Rationale
(` Cr)
(`)
(`)
(%)
We expect the company would report strong profitability
Asian Granito
601
200
351
75.8
owing to better product mix, higher B2C sales and
amalgamation synergy.
Among the top 4 players in the consumer durables segment.
Bajaj Electricals
2,178
216
306
42.0
Improved profitability backed by turn around in E&P segment.
Strong order book lends earnings visibility.
Favourable outlook for the AC industry to augur well for
Cooling products business which is out pacing the market
Blue Star
4,550
477
634
32.9
growth. EMPPAC division's profitability to improve once
operating environment turns around.
With a focus on the low and medium income (LMI) consumer
Dewan Housing Finance
7,583
242
350
44.5
segment, the company has increased its presence in tier-II &
III cities where the growth opportunity is immense.
Strong loan growth backed by diversified loan portfolio and
Equitas Holdings
5,019
150
235
57.0
adequate CAR. ROE & ROA likely to remain decent as risk of
dilution remains low. Attractive valuations considering growth.
Economic recovery to have favourable impact on advertising
& circulation revenue growth. Further, the acquisition of a
Jagran Prakashan
5,832
178
225
26.1
radio business (Radio City) would also boost the company's
revenue growth.
Speedier execution and speedier sales, strong revenue visibilty
Mahindra Lifespace
1,530
373
522
40.0
in short-to-long run, attractive valuations
We expect the company to report strong growth on back of
healthy growth in domestic branded sales (owing to
Mirza International
965
80
113
40.9
aggressive ad spend and addition in the number of EBOs &
multi-brand outlets [MBOs]) and healthy export revenues.
Massive capacity expansion along with rail advantage at ICD
Navkar Corporation
2,608
183
265
44.9
as well CFS augurs well for the company.
Strong brands and distribution network would boost growth
Siyaram Silk Mills
1,155
1,232
1,714
39.1
going ahead. Stock currently trades at an inexpensive
valuation.
Market leadership in Hindi news genre and no. 2 viewership
ranking in English news genre, exit from the radio business,
TV Today Network
1,786
299
385
28.6
and anticipated growth in ad spends by corporates to benefit
the stock.
Source: Company, Angel Research
Market Outlook
November 16, 2016
Key Upcoming Events
Result Calendar
Date
Company
November 17, 2016 Petronet LNG
November 18, 2016 NHPC
November 19, 2016 India Cements
November 21, 2016 Nalco
Source: Bloomberg, Angel Research
Global economic events release calendar
Bloomberg Data
Date
Time
Country
Event Description
Unit
Period
Last Reported
Estimated
Nov 16, 2016
12:30 PM Germany
GDP nsa (YoY)
% Change 3Q P
1.50
1.60
3:00 PM
UK
Jobless claims change
% Change Oct
0.70
2.00
US
Producer Price Index (mom)
% Change Oct
0.80
Nov 17, 2016
7:00 PM
US
Initial Jobless claims
ThousandsNov 12
254.00
257.00
7:00 PM
US
Housing Starts
Thousands Oct
1,047.00
1,160.00
7:00 PM
US
Building permits
Thousands Oct
1,225.00
1,195.00
7:00 PM
US Consumer price index (mom)
% Change Oct
0.30
0.40
3:30 PM Euro Zone
Euro-Zone CPI (YoY)
% Oct F
0.50
0.50
Nov 22, 2016
8:30 PM Euro ZoneEuro-Zone Consumer Confidence
Value Nov A
(8.00)
8:30 PM
US
Existing home sales
Million
Oct
5.47
5.45
Nov 23, 2016
2:00 PM Germany
PMI Services
Value Nov P
54.20
8:30 PM
US
New home sales
Thousands Oct
593.00
587.50
2:00 PM Germany
PMI Manufacturing
Value Nov P
55.00
Nov 25, 2016
3:00 PM
UK
GDP (YoY)
% Change 3Q P
2.30
Nov 29, 2016
7:00 PM
US
GDP Qoq (Annualised)
% Change 3Q S
2.90
8:30 PM
US
Consumer Confidence S.A./ 1985=100 Nov
98.60
Nov 30, 2016
2:25 PM Germany Unemployment change (000's)
Thousands Nov
(13.00)
Dec 01, 2016
3:00 PM
UK
PMI Manufacturing
Value Nov
54.30
6:30 AM
China
PMI Manufacturing
Value Nov
51.20
Dec 02, 2016
7:00 PM
US
Change in Nonfarm payrolls
Thousands Nov
161.00
7:00 PM
US
Unnemployment rate
% Nov
4.90
Source: Bloomberg, Angel Research
Market Outlook
November 16, 2016
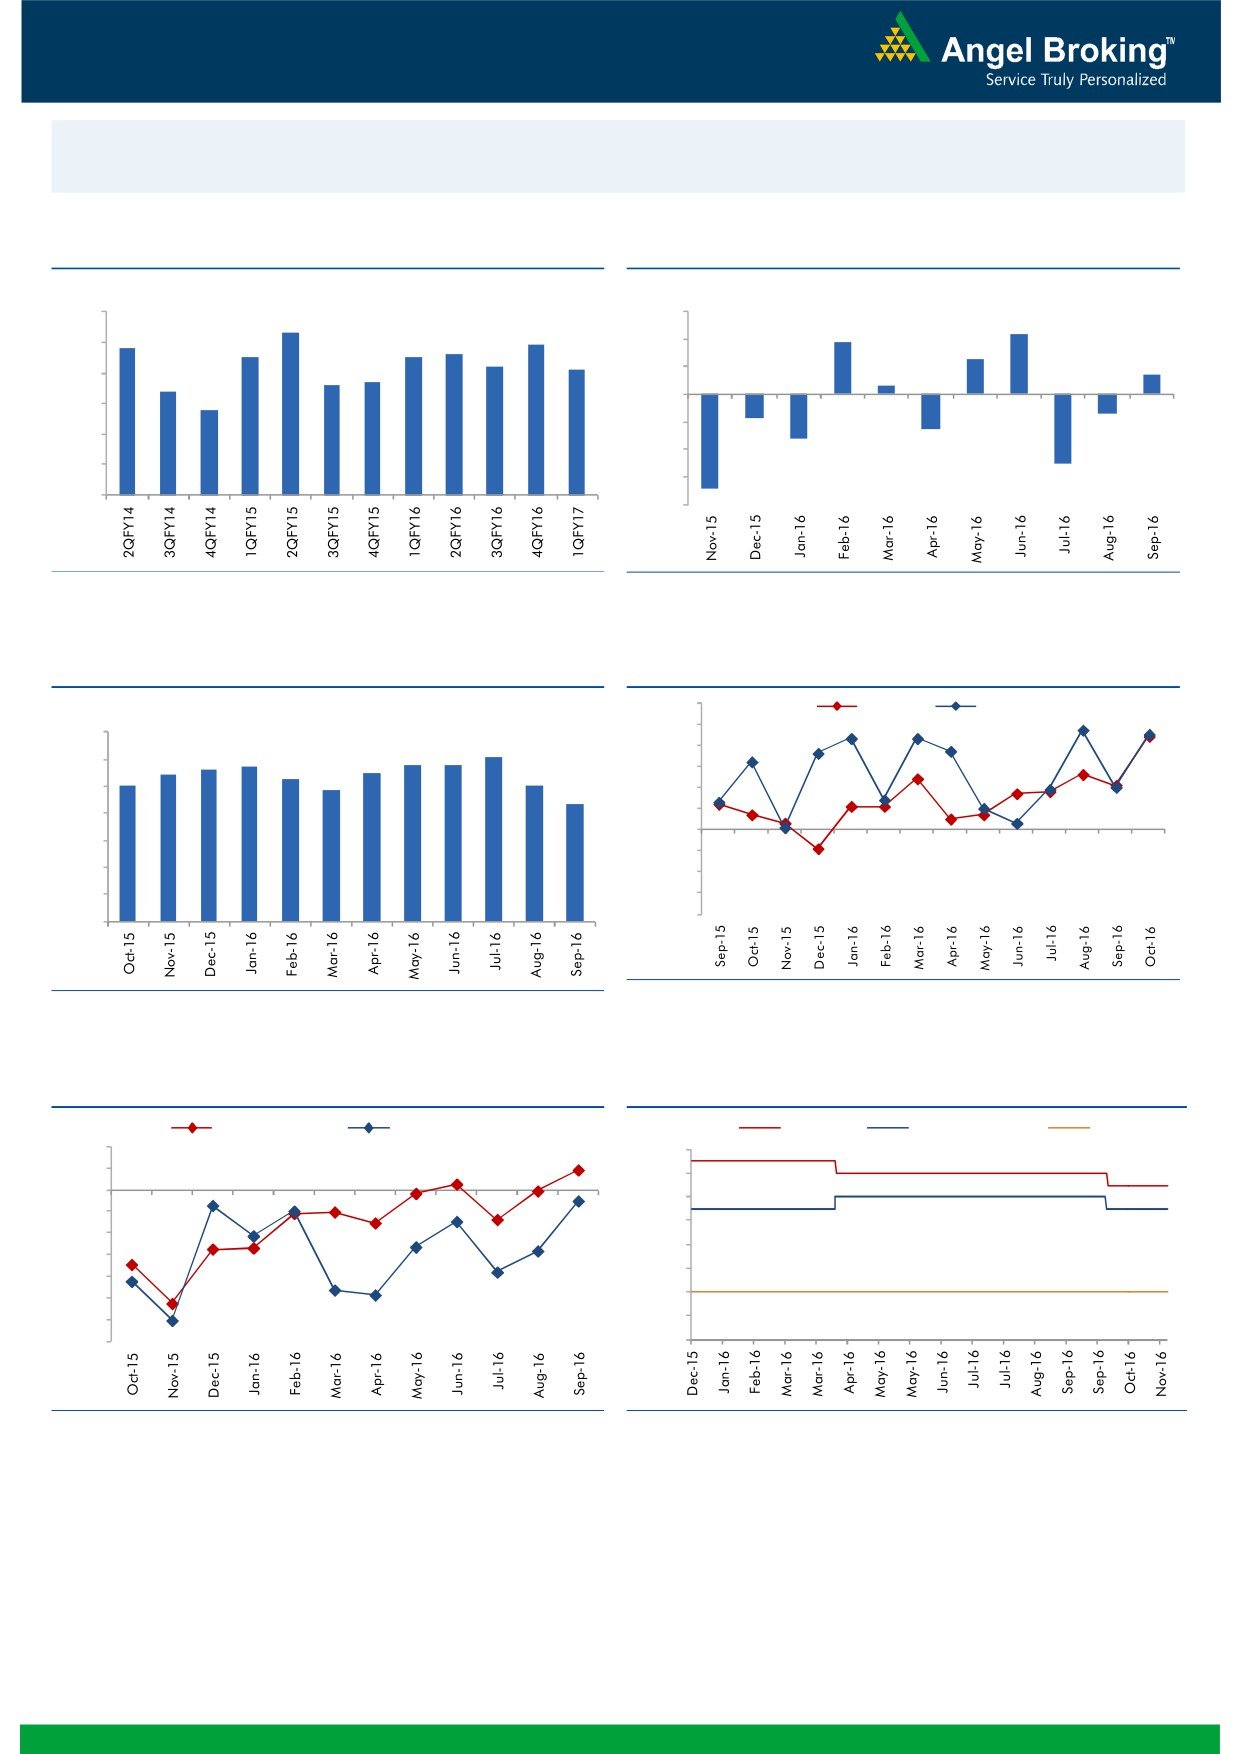
Macro watch
Exhibit 1: Quarterly GDP trends
Exhibit 2: IIP trends
(%)
(%)
9.0
8.3
3.0
2.2
7.8
7.9
1.9
8.0
7.5
7.5
7.6
2.0
1.3
7.2
7.1
0.7
6.6
6.7
1.0
0.3
7.0
6.4
5.8
-
6.0
(1.0)
5.0
(0.9)
(0.7)
(2.0)
(1.3)
(1.6)
4.0
(3.0)
(2.5)
3.0
(4.0)
(3.4)
Source: CSO, Angel Research
Source: MOSPI, Angel Research
Exhibit 3: Monthly CPI inflation trends
Exhibit 4: Manufacturing and services PMI
56.0
Mfg. PMI
Services PMI
(%)
55.0
7.0
6.1
5.7
5.8
5.8
54.0
5.6
5.5
6.0
5.4
5.3
5.0
5.1
53.0
4.8
5.0
4.3
52.0
4.0
51.0
50.0
3.0
49.0
2.0
48.0
1.0
47.0
46.0
-
Source: Market, Angel Research; Note: Level above 50 indicates expansion
Source: MOSPI, Angel Research
Exhibit 5: Exports and imports growth trends
Exhibit 6: Key policy rates
(%)
Exports yoy growth
Imports yoy growth
(%)
Repo rate
Reverse Repo rate
CRR
10.0
7.00
5.0
6.50
0.0
6.00
(5.0)
5.50
(10.0)
5.00
(15.0)
4.50
(20.0)
4.00
(25.0)
(30.0)
3.50
(35.0)
3.00
Source: Bloomberg, Angel Research
Source: RBI, Angel Research
Market Outlook
November 16, 2016
Global watch
Exhibit 1: Latest quarterly GDP Growth (%, yoy) across select developing and developed countries
(%)
8.0
6.7
6.0
5.3
0.6
5.0
4.3
3.5
4.0
2.3
1.5
1.5
2.0
1.1
0.9
-
(2.0)
(0.4)
(4.0)
(3.8)
(6.0)
Source: Bloomberg, Angel Research
Exhibit 2: 2016 GDP Growth projection by IMF (%, yoy) across select developing and developed countries
(%)
10.0
7.6
8.0
6.6
6.0
4.9
4.3
4.0
3.2
1.8
1.7
1.6
2.0
1.3
(0.8)
0.5
(3.3)
0.1
-
(2.0)
(4.0)
Source: IMF, Angel Research
Exhibit 3: One year forward P-E ratio across select developing and developed countries
(x)
18.0
16.0
14.0
12.0
10.0
8.0
6.0
4.0
2.0
-
Source: IMF, Angel Research
Market Outlook
November 16, 2016
Exhibit 4: Relative performance of indices across globe
Returns (%)
Country
Name of index
Closing price
1M
3M
1YR
Brazil
Bovespa
59,657
(2.2)
2.3
29.1
Russia
Micex
2,017
2.1
2.1
16.7
India
Nifty
8,108
(5.4)
(6.6)
1.9
China
Shanghai Composite
3,207
5.4
6.0
(10.7)
South Africa
Top 40
43,088
(3.5)
(5.1)
(6.3)
Mexico
Mexbol
45,024
(5.7)
(7.5)
1.2
Indonesia
LQ45
849
(8.1)
(7.1)
9.4
Malaysia
KLCI
1,631
(1.7)
(2.9)
(3.3)
Thailand
SET 50
920
1.5
(6.3)
(0.2)
USA
Dow Jones
18,923
4.3
2.0
8.2
UK
FTSE
6,793
(3.1)
(1.5)
8.2
Japan
Nikkei
17,668
5.3
5.6
(7.6)
Germany
DAX
10,735
1.5
0.5
(2.1)
France
CAC
4,537
1.5
2.7
(5.9)
Source: Bloomberg, Angel Research
Stock Watch
November 16, 2016
Company Name
Reco
CMP
Target
Mkt Cap
Sales ( Čcr )
OPM(%)
EPS (Č)
PER(x)
P/BV(x)
RoE(%)
EV/Sales(x)
(Č)
Price ( Č)
( Č cr )
FY17E FY18E
FY17E
FY18E
FY17E
FY18E
FY17E
FY18E
FY17E
FY18E
FY17E
FY18E
FY17E
FY18E
Agri / Agri Chemical
Rallis
Accumulate
191
209
3,712
1,937
2,164
13.3
14.3
9.0
11.0
21.2
17.4
3.7
3.2
18.4
19.8
2.0
1.7
United Phosphorus
Accumulate
602
684
30,501
15,176
17,604
18.5
18.5
37.4
44.6
16.1
13.5
3.2
2.6
21.4
21.2
2.1
1.8
Auto & Auto Ancillary
Ashok Leyland
Buy
83
111
23,521
22,407
26,022
10.6
10.6
5.2
6.4
15.8
12.9
3.6
3.0
23.6
24.7
1.1
1.0
Bajaj Auto
Neutral
2,576
-
74,534
25,093
27,891
19.5
19.2
143.9
162.5
17.9
15.9
5.0
4.3
30.3
29.4
2.7
2.4
Bharat Forge
Neutral
894
-
20,803
7,726
8,713
20.5
21.2
35.3
42.7
25.3
20.9
4.7
4.2
18.9
20.1
2.8
2.4
Eicher Motors
Neutral
20,281
-
55,086
16,583
20,447
17.5
18.0
598.0
745.2
33.9
27.2
11.6
8.8
41.2
38.3
3.1
2.5
Gabriel India
Buy
108
130
1,552
1,544
1,715
9.0
9.3
5.4
6.3
20.0
17.2
3.8
3.4
18.9
19.5
1.0
0.8
Hero Motocorp
Buy
2,901
3,541
57,923
30,958
34,139
15.7
15.7
193.6
208.3
15.0
13.9
5.9
4.8
34.2
30.5
1.7
1.5
Jamna Auto Industries Neutral
178
-
1,420
1,486
1,620
9.8
9.9
15.0
17.2
11.9
10.3
2.6
2.2
21.8
21.3
1.0
0.9
L G Balakrishnan & Bros Neutral
570
-
895
1,302
1,432
11.6
11.9
43.7
53.0
13.1
10.8
1.8
1.7
13.8
14.2
0.8
0.7
Mahindra and Mahindra Neutral
1,238
-
76,901
46,534
53,077
11.6
11.7
67.3
78.1
18.4
15.9
3.0
2.6
15.4
15.8
1.6
1.4
Maruti
Buy
4,843
6,006
146,288
68,057
82,958
15.8
15.5
212.1
261.2
22.8
18.5
4.5
3.8
19.8
20.3
1.8
1.4
Minda Industries
Neutral
314
-
2,488
2,728
3,042
9.0
9.1
68.2
86.2
4.6
3.6
1.0
0.8
23.8
24.3
1.0
0.8
Motherson Sumi
Neutral
286
-
40,109
45,896
53,687
7.8
8.3
13.0
16.1
21.9
17.8
7.1
5.6
34.7
35.4
0.9
0.8
Rane Brake Lining
Neutral
868
-
687
511
562
11.3
11.5
28.1
30.9
30.9
28.1
4.7
4.3
15.3
15.0
1.5
1.4
Setco Automotive
Neutral
38
-
508
741
837
13.0
13.0
15.2
17.0
2.5
2.2
0.4
0.4
15.8
16.3
1.1
1.0
Tata Motors
Neutral
457
-
132,017
300,209
338,549
8.9
8.4
42.7
54.3
10.7
8.4
1.7
1.5
15.6
17.2
0.6
0.5
TVS Motor
Neutral
348
-
16,514
13,390
15,948
6.9
7.1
12.8
16.5
27.2
21.0
6.8
5.4
26.3
27.2
1.3
1.0
Amara Raja Batteries
Buy
877
1,167
14,984
5,504
6,605
18.4
19.8
33.4
40.9
26.3
21.5
5.8
4.7
22.1
22.0
2.7
2.3
Exide Industries
Neutral
173
-
14,705
7,439
8,307
15.0
15.0
8.1
9.3
21.4
18.6
3.0
2.7
14.3
16.7
1.6
1.4
Apollo Tyres
Buy
186
235
9,486
12,877
14,504
14.3
13.9
21.4
23.0
8.7
8.1
1.4
1.2
16.4
15.2
0.9
0.8
Ceat
Buy
1,232
1,450
4,983
7,524
8,624
13.0
12.7
131.1
144.3
9.4
8.5
1.7
1.5
19.8
18.6
0.7
0.6
JK Tyres
Neutral
124
-
2,803
7,455
8,056
15.0
15.0
21.8
24.5
5.7
5.0
1.2
1.0
22.8
21.3
0.5
0.4
Swaraj Engines
Neutral
1,303
-
1,618
660
810
15.2
16.4
54.5
72.8
23.9
17.9
7.5
6.8
31.5
39.2
2.3
1.8
Subros
Neutral
142
-
854
1,488
1,681
11.7
11.9
6.4
7.2
22.3
19.9
2.4
2.1
10.8
11.4
0.8
0.7
Indag Rubber
Neutral
167
-
438
286
326
19.8
16.8
11.7
13.3
14.3
12.5
2.4
2.3
17.8
17.1
1.2
1.0
Capital Goods
ACE
Neutral
45
-
441
709
814
4.1
4.6
1.4
2.1
31.9
21.2
1.3
1.2
4.4
6.0
0.8
0.7
BEML
Neutral
863
-
3,595
3,451
4,055
6.3
9.2
31.4
57.9
27.5
14.9
1.7
1.5
6.3
10.9
1.2
1.0
Bharat Electronics
Accumulate
1,289
1,414
30,943
8,137
9,169
16.8
17.2
58.7
62.5
22.0
20.6
3.4
3.0
44.6
46.3
2.8
2.5
Stock Watch
November 16, 2016
Company Name
Reco
CMP
Target
Mkt Cap
Sales ( Čcr )
OPM(%)
EPS (Č)
PER(x)
P/BV(x)
RoE(%)
EV/Sales(x)
(Č)
Price ( Č)
( Č cr )
FY17E
FY18E
FY17E
FY18E
FY17E
FY18E
FY17E
FY18E
FY17E
FY18E
FY17E
FY18E
FY17E
FY18E
Capital Goods
Voltas
Buy
321
407
10,635
6,511
7,514
7.9
8.7
12.9
16.3
24.9
19.7
4.5
3.9
16.7
18.5
1.4
1.2
BGR Energy
Neutral
106
-
767
16,567
33,848
6.0
5.6
7.8
5.9
13.6
18.0
0.8
0.8
4.7
4.2
0.1
0.1
BHEL
Neutral
134
-
32,761
28,797
34,742
-
2.8
2.3
6.9
58.2
19.4
1.0
1.0
1.3
4.8
0.8
0.5
Blue Star
Buy
477
634
4,550
4,283
5,077
5.9
7.3
14.9
22.1
32.1
21.6
6.2
5.2
20.4
26.4
1.1
0.9
Crompton Greaves
Neutral
75
-
4,723
5,777
6,120
5.9
7.0
3.3
4.5
22.8
16.7
1.0
1.0
4.4
5.9
0.8
0.7
Greaves Cotton
Neutral
126
-
3,071
1,755
1,881
16.8
16.9
7.8
8.5
16.1
14.8
3.2
3.0
20.6
20.9
1.4
1.3
Inox Wind
Neutral
186
-
4,119
5,605
6,267
15.7
16.4
24.8
30.0
7.5
6.2
2.1
1.5
25.9
24.4
0.8
0.6
KEC International
Neutral
138
-
3,545
9,294
10,186
7.9
8.1
9.9
11.9
13.9
11.6
2.0
1.8
15.6
16.3
0.6
0.6
Thermax
Neutral
850
-
10,129
5,421
5,940
7.3
7.3
25.7
30.2
33.1
28.2
4.0
3.7
12.2
13.1
1.8
1.6
VATech Wabag
Buy
497
681
2,709
3,136
3,845
8.9
9.1
26.0
35.9
19.1
13.8
2.4
2.0
13.4
15.9
0.8
0.6
Cement
ACC
Neutral
1,347
-
25,287
11,225
13,172
13.2
16.9
44.5
75.5
30.3
17.8
2.9
2.6
11.2
14.2
2.3
1.9
Ambuja Cements
Neutral
210
-
41,689
9,350
10,979
18.2
22.5
5.8
9.5
36.2
22.1
3.0
2.7
10.2
12.5
4.5
3.8
India Cements
Neutral
119
-
3,646
4,364
4,997
18.5
19.2
7.9
11.3
15.0
10.5
1.1
1.1
8.0
8.5
1.6
1.4
JK Cement
Neutral
788
-
5,511
4,398
5,173
15.5
17.5
31.2
55.5
25.3
14.2
3.0
2.6
12.0
15.5
1.8
1.5
J K Lakshmi Cement
Buy
381
565
4,479
2,913
3,412
14.5
19.5
7.5
22.5
50.8
16.9
3.1
2.6
12.5
18.0
2.1
1.8
Orient Cement
Buy
139
215
2,855
2,114
2,558
18.5
20.5
8.1
11.3
17.2
12.3
2.5
2.1
9.0
14.0
2.0
1.5
UltraTech Cement
Neutral
3,367
-
92,411
25,768
30,385
21.0
23.5
111.0
160.0
30.3
21.1
3.9
3.4
13.5
15.8
3.7
3.1
Construction
ITNL
Neutral
92
-
3,022
8,946
10,017
31.0
31.6
8.1
9.1
11.3
10.1
0.4
0.4
4.2
5.0
3.7
3.4
KNR Constructions
Buy
696
802
1,959
1,385
1,673
14.7
14.0
41.2
48.5
16.9
14.4
3.2
2.7
14.9
15.2
1.5
1.2
Larsen & Toubro
Buy
1,370
1,700
127,671
67,665
77,249
10.7
11.5
57.3
71.2
23.9
19.2
2.2
2.1
12.6
14.3
2.1
1.8
Gujarat Pipavav Port
Neutral
147
-
7,116
705
788
52.2
51.7
5.0
5.6
29.4
26.3
2.9
2.6
11.2
11.2
9.7
8.2
Nagarjuna Const.
Neutral
75
-
4,183
8,842
9,775
9.1
8.8
5.3
6.4
14.2
11.8
1.1
1.0
8.2
9.1
0.6
0.5
PNC Infratech
Buy
111
143
2,842
2,350
2,904
13.1
13.2
9.0
8.8
12.3
12.6
0.5
0.4
15.9
13.9
1.3
1.1
Simplex Infra
Neutral
302
-
1,492
6,829
7,954
10.5
10.5
31.4
37.4
9.6
8.1
1.0
0.9
9.9
13.4
0.6
0.5
Power Mech Projects
Neutral
436
-
642
1,801
2,219
12.7
14.6
72.1
113.9
6.1
3.8
1.1
0.9
16.8
11.9
0.4
0.3
Sadbhav Engineering
Accumulate
280
298
4,797
3,598
4,140
10.3
10.6
9.0
11.9
31.1
23.5
3.3
2.9
9.9
11.9
1.6
1.4
NBCC
Neutral
223
-
13,350
7,428
9,549
7.9
8.6
8.2
11.0
27.1
20.2
1.4
1.1
28.2
28.7
1.5
1.1
MEP Infra
Neutral
35
-
563
1,877
1,943
30.6
29.8
3.0
4.2
11.6
8.3
5.6
3.8
0.6
0.6
1.7
1.5
SIPL
Neutral
92
-
3,237
1,036
1,252
65.5
66.2
(8.4)
(5.6)
3.4
3.9
(22.8)
(15.9)
11.3
9.4
Stock Watch
November 16, 2016
Company Name
Reco
CMP
Target
Mkt Cap
Sales ( Čcr )
OPM(%)
EPS (Č)
PER(x)
P/BV(x)
RoE(%)
EV/Sales(x)
(Č)
Price ( Č)
( Č cr )
FY17E
FY18E
FY17E
FY18E
FY17E
FY18E
FY17E
FY18E
FY17E
FY18E
FY17E
FY18E
FY17E
FY18E
Construction
Engineers India
Neutral
257
-
8,661
1,725
1,935
16.0
19.1
11.4
13.9
22.6
18.5
3.1
3.0
13.4
15.3
4.0
3.5
Financials
Axis Bank
Buy
479
630
114,362
46,932
53,575
3.5
3.4
32.4
44.6
14.8
10.7
1.9
1.7
13.6
16.5
-
-
Bank of Baroda
Neutral
174
-
40,173
19,980
23,178
1.8
1.8
11.5
17.3
15.2
10.1
1.7
1.4
8.3
10.1
-
-
Canara Bank
Neutral
316
-
17,153
15,225
16,836
1.8
1.8
14.5
28.0
21.8
11.3
1.5
1.2
5.8
8.5
-
-
Dewan Housing Finance Buy
242
350
7,583
2,225
2,688
2.9
2.9
29.7
34.6
8.2
7.0
1.3
1.1
16.1
16.8
-
-
Equitas Holdings
Buy
150
235
5,019
939
1,281
11.7
11.5
5.8
8.2
25.8
18.3
2.2
2.0
10.9
11.5
-
-
Federal Bank
Neutral
74
-
12,689
9,353
10,623
2.9
2.9
4.4
5.8
16.8
12.7
1.6
1.4
9.5
11.0
-
-
HDFC
Neutral
1,226
-
193,858
11,475
13,450
3.4
3.4
45.3
52.5
27.1
23.4
5.2
4.6
20.2
20.5
-
-
HDFC Bank
Accumulate
1,255
1,350
317,797
46,097
55,433
4.5
4.5
58.4
68.0
21.5
18.5
3.8
3.2
18.8
18.6
-
-
ICICI Bank
Buy
269
315
156,710
42,800
44,686
3.1
3.3
18.0
21.9
15.0
12.3
2.0
1.9
11.1
12.3
-
-
LIC Housing Finance
Buy
480
630
24,226
3,712
4,293
2.6
2.5
39.0
46.0
12.3
10.4
2.3
2.0
19.9
20.1
-
-
Punjab Natl.Bank
Neutral
155
-
32,888
23,532
23,595
2.3
2.4
6.8
12.6
22.7
12.3
3.5
2.5
3.3
6.5
-
-
RBL Bank
Neutral
364
-
13,448
1,783
2,309
2.6
2.6
12.7
16.4
28.6
22.2
3.1
2.8
12.8
13.3
-
-
South Ind.Bank
Neutral
23
-
3,052
6,435
7,578
2.5
2.5
2.7
3.1
8.4
7.3
1.1
0.9
10.1
11.2
-
-
St Bk of India
Neutral
278
-
215,883
88,650
98,335
2.6
2.6
13.5
18.8
20.6
14.8
2.0
1.7
7.0
8.5
-
-
Union Bank
Neutral
148
-
10,164
13,450
14,925
2.3
2.3
25.5
34.5
5.8
4.3
0.8
0.7
7.5
10.2
-
-
Yes Bank
Neutral
1,159
-
48,787
8,978
11,281
3.3
3.4
74.0
90.0
15.7
12.9
3.0
2.5
17.0
17.2
-
-
FMCG
Asian Paints
Neutral
892
-
85,580
17,128
18,978
16.8
16.4
19.1
20.7
46.7
43.1
16.3
15.3
34.8
35.5
4.9
4.4
Britannia
Buy
2,920
3,626
35,034
9,795
11,040
14.6
14.9
80.3
94.0
36.4
31.1
15.0
11.6
41.2
-
3.4
3.0
Colgate
Accumulate
914
995
24,857
4,605
5,149
23.4
23.4
23.8
26.9
38.4
34.0
21.3
16.6
64.8
66.8
5.3
4.7
Dabur India
Accumulate
270
304
47,558
8,315
9,405
19.8
20.7
8.1
9.2
33.4
29.4
9.3
7.7
31.6
31.0
5.4
4.7
GlaxoSmith Con*
Neutral
5,025
-
21,134
4,350
4,823
21.2
21.4
179.2
196.5
28.0
25.6
7.5
6.3
27.1
26.8
4.2
3.7
Godrej Consumer
Neutral
1,354
-
46,112
10,235
11,428
18.4
18.6
41.1
44.2
33.0
30.6
7.3
6.2
24.9
24.8
4.6
4.0
HUL
Neutral
805
-
174,265
35,252
38,495
17.8
17.8
20.7
22.4
39.0
36.0
37.3
32.0
95.6
88.9
4.8
4.4
ITC
Buy
238
284
286,923
40,059
44,439
38.3
39.2
9.0
10.1
26.5
23.5
7.4
6.5
27.8
27.5
6.7
6.0
Marico
Buy
240
300
30,919
6,430
7,349
18.8
19.5
6.4
7.7
37.5
31.1
11.3
9.5
33.2
32.5
4.6
4.0
Nestle*
Neutral
5,980
-
57,658
10,073
11,807
20.7
21.5
124.8
154.2
47.9
38.8
19.7
17.7
34.8
36.7
5.5
4.7
Tata Global
Neutral
117
-
7,384
8,675
9,088
9.8
9.8
7.4
8.2
15.8
14.3
1.8
1.7
7.9
8.1
0.8
0.7
Procter & Gamble
Accumulate
6,725
7,369
21,830
2,939
3,342
23.2
23.0
146.2
163.7
46.0
41.1
103.0
98.8
25.3
23.5
7.0
6.1
Hygiene
Stock Watch
November 16, 2016
Company Name
Reco
CMP
Target
Mkt Cap
Sales ( Čcr )
OPM(%)
EPS (Č)
PER(x)
P/BV(x)
RoE(%)
EV/Sales(x)
(Č)
Price ( Č)
( Č cr )
FY17E FY18E
FY17E
FY18E
FY17E
FY18E
FY17E
FY18E
FY17E
FY18E
FY17E
FY18E
FY17E
FY18E
IT
HCL Tech^
Buy
769
1,000
108,417
49,242
57,168
20.5
20.5
55.7
64.1
13.8
12.0
2.8
2.2
20.3
17.9
2.1
1.7
Infosys
Buy
925
1,249
212,410
68,350
77,326
27.0
27.0
62.5
69.4
14.8
13.3
3.2
2.9
21.3
21.6
2.6
2.2
TCS
Buy
2,122
2,620
418,145
119,025
133,308
27.6
27.6
131.2
145.5
16.2
14.6
5.2
4.8
32.4
33.1
3.3
2.9
Tech Mahindra
Buy
431
600
41,827
29,673
32,937
15.5
17.0
32.8
39.9
13.1
10.8
2.6
2.2
19.6
20.7
1.2
1.0
Wipro
Buy
448
590
108,909
55,440
60,430
18.1
18.1
35.9
39.9
12.5
11.2
2.2
2.1
19.0
19.3
1.7
1.5
Media
D B Corp
Neutral
370
-
6,797
2,297
2,590
27.4
28.2
21.0
23.4
17.6
15.8
4.1
3.6
23.7
23.1
2.8
2.4
HT Media
Neutral
75
-
1,746
2,693
2,991
12.6
12.9
7.9
9.0
9.5
8.3
0.8
0.7
7.8
8.3
0.2
0.1
Jagran Prakashan
Buy
178
225
5,832
2,355
2,635
28.0
28.0
10.8
12.5
16.5
14.3
3.6
3.1
21.7
21.7
2.5
2.2
Sun TV Network
Neutral
489
-
19,265
2,850
3,265
70.1
71.0
26.2
30.4
18.7
16.1
4.8
4.2
24.3
25.6
6.4
5.4
Hindustan Media
Neutral
270
-
1,981
1,016
1,138
24.3
25.2
27.3
30.1
9.9
9.0
1.9
1.7
16.2
15.8
1.3
1.1
Ventures
TV Today Network
Buy
299
385
1,786
637
743
27.5
27.5
18.4
21.4
16.3
14.0
2.8
2.4
17.4
17.2
2.4
2.0
Metals & Mining
Coal India
Neutral
315
-
198,681
84,638
94,297
21.4
22.3
24.5
27.1
12.8
11.6
5.3
5.1
42.6
46.0
1.9
1.7
Hind. Zinc
Neutral
239
-
100,922
14,252
18,465
55.9
48.3
15.8
21.5
15.1
11.1
2.5
2.2
17.0
20.7
7.1
5.5
Hindalco
Neutral
168
-
34,743
107,899
112,095
7.4
8.2
9.2
13.0
18.3
12.9
0.9
0.8
4.8
6.6
0.8
0.8
JSW Steel
Neutral
1,692
-
40,903
53,201
58,779
16.1
16.2
130.6
153.7
13.0
11.0
1.7
1.5
14.0
14.4
1.5
1.3
NMDC
Neutral
118
-
37,334
6,643
7,284
44.4
47.7
7.1
7.7
16.6
15.3
1.4
1.4
8.8
9.2
3.4
3.0
SAIL
Neutral
50
-
20,671
47,528
53,738
(0.7)
2.1
(1.9)
2.6
19.3
0.5
0.5
(1.6)
3.9
1.3
1.2
Vedanta
Neutral
210
-
62,125
71,744
81,944
19.2
21.7
13.4
20.1
15.6
10.4
1.3
1.2
8.4
11.3
1.3
1.0
Tata Steel
Neutral
394
-
38,222
121,374
121,856
7.2
8.4
18.6
34.3
21.2
11.5
1.3
1.2
6.1
10.1
1.0
0.9
Oil & Gas
Cairn India
Neutral
233
-
43,731
9,127
10,632
4.3
20.6
8.8
11.7
26.5
19.9
0.9
0.8
3.3
4.2
6.3
5.2
GAIL
Neutral
436
-
55,299
56,220
65,198
9.3
10.1
27.1
33.3
16.1
13.1
1.5
1.4
9.3
10.7
1.2
1.0
ONGC
Neutral
276
-
235,960
137,222
152,563
15.0
21.8
19.5
24.1
14.1
11.4
1.2
1.1
8.5
10.1
2.0
1.8
Indian Oil Corp
Neutral
286
-
138,782
373,359
428,656
5.9
5.5
54.0
59.3
5.3
4.8
0.8
0.7
16.0
15.6
0.5
0.4
Reliance Industries
Neutral
988
-
320,224
301,963
358,039
12.1
12.6
87.7
101.7
11.3
9.7
1.2
1.1
10.7
11.3
1.5
1.3
Pharmaceuticals
Alembic Pharma
Neutral
631
-
11,886
3,483
4,083
20.2
21.4
24.3
30.4
26.0
20.7
5.9
4.7
25.5
25.3
3.4
2.8
Aurobindo Pharma
Buy
733
877
42,890
15,720
18,078
23.7
23.7
41.4
47.3
17.7
15.5
4.6
3.6
29.6
26.1
3.0
2.6
Aventis*
Neutral
4,253
-
9,794
2,277
2,597
17.3
18.3
149.4
172.0
28.5
24.7
4.7
3.8
25.1
28.8
4.0
3.2
Cadila Healthcare
Accumulate
358
400
36,665
10,429
12,318
22.6
22.0
16.9
19.2
21.2
18.7
5.4
4.3
28.5
25.7
3.5
2.9
Cipla
Neutral
553
-
44,417
15,378
18,089
17.4
18.4
21.6
27.2
25.6
20.3
3.3
2.9
13.7
15.2
3.1
2.6
Stock Watch
November 16, 2016
Company Name
Reco
CMP
Target
Mkt Cap
Sales ( Čcr )
OPM(%)
EPS (Č)
PER(x)
P/BV(x)
RoE(%)
EV/Sales(x)
(Č)
Price ( Č)
( Č cr )
FY17E FY18E
FY17E
FY18E
FY17E
FY18E
FY17E
FY18E
FY17E
FY18E
FY17E
FY18E
FY17E
FY18E
Pharmaceuticals
Dr Reddy's
Neutral
3,309
-
54,824
16,043
18,119
20.8
22.4
112.4
142.9
29.4
23.2
3.9
3.4
14.1
15.9
3.4
3.0
Dishman Pharma
Neutral
229
-
3,690
1,718
1,890
22.7
22.8
9.5
11.3
24.1
20.2
2.3
2.1
10.1
10.9
2.6
2.3
GSK Pharma*
Neutral
2,650
-
22,447
3,000
3,312
15.4
20.6
46.5
60.8
57.0
43.6
13.7
13.6
26.3
30.6
7.2
6.6
Indoco Remedies
Neutral
286
-
2,632
1,112
1,289
16.2
18.2
11.6
16.0
24.6
17.9
3.9
3.3
17.0
20.1
2.5
2.1
Ipca labs
Accumulate
540
613
6,819
3,303
3,799
15.3
15.3
17.3
19.7
31.2
27.4
2.7
2.5
9.1
9.4
2.2
1.9
Lupin
Buy
1,440
1,809
64,930
15,912
18,644
26.4
26.7
58.1
69.3
24.8
20.8
4.8
4.0
21.4
20.9
4.2
3.4
Sun Pharma
Buy
683
944
164,257
31,129
35,258
30.0
30.9
28.0
32.8
24.4
20.8
3.7
3.1
18.7
18.9
4.9
4.1
Power
Tata Power
Neutral
69
-
18,730
36,916
39,557
17.4
27.1
5.1
6.3
13.6
11.0
1.2
1.1
9.0
10.3
1.5
1.4
NTPC
Neutral
150
-
123,723
86,605
95,545
17.5
20.8
11.8
13.4
12.7
11.2
1.3
1.2
10.5
11.1
2.8
2.8
Power Grid
Neutral
184
-
96,471
25,763
29,762
74.3
73.1
14.8
17.3
12.5
10.7
2.0
1.7
16.9
17.5
8.0
7.6
Real Estate
Prestige Estate
Buy
157
210
5,895
4,707
5,105
25.2
26.0
10.3
13.0
15.3
12.1
1.2
1.1
10.3
10.2
2.4
2.1
MLIFE
Buy
373
522
1,530
1,152
1,300
22.7
24.6
29.9
35.8
12.5
10.4
0.9
0.9
7.6
8.6
2.0
1.7
Telecom
Bharti Airtel
Neutral
303
-
121,081
105,086
114,808
34.5
34.7
12.2
16.4
24.8
18.5
1.7
1.6
6.8
8.4
2.1
1.8
Idea Cellular
Neutral
71
-
25,692
40,133
43,731
37.2
37.1
6.4
6.5
11.2
11.0
0.9
0.9
8.2
7.6
1.7
1.4
zOthers
Abbott India
Neutral
4,576
-
9,724
3,153
3,583
14.1
14.4
152.2
182.7
30.1
25.1
147.6
126.1
25.6
26.1
2.8
2.4
Asian Granito
Buy
200
351
601
1,071
1,182
12.1
12.4
12.7
16.0
15.7
12.5
1.5
1.3
9.5
10.7
0.9
0.7
Bajaj Electricals
Buy
216
306
2,178
5,099
5,805
5.6
5.9
11.4
14.6
19.0
14.8
2.5
2.2
13.4
15.1
0.4
0.4
Banco Products (India)
Neutral
179
-
1,282
1,353
1,471
12.3
12.4
14.5
16.3
12.4
11.0
17.1
15.4
14.5
14.6
0.9
94.9
Coffee Day Enterprises
Neutral
210
-
4,317
2,964
3,260
20.5
21.2
4.7
8.0
-
26.2
2.4
2.2
5.5
8.5
1.9
1.7
Ltd
Competent Automobiles Neutral
167
-
102
1,137
1,256
3.1
2.7
28.0
23.6
6.0
7.1
32.0
28.9
14.3
11.5
0.1
0.1
Elecon Engineering
Neutral
50
-
549
1,482
1,660
13.7
14.5
3.9
5.8
12.9
8.7
3.0
2.8
7.8
10.9
0.7
0.6
Finolex Cables
Neutral
381
-
5,832
2,883
3,115
12.0
12.1
14.2
18.6
26.9
20.5
14.3
12.5
15.8
14.6
1.7
1.5
Garware Wall Ropes
Neutral
553
-
1,211
873
938
12.9
13.1
30.9
34.9
17.9
15.9
2.8
2.4
15.7
15.2
1.3
1.2
Goodyear India*
Neutral
742
-
1,712
1,598
1,704
10.4
10.2
49.4
52.6
15.0
14.1
69.4
60.8
18.2
17.0
0.8
105.6
Hitachi
Neutral
1,221
-
3,320
2,081
2,433
8.8
8.9
33.4
39.9
36.6
30.6
29.5
24.6
22.1
21.4
1.6
1.3
HSIL
Neutral
288
-
2,083
2,384
2,515
15.8
16.3
15.3
19.4
18.8
14.9
18.7
16.1
7.8
9.3
1.0
0.9
Interglobe Aviation
Neutral
884
-
31,841
21,122
26,005
14.5
27.6
110.7
132.1
8.0
6.7
47.8
34.1
168.5
201.1
1.5
1.2
Jyothy Laboratories
Neutral
320
-
5,809
1,440
2,052
11.5
13.0
8.5
10.0
37.6
32.0
9.1
8.4
18.6
19.3
4.3
3.0
Kirloskar Engines India
Neutral
343
-
4,960
2,554
2,800
9.9
10.0
10.5
12.1
32.7
28.4
13.7
12.9
10.7
11.7
1.6
1.4
Ltd
Stock Watch
November 16, 2016
Company Name
Reco
CMP
Target
Mkt Cap
Sales ( Čcr )
OPM(%)
EPS (Č)
PER(x)
P/BV(x)
RoE(%)
EV/Sales(x)
(Č)
Price ( Č)
( Č cr )
FY17E
FY18E
FY17E
FY18E
FY17E
FY18E
FY17E
FY18E
FY17E
FY18E
FY17E
FY18E
FY17E
FY18E
zOthers
Linc Pen & Plastics
Neutral
240
-
355
382
420
9.3
9.5
13.5
15.7
17.8
15.3
3.1
2.6
17.1
17.3
1.0
0.9
M M Forgings
Neutral
416
-
502
546
608
20.4
20.7
41.3
48.7
10.1
8.5
56.9
50.4
16.6
17.0
0.8
0.7
Manpasand Bever.
Neutral
670
-
3,831
836
1,087
19.6
19.4
16.9
23.8
39.7
28.1
4.8
4.2
12.0
14.8
4.3
3.2
Mirza International
Buy
80
113
965
1,024
1,148
18.0
18.0
6.9
8.0
11.6
10.0
2.0
1.7
16.6
16.2
1.1
1.0
MT Educare
Neutral
121
-
480
366
417
17.7
18.2
9.4
10.8
12.9
11.2
2.9
2.5
22.2
22.3
1.2
1.0
Narayana Hrudaya
Neutral
330
-
6,738
1,873
2,166
11.5
11.7
2.6
4.0
124.7
83.2
7.7
6.9
6.1
8.3
3.7
3.2
Navkar Corporation
Buy
183
265
2,608
408
612
42.9
42.3
6.8
11.5
27.0
15.9
1.9
1.7
6.9
10.5
7.3
4.9
Navneet Education
Neutral
106
-
2,520
1,062
1,147
24.0
24.0
6.1
6.6
17.4
16.0
3.6
3.2
20.6
19.8
2.5
2.3
Nilkamal
Neutral
1,314
-
1,961
1,995
2,165
10.7
10.4
69.8
80.6
18.8
16.3
75.1
65.2
16.6
16.5
1.0
0.9
Page Industries
Neutral
13,171
-
14,691
2,450
3,124
20.1
17.6
299.0
310.0
44.1
42.5
293.3
223.9
47.1
87.5
6.0
4.8
Parag Milk Foods
Neutral
277
-
2,333
1,919
2,231
9.3
9.6
9.5
12.9
29.4
21.4
4.6
3.8
15.5
17.5
1.4
1.2
Quick Heal
Neutral
237
-
1,662
408
495
27.3
27.0
7.7
8.8
30.7
27.0
2.8
2.9
9.3
10.6
3.2
2.7
Radico Khaitan
Buy
122
147
1,617
1,667
1,824
13.0
13.2
6.7
8.2
18.3
14.9
1.7
1.5
9.0
10.2
1.4
1.2
Relaxo Footwears
Neutral
396
-
4,749
2,085
2,469
9.2
8.2
7.6
8.0
52.3
49.8
20.3
17.3
17.9
18.8
2.4
2.0
S H Kelkar & Co.
Neutral
280
-
4,056
1,036
1,160
15.1
15.0
6.1
7.2
45.9
39.1
4.9
4.5
10.7
11.5
3.8
3.3
Siyaram Silk Mills
Accumulate
1,232
1,714
1,155
1,799
2,040
11.6
11.7
104.9
122.4
11.7
10.1
1.9
1.7
16.4
16.4
0.8
0.7
Styrolution ABS India*
Neutral
594
-
1,045
1,440
1,537
9.2
9.0
40.6
42.6
14.6
14.0
37.4
34.0
12.3
11.6
0.7
0.6
Surya Roshni
Neutral
193
-
847
3,342
3,625
7.8
7.5
17.3
19.8
11.2
9.8
21.2
17.0
10.5
10.8
0.5
0.5
Team Lease Serv.
Neutral
943
-
1,613
3,229
4,001
1.5
1.8
22.8
32.8
41.4
28.7
4.4
3.8
10.7
13.4
0.4
0.3
The Byke Hospitality
Neutral
176
-
707
287
384
20.5
20.5
7.6
10.7
23.2
16.5
4.8
3.9
20.7
23.5
2.5
1.8
Transport Corporation of
Neutral
173
-
1,325
2,671
2,911
8.5
8.8
13.9
15.7
12.5
11.1
1.7
1.5
13.7
13.8
0.6
0.6
India
TVS Srichakra
Neutral
3,286
-
2,516
2,304
2,614
13.7
13.8
231.1
266.6
14.2
12.3
369.2
290.7
33.9
29.3
1.1
0.9
UFO Moviez
Neutral
447
-
1,233
619
685
33.2
33.4
30.0
34.9
14.9
12.8
2.1
1.8
13.8
13.9
1.7
1.4
Visaka Industries
Neutral
196
-
312
1,051
1,138
10.3
10.4
21.0
23.1
9.3
8.5
25.2
23.6
9.0
9.2
0.6
0.5
VRL Logistics
Neutral
268
-
2,443
1,902
2,119
16.7
16.6
14.6
16.8
18.4
15.9
4.0
3.5
21.9
22.2
1.4
1.2
Wonderla Holidays
Neutral
349
-
1,973
287
355
38.0
40.0
11.3
14.2
30.9
24.6
4.4
3.9
21.4
23.9
6.6
5.3
Source: Company, Angel Research; Note: *December year end; #September year end; &October year end; Price as on November 15, 2016
Market Outlook
November 16, 2016
Research Team Tel: 022 - 39357800
DISCLAIMER
Angel Broking Private Limited (hereinafter referred to as “Angel”) is a registered Member of National Stock Exchange of India
Limited,Bombay Stock Exchange Limited and Metropolitan Stock Exchange Limited. It is also registered as a Depository Participant with
CDSL and Portfolio Manager with SEBI. It also has registration with AMFI as a Mutual Fund Distributor. Angel Broking Private Limited is a
registered entity with SEBI for Research Analyst in terms of SEBI (Research Analyst) Regulations, 2014 vide registration number
INH000000164. Angel or its associates has not been debarred/ suspended by SEBI or any other regulatory authority for accessing
/dealing in securities Market. Angel or its associates/analyst has not received any compensation / managed or
co-managed public offering of securities of the company covered by Analyst during the past twelve months.
This document is solely for the personal information of the recipient, and must not be singularly used as the basis of any investment
decision. Nothing in this document should be construed as investment or financial advice. Each recipient of this document should make
such investigations as they deem necessary to arrive at an independent evaluation of an investment in the securities of the companies
referred to in this document (including the merits and risks involved), and should consult their own advisors to determine the merits and
risks of such an investment.
Reports based on technical and derivative analysis center on studying charts of a stock's price movement, outstanding positions and
trading volume, as opposed to focusing on a company's fundamentals and, as such, may not match with a report on a company's
fundamentals. Investors are advised to refer the Fundamental and Technical Research Reports available on our website to evaluate the
contrary view, if any.
The information in this document has been printed on the basis of publicly available information, internal data and other reliable
sources believed to be true, but we do not represent that it is accurate or complete and it should not be relied on as such, as this
document is for general guidance only. Angel Broking Pvt. Limited or any of its affiliates/ group companies shall not be in any way
responsible for any loss or damage that may arise to any person from any inadvertent error in the information contained in this report.
Angel Broking Pvt. Limited has not independently verified all the information contained within this document. Accordingly, we cannot
testify, nor make any representation or warranty, express or implied, to the accuracy, contents or data contained within this document.
While Angel Broking Pvt. Limited endeavors to update on a reasonable basis the information discussed in this material, there may be
regulatory, compliance, or other reasons that prevent us from doing so.
This document is being supplied to you solely for your information, and its contents, information or data may not be reproduced,
redistributed or passed on, directly or indirectly.
Neither Angel Broking Pvt. Limited, nor its directors, employees or affiliates shall be liable for any loss or damage that may arise from
or in connection with the use of this information.