Initiating coverage | Real Estate
May 17, 2012
Mahindra Lifespaces Developers
BUY
CMP
`312
As clean as it comes
Target Price
`376
Mahindra Lifespaces Developers (MLIFE) is a mid and premium housing
Investment Period
12 Months
developer catering to strong demand in tier-1 cities and small metros in the
country. Apart from real estate development, MLIFE also operates two integrated
Stock Info
business cities - Mahindra World City (MWC) Chennai and Jaipur [special
Sector
Real Estate
economic zones (SEZ) and domestic tariff area (DTA)]. MLIFE’s strong balance
Market Cap (` cr)
1,323
sheet (FY2013E D/E ratio - 0.2x), good corporate governance, diversified land
Beta
0.9
bank and solid brand name sets it apart from many of its peers. We also prefer
52 Week High / Low
418 / 235
MLIFE’s high turnover real estate business model, which is more focused on
Avg. Daily Volume
11,326
Face Value (`)
10
development rather than land bank accumulation. We Initiate Coverage on the
BSE Sensex
17,374
stock with a Buy recommendation.
Nifty
5,291
MLIFE in the right markets: With slowing demand in super metros (Mumbai and
Reuters Code
MALD.BO
Bloomberg Code
MLIFE IN
NCR), we favor MLIFE’s exposure to tier-1 cities (Pune and Nagpur) and small
metros (Hyderabad), given their strong demand dynamics. Pune, Nagpur and
Hyderabad now form 68% of MLIFE’s exposure in terms of saleable area. With
Shareholding Pattern (%)
5.2mn sq. ft. of forthcoming projects (~4.3x its FY2012 sales), we expect strong
Promoters
51.1
sales momentum during FY2013E and FY2014E, which is our primary catalyst.
MF / Banks / Indian Fls
5.9
We also note that with the initiation of the rate cut cycle, mid-market housing will
FII / NRIs / OCBs
31.2
lead the recovery in demand, which has been a focus area for MLIFE.
Indian Public / Others
11.8
Being conservative on MWC is the key: Impact on demand due to direct tax code
has been an overhang on MWC’s portfolio. We note that ~53% of MLIFE’s
Abs. (%)
3m 1yr 3yr
invested capital is in the MWC portfolio; however, we have conservatively valued
Sensex
3.8
(10.8)
58.2
it at `97/share (contributes 20.6% to our SOTP value of `470). Moreover, MWC
MAHLIFE
26.6
(17.4)
71.2
Chennai’s current occupancy levels, at 92%, provide stable revenue visibility.
MLIFE deserves a premium to its peers: MLIFE is currently trading at 1.0x and 0.9x
on our FY2013E and FY2014E BVPS estimates. On PB basis (one-year forward),
MLIFE is trading at a 35% premium to BSE Realty Index, which we hold is justified,
given its strong balance sheet, good corporate governance, asset-light model and
solid brand name along with solid parent backing. We value MLIFE on an SOTP
basis to arrive at a value of `470, we apply a 20% discount to our SOTP value to
arrive at our target price of `376, implying a PB (FY2014E) of 1.1x.
Key Financials (Consolidated)
Y/E March (` cr)
FY2011
FY2012E FY2013E
FY2014E
Net Revenue
612
701
814
897
% chg
46.4
14.6
16.1
10.2
Net Profit
108
119
128
139
% chg
37.8
10.1
7.4
8.3
EBITDA (%)
28.8
27.3
26.9
27.0
EPS (`)
26.5
29.2
31.3
33.9
P/E (x)
11.8
10.7
10.0
9.2
P/BV (x)
1.2
1.1
1.0
0.9
RoE (%)
10.2
10.3
10.2
10.1
RoCE (%)
10.5
10.4
10.6
9.8
Rahul Kaul
EV/Sales (x)
2.6
2.3
2.1
1.9
+91 22 3935 7800 Ext: 6817
EV/EBITDA (x)
8.9
8.5
8.0
7.0
Source: Company, Angel Research; Note: CMP as on May 16, 2012
Please refer to important disclosures at the end of this report
1
Mahindra Lifespaces Developers | Initiating coverage
MLIFE: In the right markets
MLIFE is a real estate developer,
MLIFE is a mid-market and premium housing developer. The company caters to
focusing on premium and mid-market
strong demand present in tier-1 cities and small metros, which are typically end-
housing and operating in two
user driven, as opposed to investor-led demand in super metros - National Capital
integrated business cities
- MWC
Region (NCR) and Mumbai.
Chennai and MWC Jaipur)
Tier-1 cities better placed than metros
Over the past few quarters, real estate in NCR (with the slight exception of
Gurgaon) and Mumbai has been marred by declining absorptions, growing
vacancy rates and falling affordability, owing to increasing prices and reluctance
on the part of developers to cut prices. Demand in small metros and tier-1 cities,
on the other hand, has been steady due to better affordability and stable end-user
demand.
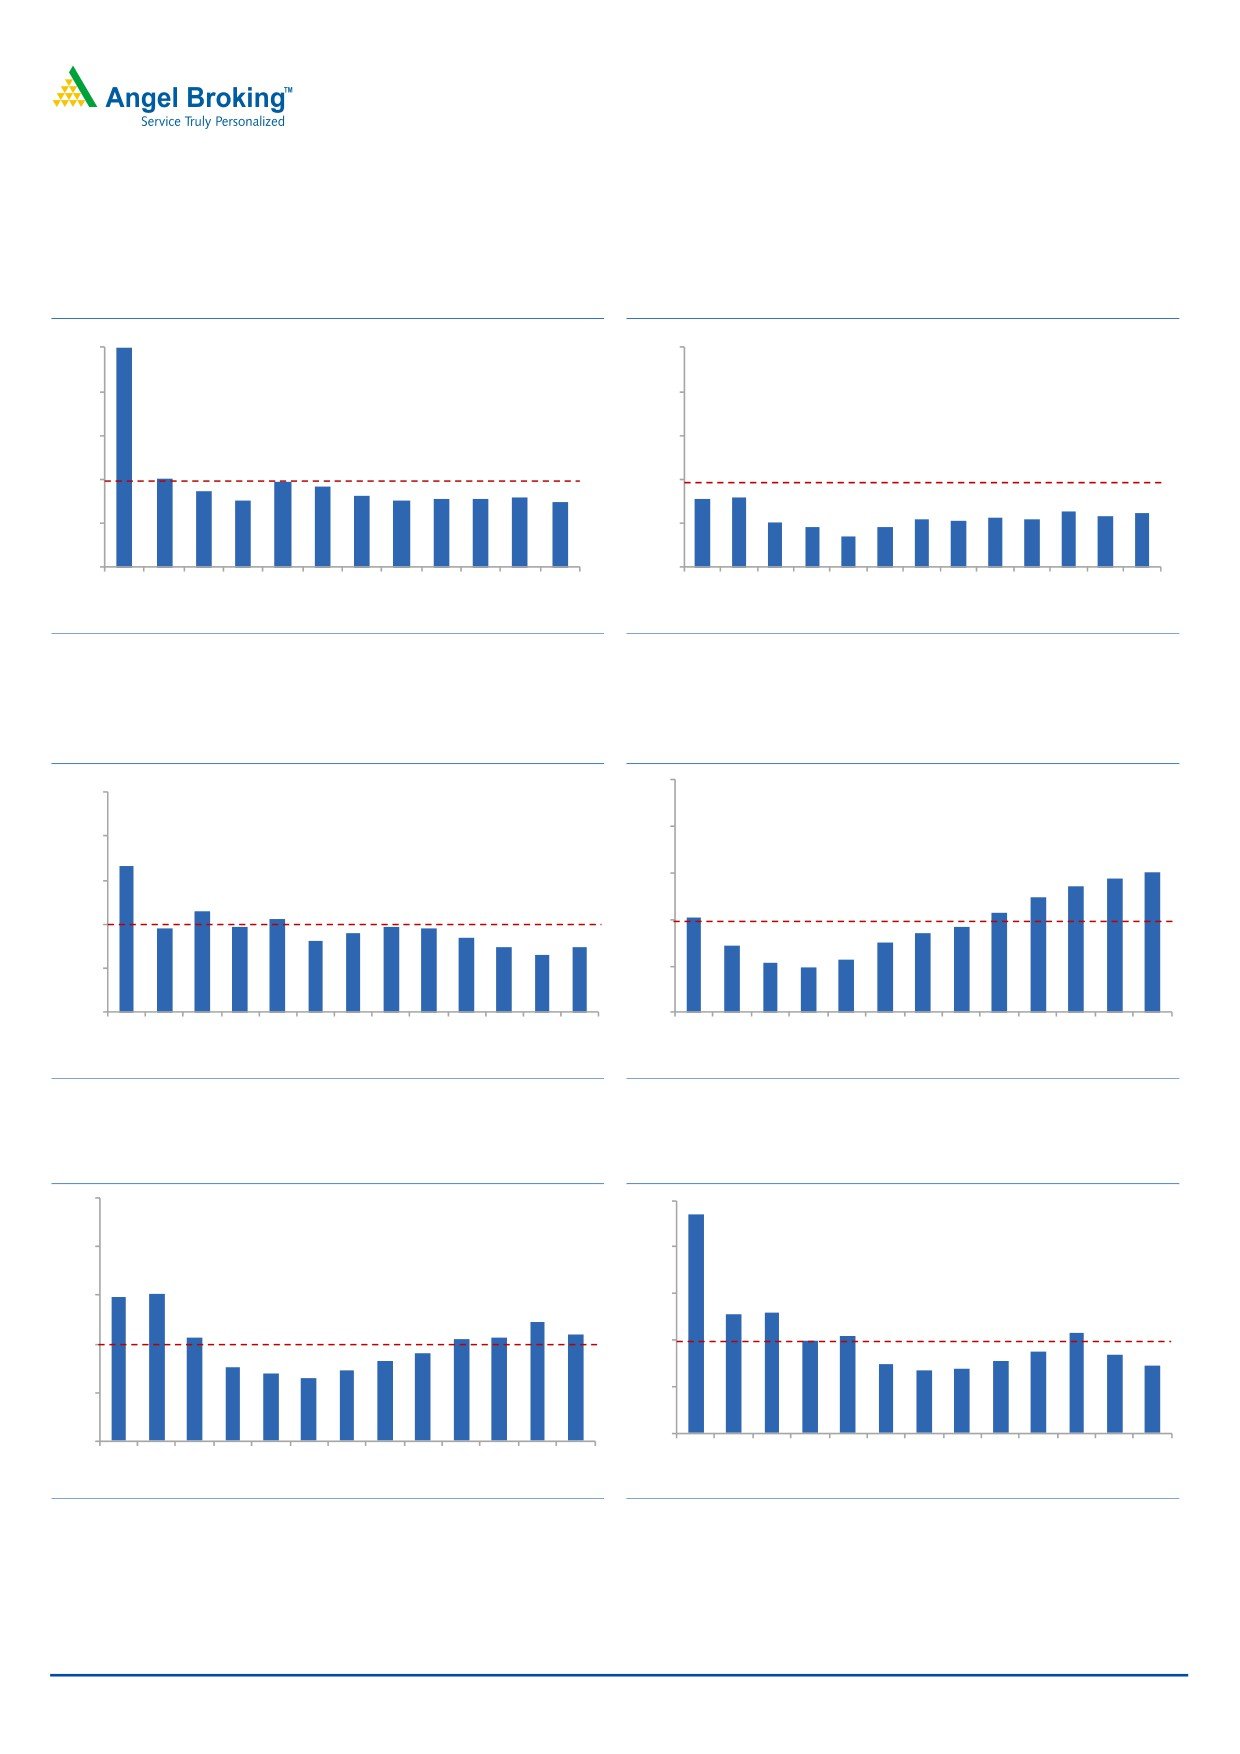
Pune, Hyderabad and Chennai have
According to data provided by Liasas Foras, inventory months as of March 2012
seen stable inventory levels, with
(Exhibit 3-8), have been stable for Pune (6 months vs. 6 months yoy), Hyderabad
inventory months as of March 2012 at
(7 months vs. 10 months yoy) and Chennai (8 months vs. 8 months yoy) over the
6 months, 7 months and 8 months,
past few quarters along with strong absorptions observed in Pune and Chennai.
respectively
Hyderabad absorption has decreased during the year due to fewer launches in
4QFY2012. On the other hand, falling absorptions in Mumbai and NCR have led
to rising inventory levels, with inventory months touching 15 months vs. 11 months
yoy and 11 months vs. 9 months yoy, respectively.
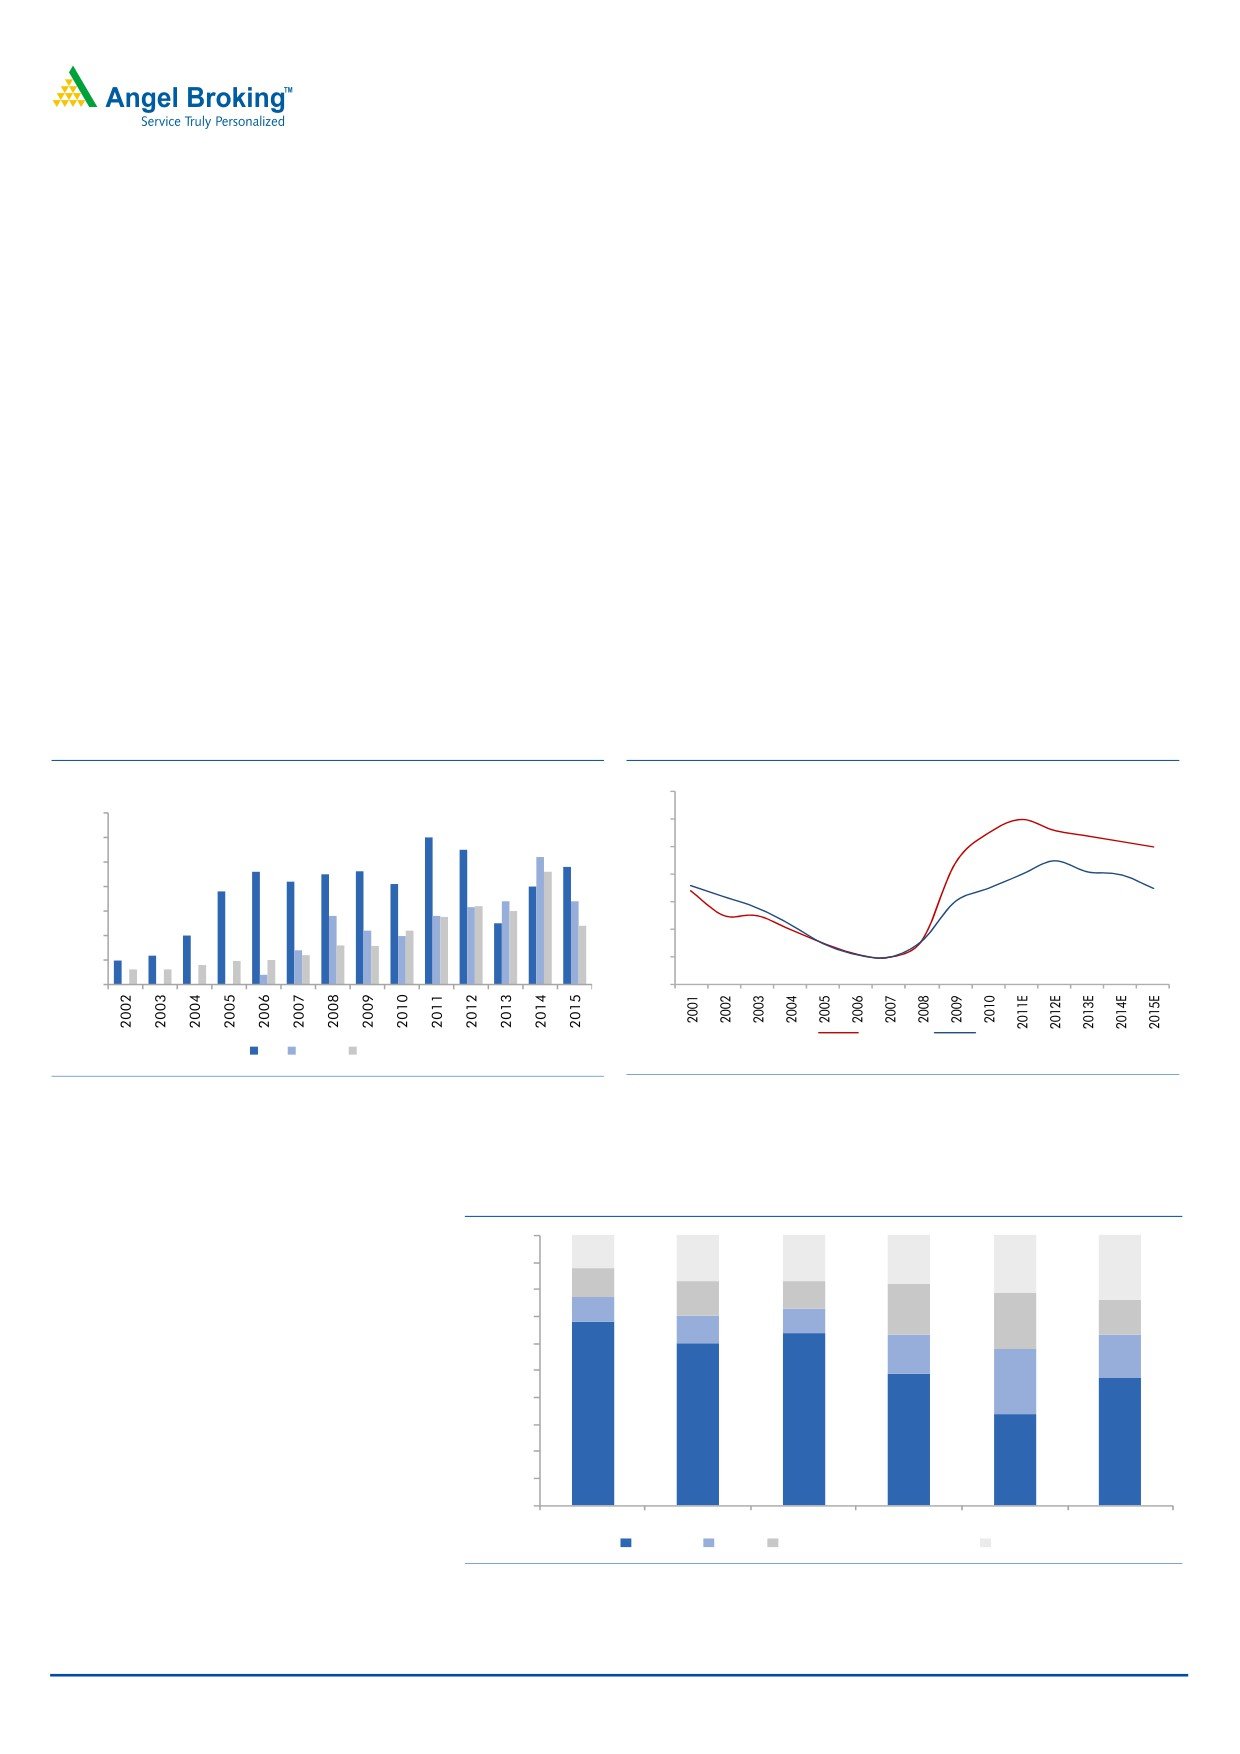
Well-diversified projects, with a focus on tier-1 cities
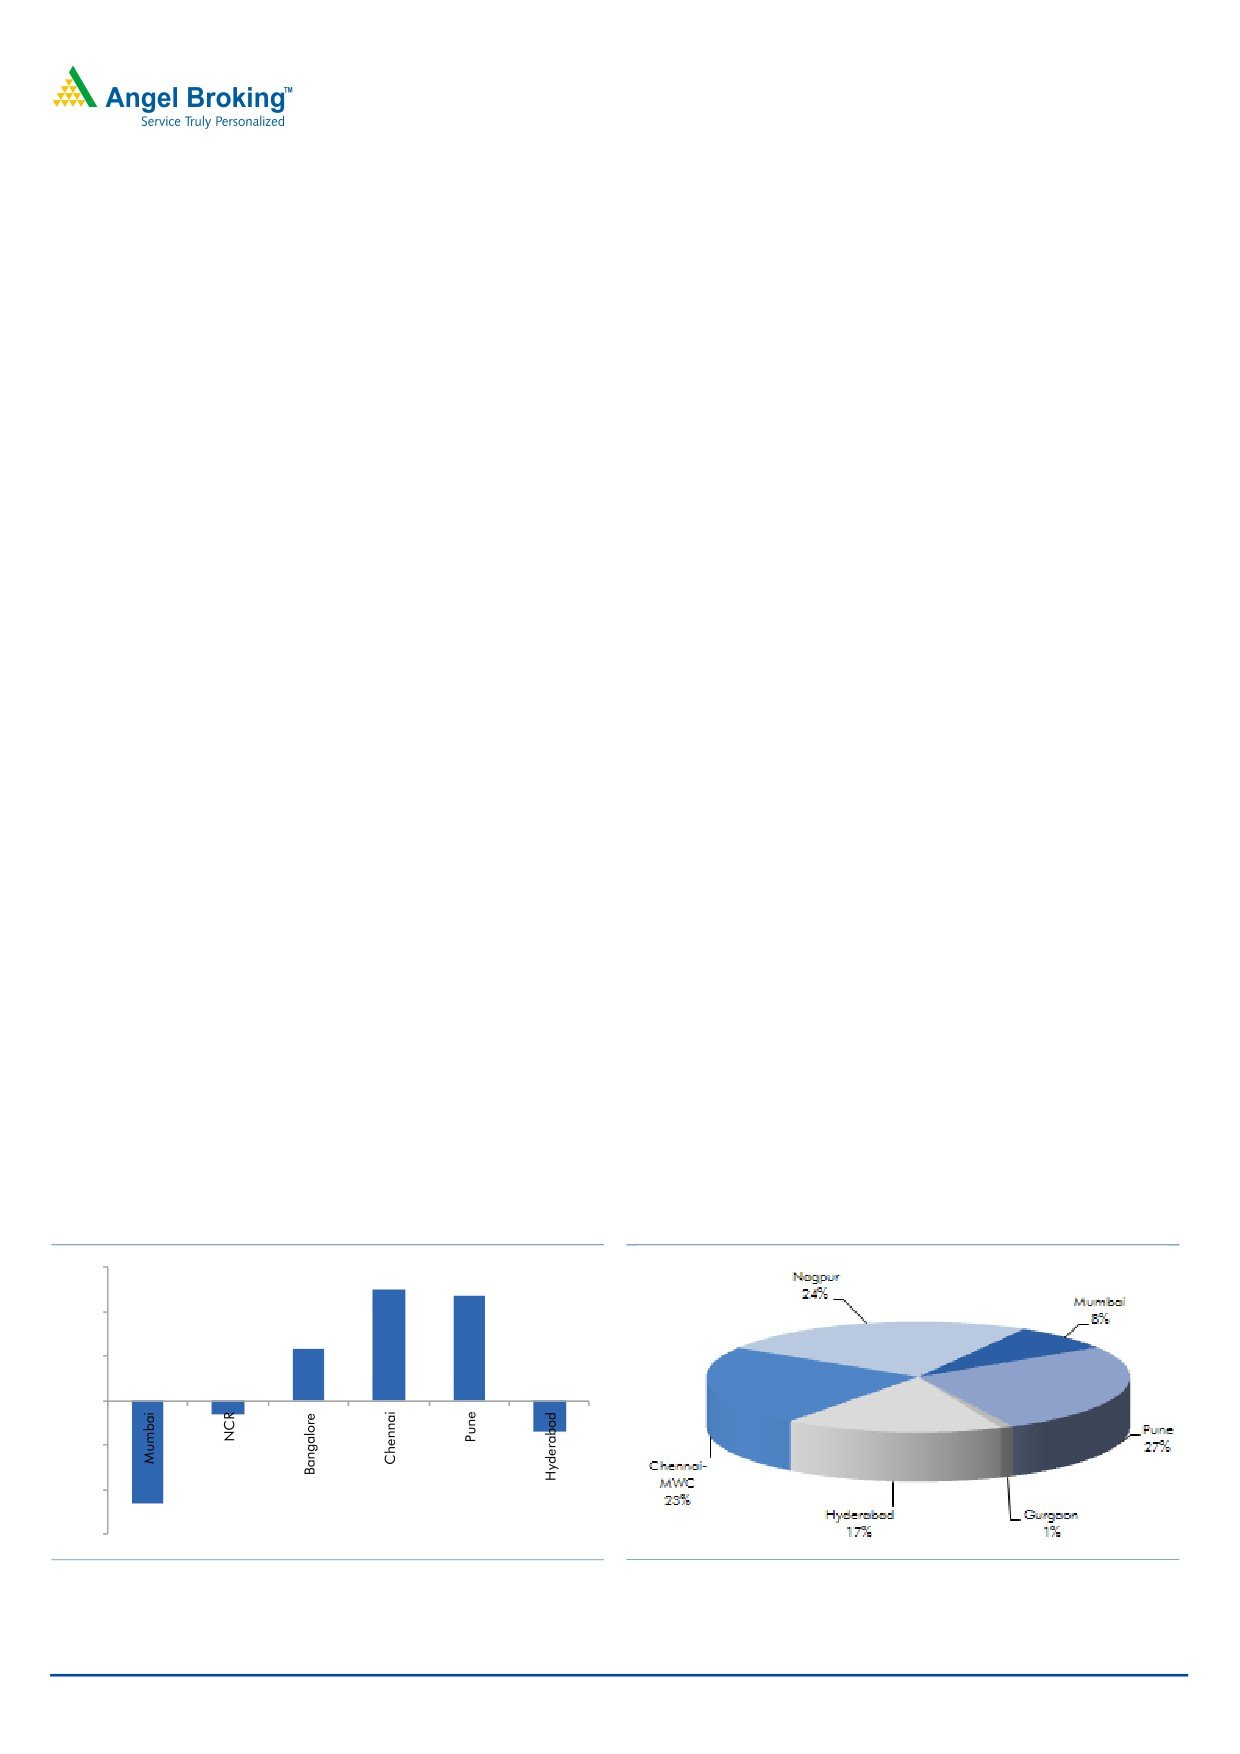
Pune, Hyderabad and Nagpur together form 68% of MLIFE’s exposure, in terms
Pune, Hyderabad and Nagpur together
of saleable floor area (ongoing and forthcoming projects), which is expected
form 68% of MLIFE’s exposure in terms
to be launched/sold over the coming years, with the remaining share contributed
of area yet to be sold
by NCR (Gurgaon) - 1%; Mumbai - 8%; and New Chennai - 23% (projects linked
to MWC - New Chennai). We believe MLIFE is well placed to benefit from the
relatively stable housing demand in small metros and tier-1 markets, given its
strong brand name, on-time execution track record and lesser competition from
organized players. MLIFE also recently announced that it plans to enter the
affordable housing space (`5lakh-15lakh category) in tier-2 cities.
Exhibit 1: India city residential sales trend: FY2012 vs.
Exhibit 2: MLIFE: City wise project exposure-
FY2011 (yoy %)
Forthcoming and ongoing projects
30
20
10
0
(10)
(20)
(30)
Source: Liasas Foras, Bloomberg, Angel Research
Source: Company, Angel Research
May 17, 2012
2
Mahindra Lifespaces Developers | Initiating coverage
Inventory months: Chennai, Pune and Hyderabad remain
stable, with Mumbai and NCR under pressure
Exhibit 3: Chennai: Stable inventory levels
Exhibit 4: Pune: Stable inventory levels
25
25
20
20
15
15
10
10
9
9
10
8
8
8
8
8
8
8
10
8
8
6
6
5
6
6
6
5
5
5
5
5
5
4
-
-
Q2
Q3
Q4
Q1
Q2 Q3 Q4
Q1
Q2
Q3
Q4
Q1
Q1
Q2 Q3 Q4 Q1 Q2 Q3
Q4
Q1
Q2
Q3
Q4
Q1
09
09
09
10
10
10
10
11
11
11
11
12
09
09
09
09
10
10
10
10
11
11
11
11
12
Source: Liasas Foras, Angel Research
Source: Liasas Foras, Angel Research
Exhibit 5: Hyderabad inventory levels stable due to
Exhibit 6: Declining sales in Mumbai leading to high
slow additions
inventory levels
25
25
20
20
17
14
15
15
14
15
12
12
11
11
10
10
10
10
10
9
9
8
10
9
10
8
8
7
7
7
7
5
6
5
5
5
-
-
Q1
Q2 Q3
Q4
Q1
Q2
Q3 Q4 Q1
Q2
Q3
Q4
Q1
Q1
Q2
Q3
Q4
Q1
Q2
Q3
Q4
Q1
Q2
Q3
Q4
Q1
09
09
09
09
10
10
10
10
11
11
11
11
12
09
09
09
09
10
10
10
10
11
11
11
11
12
Source: Liasas Foras, Angel Research
Source: Liasas Foras, Angel Research
Exhibit 7: NCR: Strong additions impacting inventory
Exhibit 8: Bangalore inventory months
25
25
24
20
20
15
15
15
15
13
13
12
11
11
10
11
10
11
10
9
10
9
8
10
8
7
8
8
7
7
7
7
7
7
5
5
-
-
Q1 Q2 Q3 Q4 Q1 Q2 Q3 Q4 Q1 Q2 Q3 Q4 Q1
Q1
Q2 Q3 Q4 Q1 Q2 Q3 Q4 Q1 Q2 Q3 Q4 Q1
09
09
09
09
10
10
10
10
11
11
11
11
12
09
09
09
09
10
10
10
10
11
11
11
11
12
Source: Liasas Foras, Angel Research
Source: Liasas Foras, Angel Research
May 17, 2012
3
Mahindra Lifespaces Developers | Initiating coverage
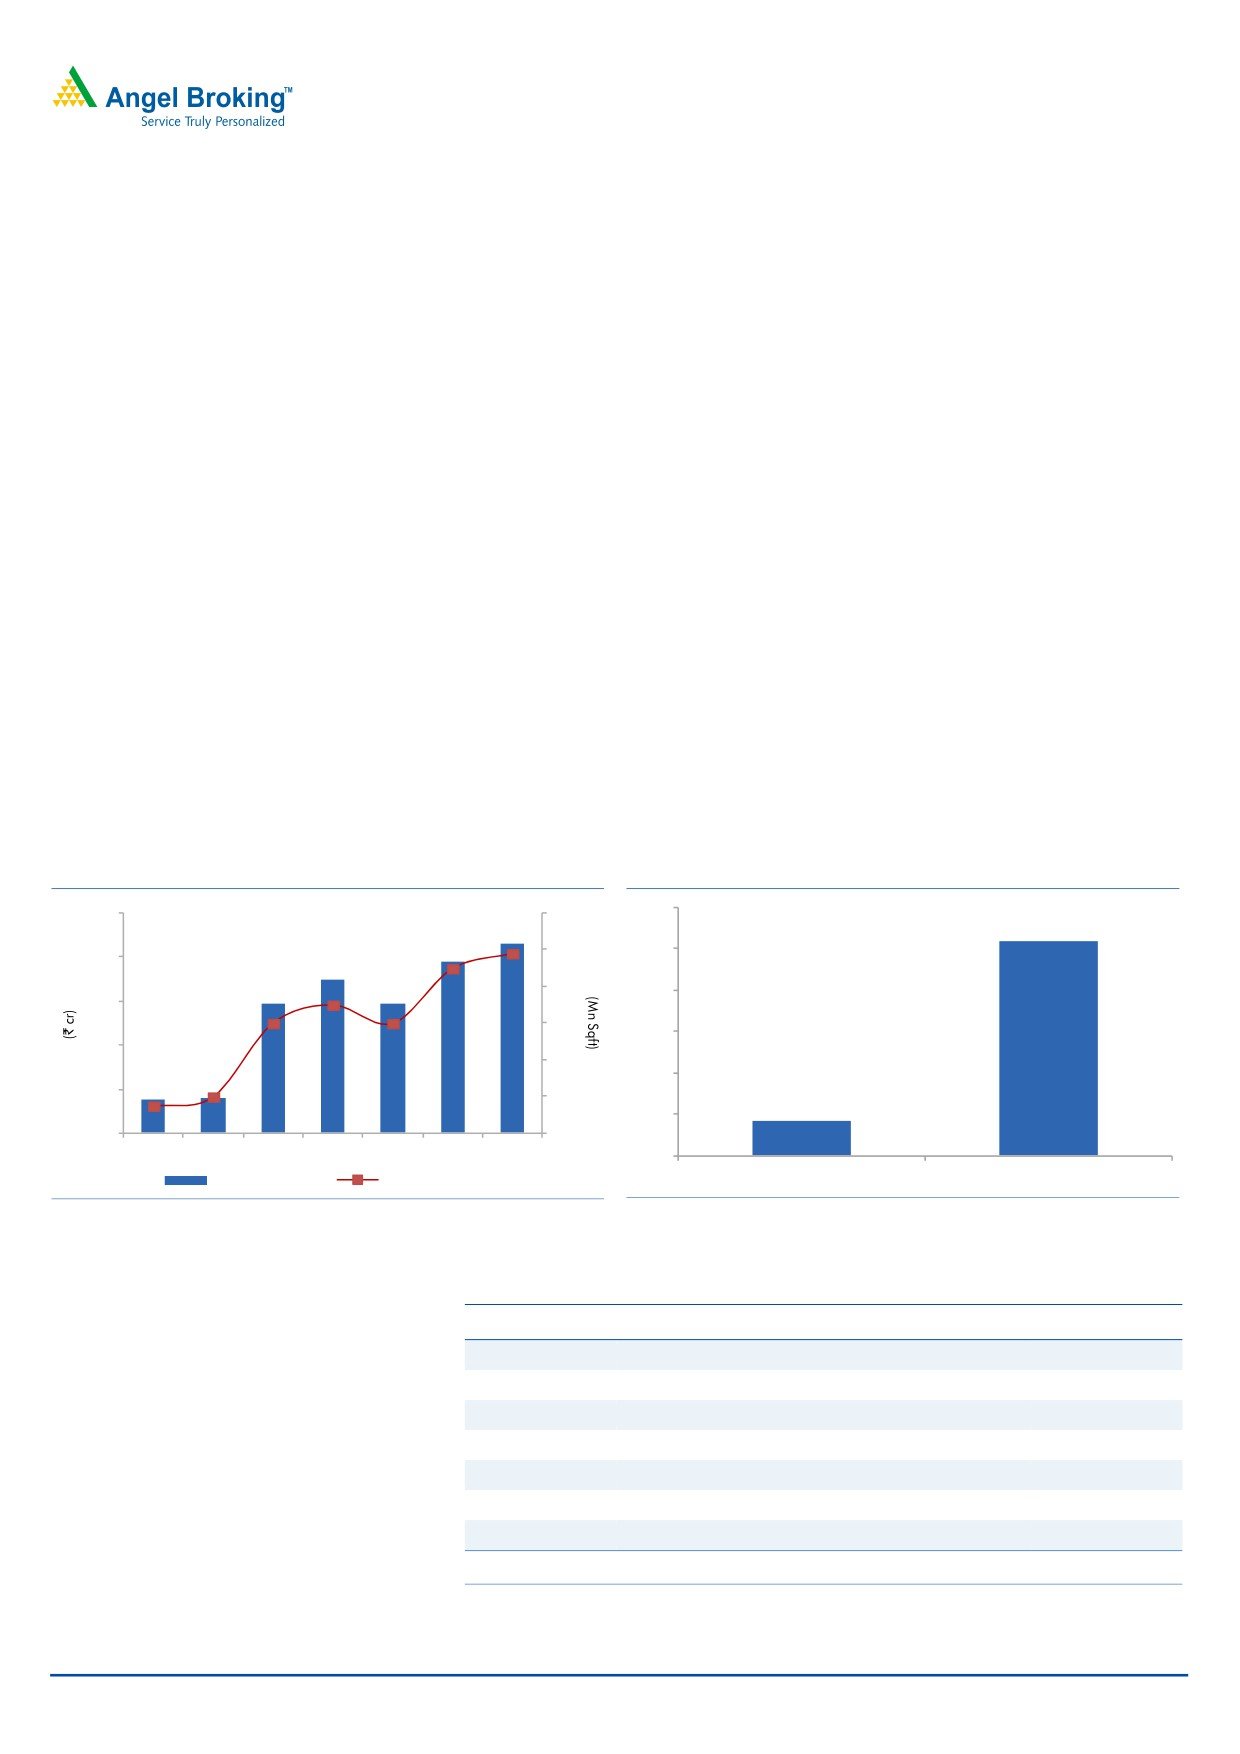
The right time to launch new projects
With 5.2mn sq. ft. of forthcoming projects, MLIFE enjoys a sales coverage of
~4.3x its FY2012 sales, thus providing a strong sales outlook for FY2013 and
FY2014E. MLIFE’s forthcoming projects are spread across Nagpur (25% of total
upcoming area), New Chennai (18%), Hyderabad (19%), Pune (31%) and Mumbai
(7%). We highlight that MLIFE’s residential projects in New Chennai (outside the
main Chennai city) are linked to its MWC Chennai portfolio, which should be the
main demand driver for the residential project. Given the high occupancy (~92%)
being observed in MWC Chennai currently, we expect strong demand for its projects.
We expect strong sales from new residential launches during FY2013E and 2014E
owing to MLIFE’s focus on small metros and tier-1 cities and a possible demand revival
due to lower interest rates. Strong sales (volume and value) during FY2013E will be a
key catalyst, in our view. We forecast sales volume of 1.6mn sq. ft. and 1.8mn sq. ft.
and sales value of `765cr and `834cr for FY2013E and FY2014E, respectively.
With most Mumbai projects close to completion and only one project left to be sold
(GE Garden - only 7% sold till March 2012), revenue and profit contribution from
Mumbai projects is set to decline, thus pulling down the company’s profit margins
going forward. We forecast EBITDA margin at 26.9% and 27.0% for FY2013E and
FY2014E, down from 27.3% in FY2012.
Exhibit 9: Strong sales expected during FY2013E and
Exhibit 10: Demand for new launches to remain
FY2014E
strong - Ongoing vs. Forthcoming projects
1,000
2.4
6.0
5.2
2.0
1.8
2.0
5.0
800
1.4
1.6
4.0
600
1.2
1.2
1.2
3.0
400
0.8
0.4
2.0
0.3
200
0.4
0.8
1.0
0
0.0
FY08
FY09
FY10
FY11
FY12E FY13E FY14E
-
Sales Value (LHS)
Sales Volume (RHS)
Ongoing Projects
Forthcoming Projects
Source: Company, Angel Research
Source: Company, Angel Research
Exhibit 11: MLIFE’s forthcoming projects breakdown
City
Forthcoming Projects
Area (mn sq. Ft.)
Mumbai
Ghatkopar
0.2
Mumbai
GE Garden
0.1
Pune
Pimpri Residential Project
1.6
Hyderabad
Kukatapally Project
1.0
Chennai
Aqua Lily
0.6
Chennai
Iris Court phase 3
0.3
Nagpur
Bloomdale
1.3
Total
5.2
Source: Company, Angel Research
May 17, 2012
4
Mahindra Lifespaces Developers | Initiating coverage
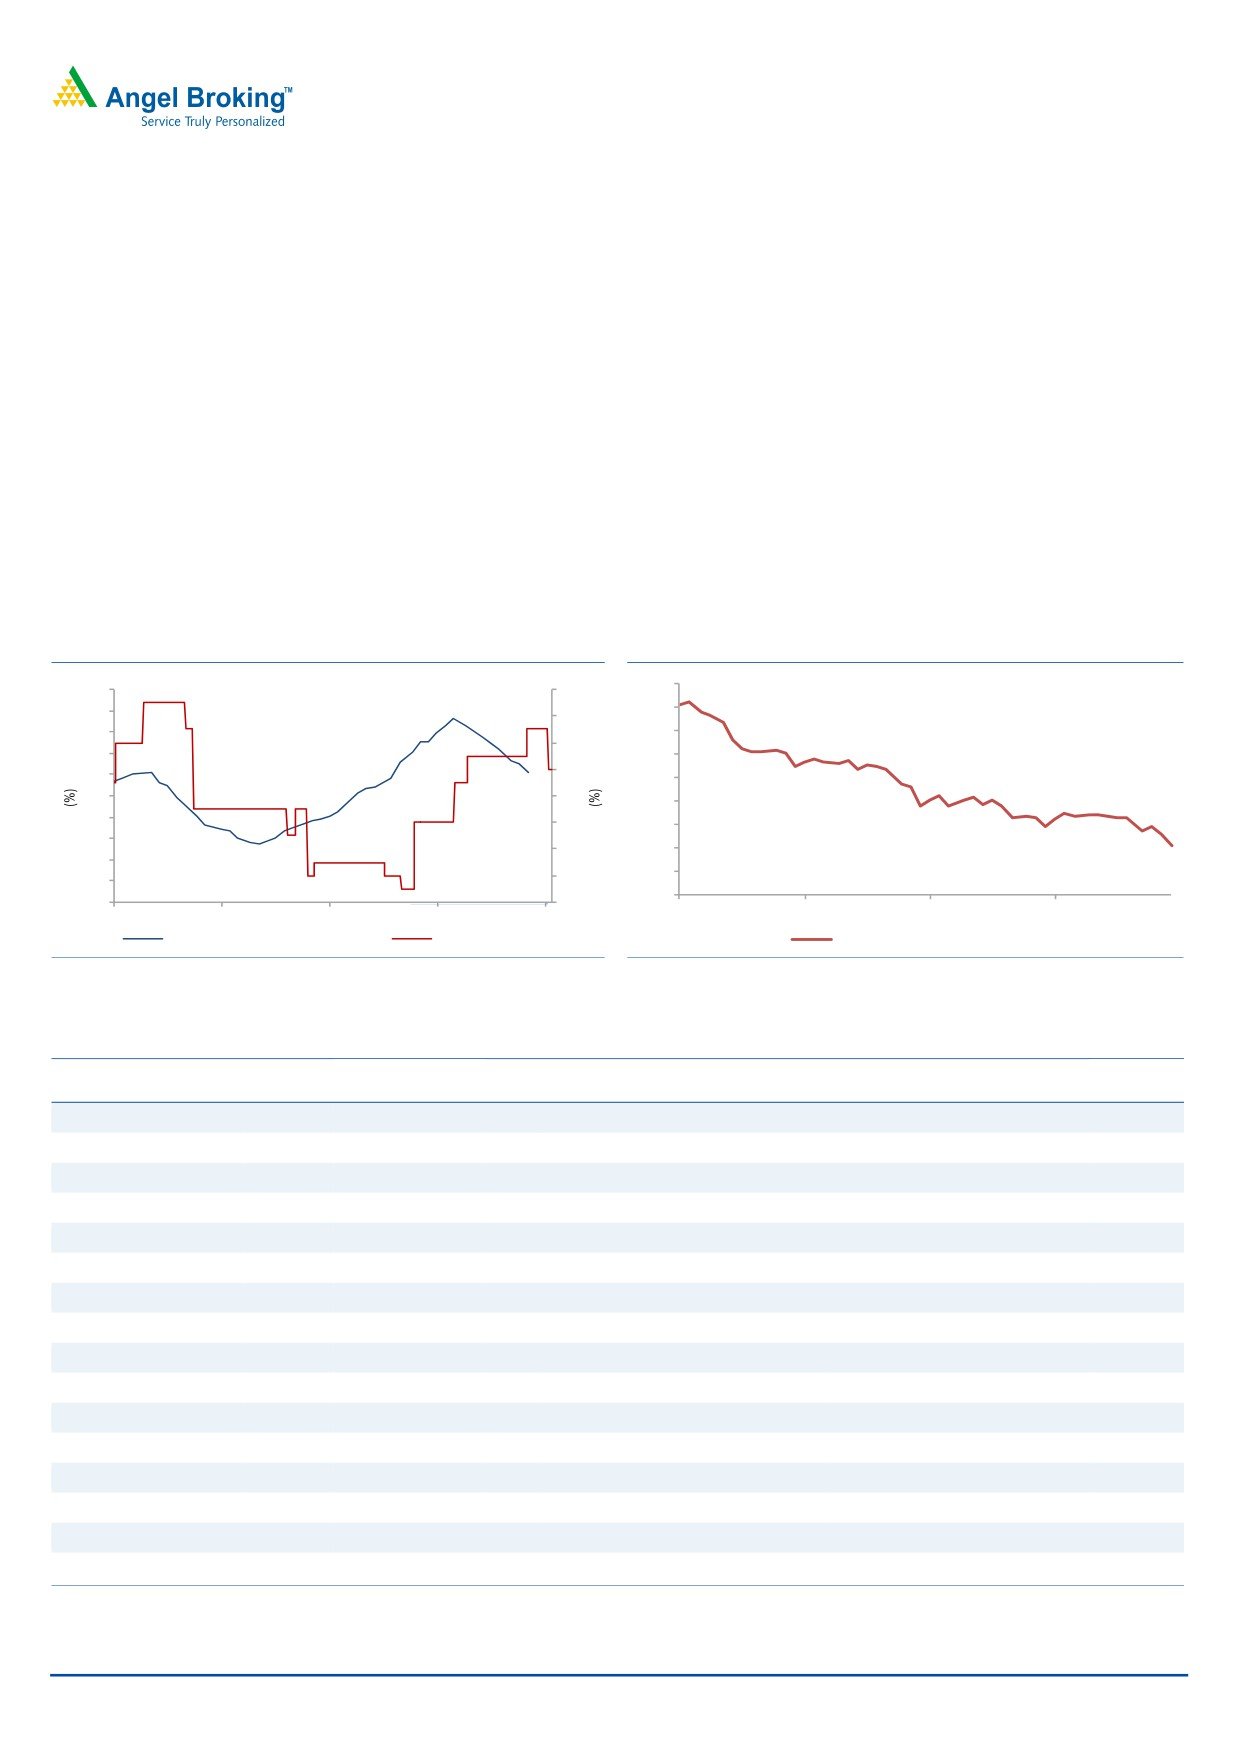
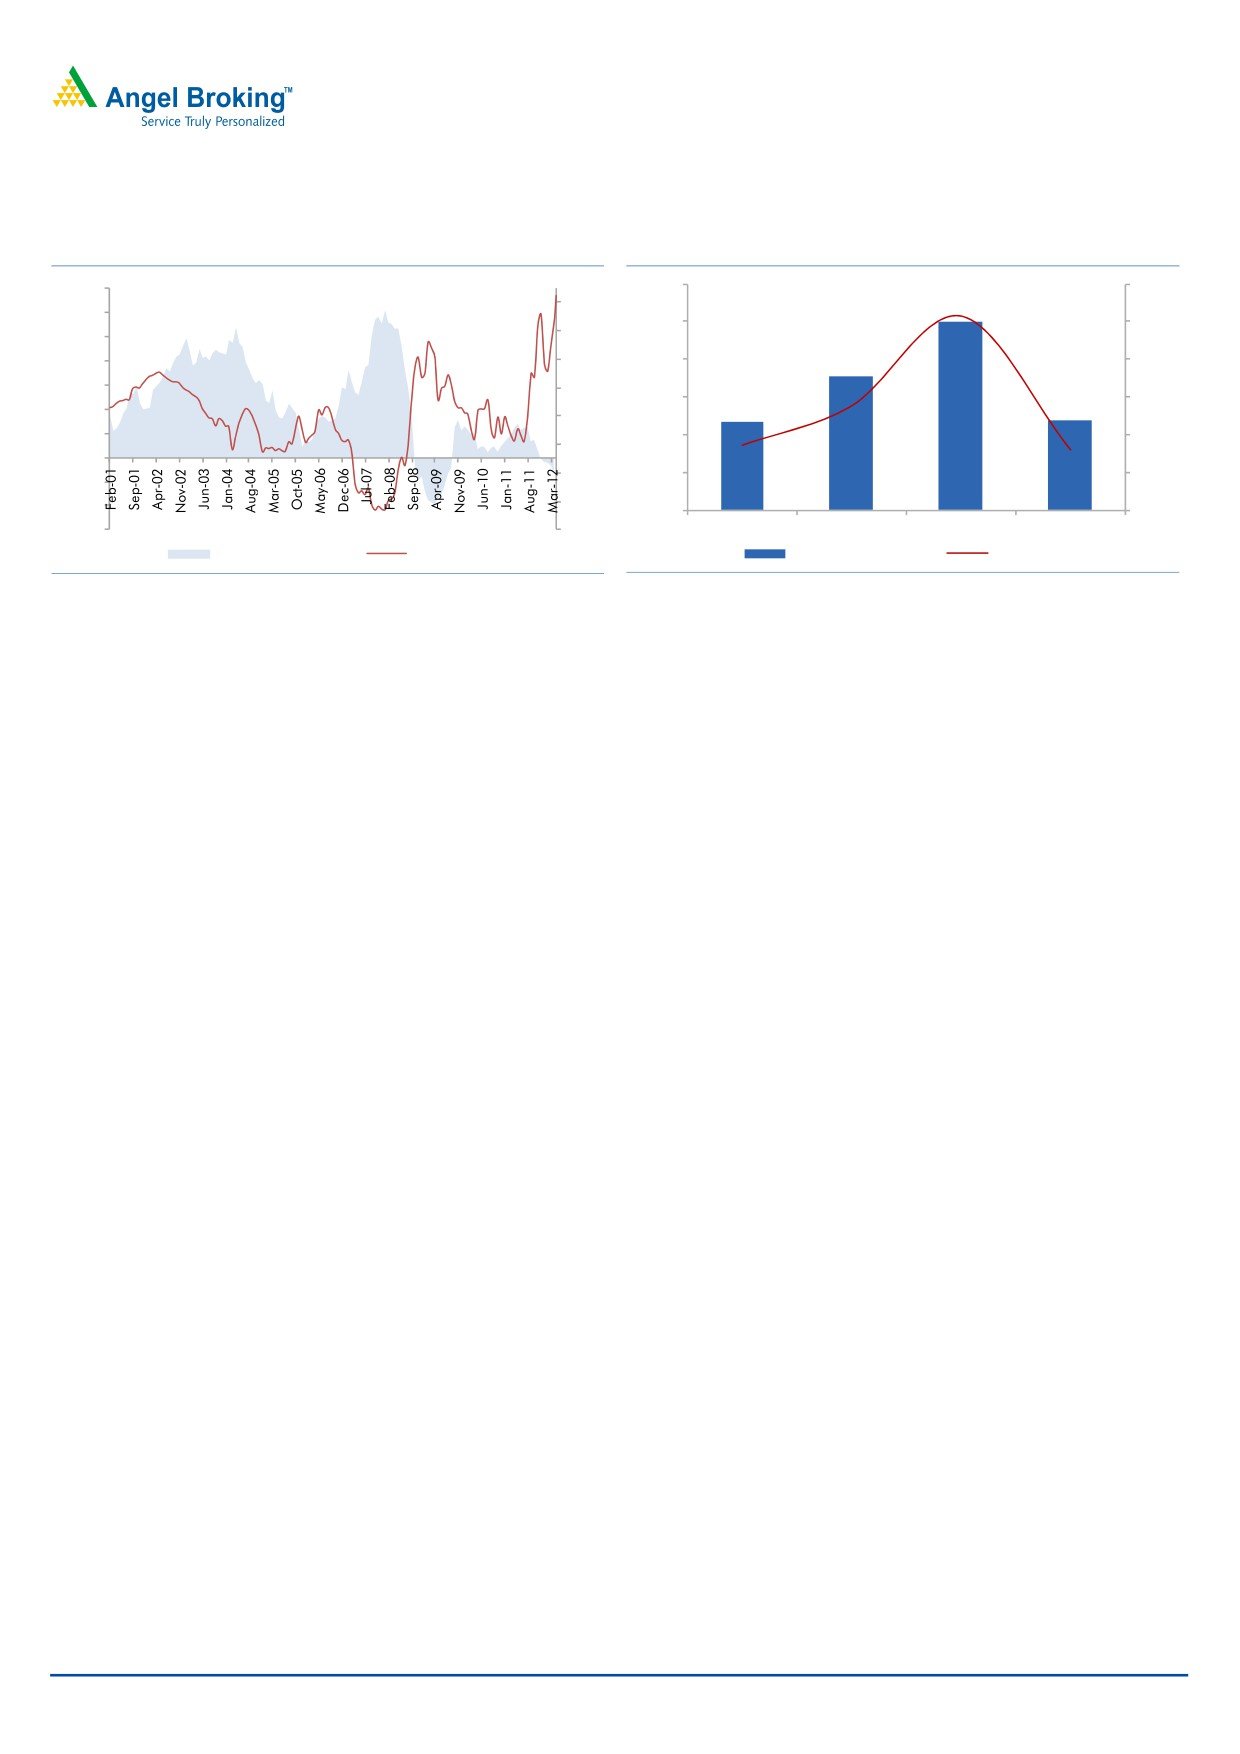
Rate cut cycle initiated, mid market to lead demand revival
Housing demand revival to be led by mid-market housing, with the initiation of the rate
cut cycle: The middle and upper-middle class segments are more dependent on housing
loans and, thus, are more sensitive to rate cuts than premium housing, in our view.
MLIFE, with its focus on upper-middle and middle class housing and its plans to
enter affordable housing, should see strong pent-up demand over the next few
quarters, especially in light of the fact that housing loan growth has been lagging
total credit growth, which can see a possible reversion due to the recent 50bp rate
cut, which should reflect in mortgage rates. Housing loans as a percentage of total
non-food credit outstanding have reduced to 9% as of March 2012 compared to
11.8% in April 2008. Further rate cuts by housing finance companies (HFCs)
would act as a near-term catalyst for MLIFE’s share price.
Exhibit 12: Housing loan growth* has remained
Exhibit 13: Housing loans has been decreasing as a %
subdued due to increasing mortgage rates
of total non-food credit
13%
20
12
18
12%
11.5
16
12%
11
14
11%
10.5
12
11%
10
10
10%
8
9.5
10%
6
9
9%
4
8.5
9%
2
8%
0
8
Apr-08
Apr-09
Apr-10
Apr-11
Apr-08
Apr-09
Apr-10
Apr-11
Apr-12
Housing yoy% 3mma(LHS)
Mortgage Rates
Housing as % of non food credit
Source: RBI, Bloomberg, Angel Research *3-month moving average
Source: RBI, Angel Research
Exhibit 14: MLIFE focussed on the mid-market and premium segments (Ongoing projects)
Area launched
Variation
Project name
City
Units
Base selling price (`/ sq. ft.)
City Average Selling Price
(mn sq. ft.)
(%)
Eminente Aspen
Mumbai
0.15
68
10,350
10,833
(4.5)
Eminente Angelica
Mumbai
0.15
67
9,650
10,833
(10.9)
Splendour -II
Mumbai
0.36
246
8,200
10,833
(24.3)
GE Garden
Mumbai
0.12
60
10,747
10,833
(0.8)
Aura- I
NCR
0.27
231
2,450
3,570
(31.4)
Aura- II
NCR
0.24
166
3,175
3,570
(11.1)
Aura- III
NCR
0.21
110
4,100
3,570
14.9
Aura- IV
NCR
0.28
141
4,375
3,570
22.6
Aura- V
NCR
0.25
110
4,375
3,570
22.6
Aqua Lily Villas B
Chennai
0.11
33
4,350
4,035
7.8
Aqua Lily Villas C
Chennai
0.11
40
4,550
4,035
12.8
Aqua Lily Villas D
Chennai
0.12
37
4,550
4,035
12.8
Aqua Lily Apts A
Chennai
0.14
80
3,230
4,035
(20.0)
Aqua Lily Apts B
Chennai
0.32
178
3,230
4,035
(20.0)
Iris Court Ph I
Chennai
0.27
244
2,850
4,035
(29.4)
Iris Court Ph II*
Chennai
0.3
229
2,950
4,035
(26.9)
Source: Company, Industry Data, Angel Research
May 17, 2012
5
Mahindra Lifespaces Developers | Initiating coverage
Impact of tax code has been an overhang on MWC’s
portfolio
Direct tax code, which is proposed to be implemented by March 2013 and seeks to
replace profit-based tax benefit with investment-linked incentives along with
gradual removal of other existing incentives benefiting SEZ occupants, remains the
main drag on SEZ demand in India. The proposed tax code along with the
implementation of minimum alternative tax (MAT) and dividend distribution tax
(DDT) has led to slowdown in demand for SEZ units. So far, out of the total 582
SEZs being approved, only 130 have become operational with a number of them
already cancelled or stalled.
According to JLL, considerable IT SEZ supply (Exhibit 15) is expected to become
operational over
2012-15E, thus keeping office vacancy rates elevated at
15-20% for India and around 20-30% for Chennai. However, we note that IT SEZ
supply, expected to hit markets during 2012-15E, is at a risk of getting delayed or
de-notified, which would help reduce the vacancy rates faster than expected.
Office vacancy rates are expected to peak by 2012-13E.
Exhibit 15: Strong office supply expected in India
Exhibit 16: High vacancy can pressurize rentals
(mn sqft.)
35
35
30
30
25
25
20
20
15
15
10
10
5
5
0
0
Chennai
India
IT
IT SEZ Non IT
Source: JLL
Source: JLL
Exhibit 17: Historically, IT/ITES has been the major source of demand
for office space in India, however its share has been falling
100%
90%
80%
70%
60%
50%
40%
30%
20%
10%
0%
2005
2006
2007
2008
2009
2010
IT/ITES
BFSI
Manufacturing/Industrial
Others
Source: JLL
May 17, 2012
6
Mahindra Lifespaces Developers | Initiating coverage
Being conservative in our outlook for MWC is the key
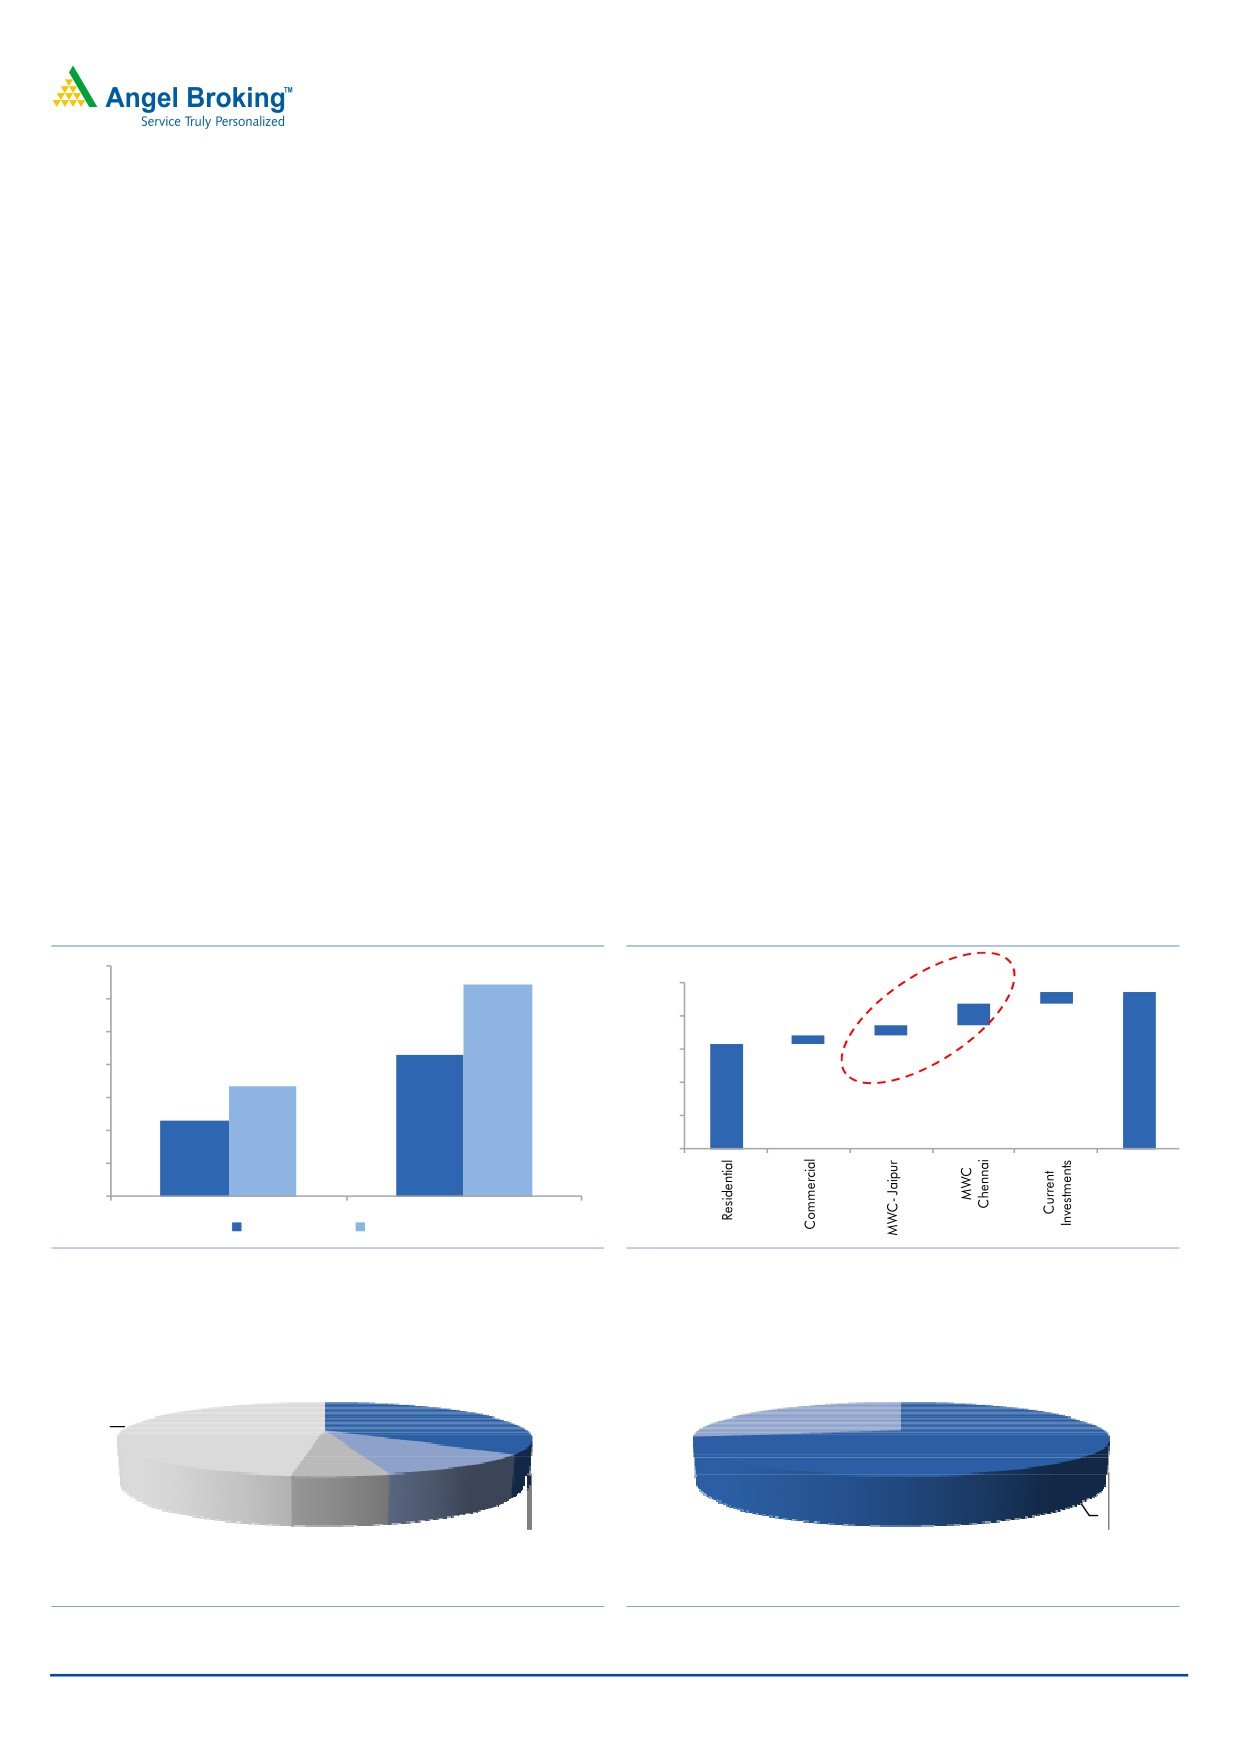
The MWC portfolio is more critical to MLIFE’s stock than its financials suggest. The
MWC portfolio (Jaipur and Chennai) formed only ~29% of total consolidated
book value as of FY2011; but when we consider the invested capital, it forms
~53% of total capital, which is because a major portion of debt is tied to the MWC
portfolio. However, MWC contributes only `97 (20.6%) to our SOTP value of `470.
Therefore, we hold that any positive surprises in leasing activity (acquisition of a
major client) can lead to significant rerating of the stock.
Expecting slow pick-up in leasing as our base case
Given the uncertainty related with SEZs, we expect MWC Jaipur to increase its
leasing occupancy rate to 51% by FY2014E from 41% currently, which is prudent
in our view. We also expect a 10% decline in FY2013E and nil growth in FY2014E
lease rentals. During FY2012, MWC Jaipur added five customers and signed
MoUs with a manufacturing company (DTA) and a large multinational OEM for
engineering SEZ space.
For MWC Chennai, which is relatively a mature investment with 92% of industrial
area already leased out as of FY2012, we expect occupancy to remain constant at
92% going forward, with nil rental rate growth during FY2013E and FY2014E.
During FY2012, MWC Chennai added four new customers and signed MoUs with
five more customers.
Exhibit 18: MWC portfolio forms ~53% of MLIFE’s
Exhibit 19: ...but contributes only `97 to our SOTP
invested capital*...
value of `470
35%
32%
31
500
68
470
30%
29
400
27
25%
315
21%
300
20%
17%
200
15%
12%
100
10%
-
5%
0%
Book Value
Invested Capital
MWC Chennai
MWC Jaipur
Source: Company, Angel Research *FY2011 book value
Source: Company, Angel Research
Exhibit 20: MWC Chennai - Area statement (822 acres)
Exhibit 21: MWC Jaipur - Area statement (1,350acres)
IT SEZ
DTA
DTA
35%
28%
48%
Apparel
Auto
SEZ
and
Ancillary
72%
Fashion
SEZ
SEZ
11%
6%
Source: Company, Angel Research
Source: Company, Angel Research
May 17, 2012
7
Mahindra Lifespaces Developers | Initiating coverage
Can we expect a policy reversal?
SEZ’s contribution to exports has been a crucial source of exports
growth and FDI
We take slow demand pick-up and minor downward pressure on rentals during
FY2013 and FY2014E as our base case scenario and assume tax code will impact
demand for SEZs going forward. However, we do not completely rule out the
possibility of some sort of deferment/modification of the tax code or some other
form of sops to encourage SEZ investments, even though the probability remains
quite low currently. In spite of the controversies surrounding SEZ’s land acquisition
and tax revenue loss to the government, it is very hard to ignore the benefits of
SEZs, especially given:
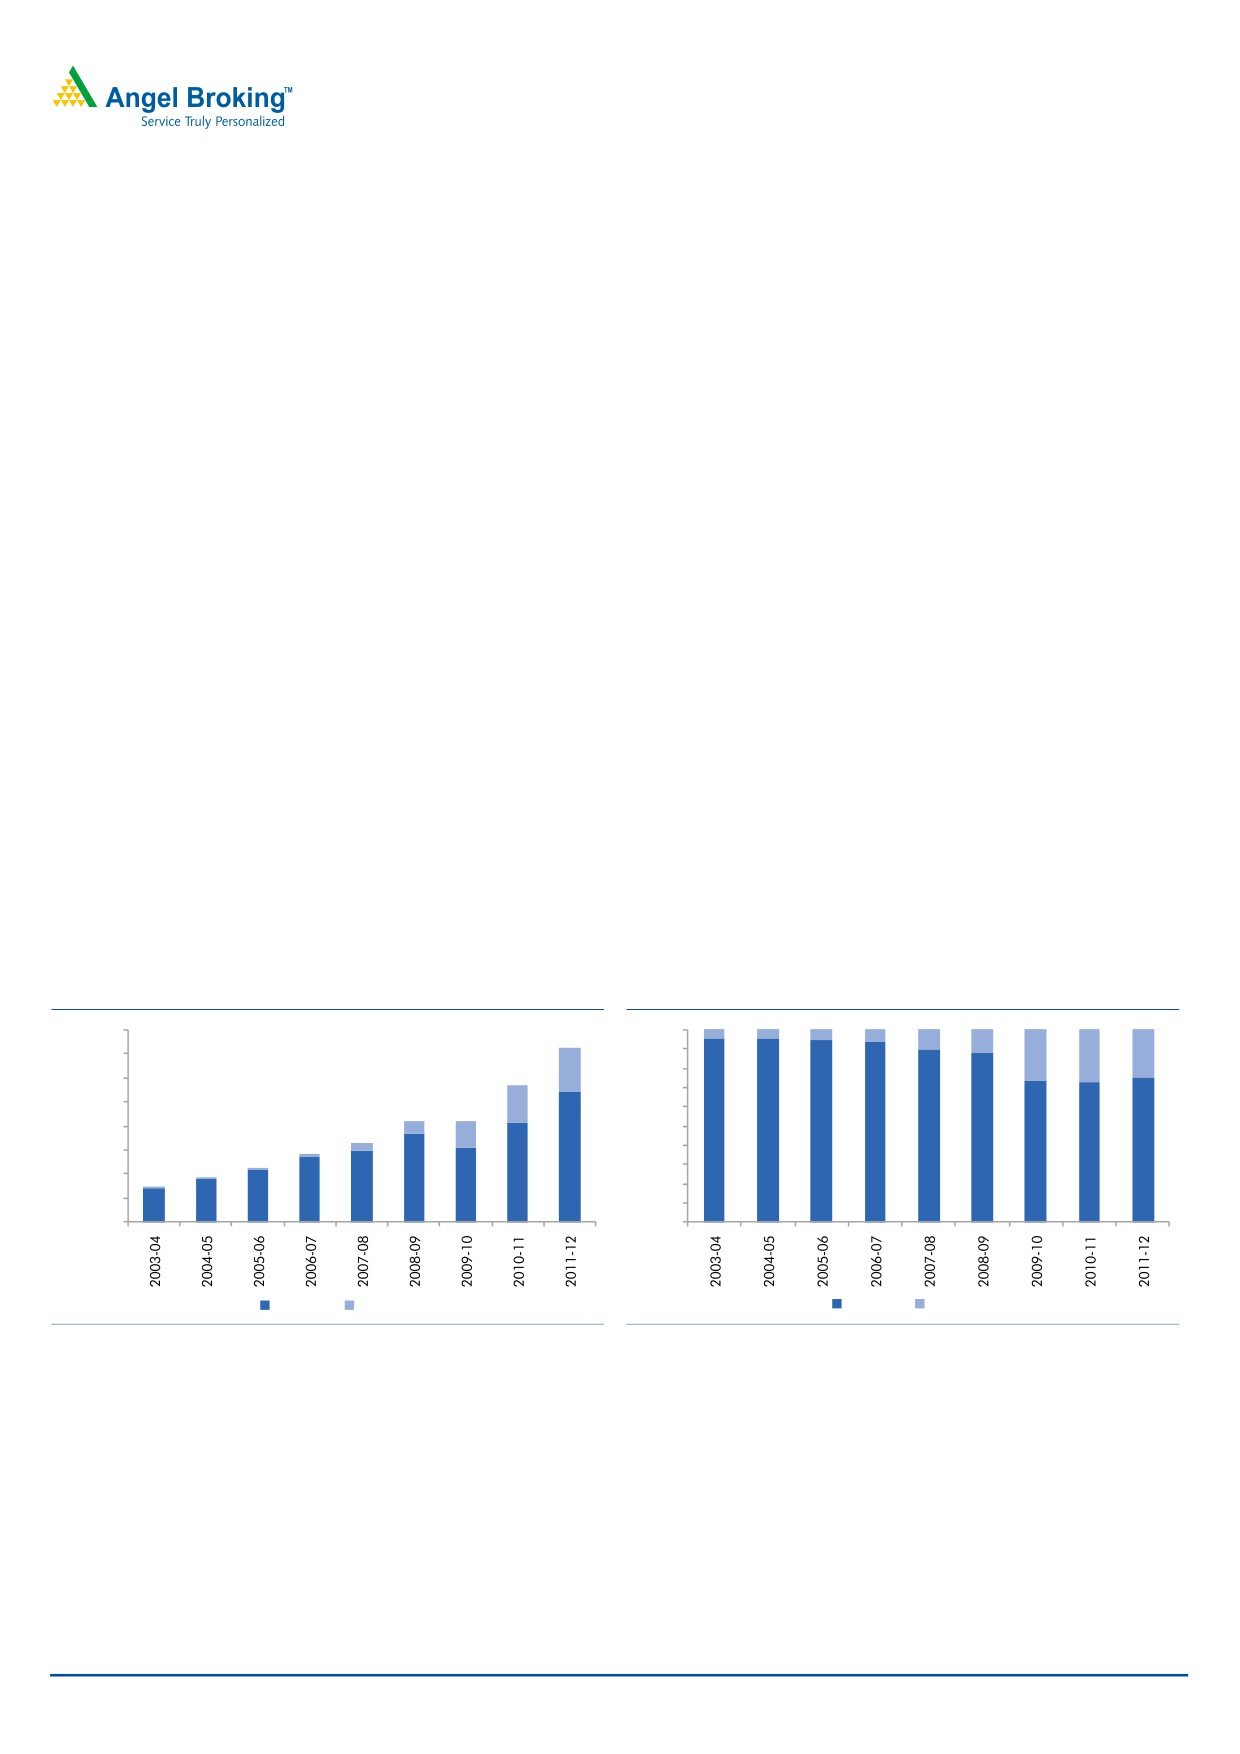
SEZs quickly started contributing to India’s total exports since the act was passed,
touching a high of 28% as of FY2011, but dropped to 25% in FY2012.
Apart from exports contribution and net foreign exchange that SEZs have been
earning in the past, it has also been a major source of FDIs, touching a high
of 26% of total FDI in FY2011, but later crashing to only 8% in FY2012.
Although we take implementation of direct tax code and sluggish demand for SEZs
as our base case scenario and see any changes or reversal in the policy towards
SEZs as highly unlikely as of now, we highlight that a policy reversal (though the
chances are low) will act as a major upside risk to our forecast and can lead to
significant rerating, especially given the contribution of MWC’s portfolio (Exhibit 18
and 19) to MLIFE and its levered nature.
Exhibit 22: SEZs contributed swiftly to total export
Exhibit 23: However, export contribution has decreased
growth as soon as the SEZ act was passed
lately owing to uncertain tax environment
16,000
100%
14,000
90%
80%
12,000
70%
10,000
60%
8,000
50%
6,000
40%
30%
4,000
20%
2,000
10%
-
0%
Exports
Exports from SEZ
Exports
Exports from SEZ
Source: RBI, Angel Research
Source: RBI, Angel Research
May 17, 2012
8
Mahindra Lifespaces Developers | Initiating coverage
Exhibit 24: SEZs have been a major source of forex
Exhibit 25: FDI in SEZs has taken a beating in FY2012
reserves in the past through exports and FDI
70
6.0
30%
54
60
5.0
25%
50
52
40
50
4.0
20%
30
48
3.0
15%
20
46
10
2.0
10%
44
-
42
1.0
5%
(10)
(20)
40
-
0%
(30)
38
2009
2010
2011
2012
Forex Reserves yoy
` Spot
FDI from SEZs ($ Bn)
% of total FDI
Source: Bloomberg ,RBI Angel Research
Source: Ministry of Commerce, RBI, Angel Research
*Upward movement denotes ` depreciation
May 17, 2012
9
Mahindra Lifespaces Developers | Initiating coverage
MLIFE: Expectations in brief
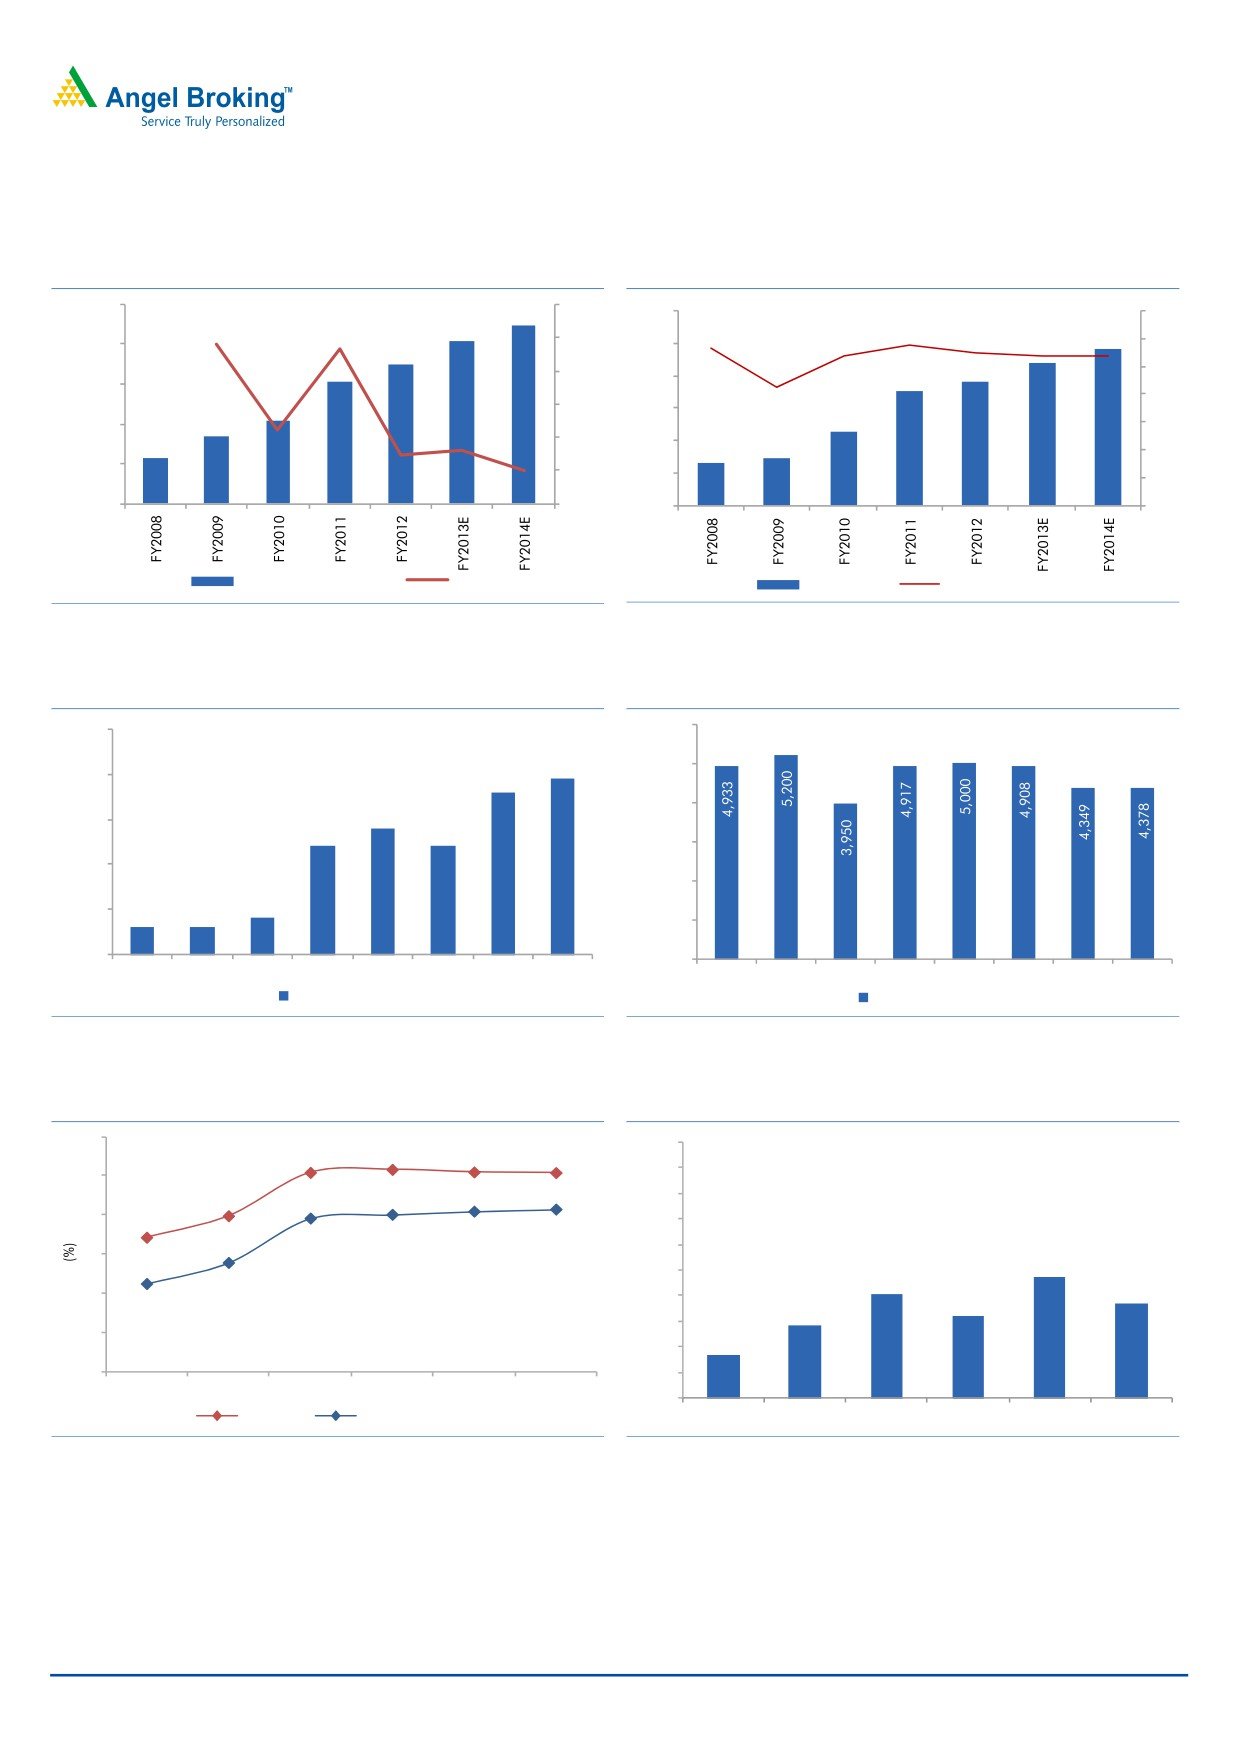
Exhibit 26: Revenue and revenue growth
Exhibit 27: MLIFE: EBITDA and EBITDA margin
1,000
60.0
300
35
50.0
30
800
250
40.0
25
200
600
20
30.0
150
400
15
20.0
100
10
200
10.0
50
5
-
0.0
0
0
Operating income
% chg
EBITDA
EBITDA Margin %
Source: Company, Angel Research
Source: Company, Angel Research
Exhibit 28: MLIFE: Sales volume (mn sq. ft.)
Exhibit 29: MLIFE: Average price realizations
2.5
6,000
2.0
5,000
2.0
1.8
4,000
1.4
1.5
1.2
1.2
3,000
1.0
2,000
0.4
0.5
0.3
0.3
1,000
-
-
2007
2008
2009
2010
2011
2012
2013E
2014E
2007
2008
2009
2010
2011
2012
2013E
2014E
Sales Volume (Mn Sqft)
Price (per Sqft)
Source: Company, Angel Research
Source: Company, Angel Research
Exhibit 30: MLIFE: RoE and RoIC
Exhibit 31: MLIFE: Net debt to equity
12
0.5
10
10.2
10.3
10.2
10.1
0.5
0.4
8.2
8
8.0
8.3
7.9
7.8
0.4
6.8
0.3
6
5.6
0.2
0.3
0.2
4.5
0.2
4
0.2
0.2
0.1
0.2
2
0.1
0.1
0
0.1
FY09
FY10
FY11
FY12E
FY13E
FY14E
0.0
ROE
ROIC (post tax)
FY2009
FY2010
FY2011
FY2012
FY2013E FY2014E
Source: Company, Angel Research
Source: Company, Angel Research
May 17, 2012
10
Mahindra Lifespaces Developers | Initiating coverage
MLIFE: Operational snapshot
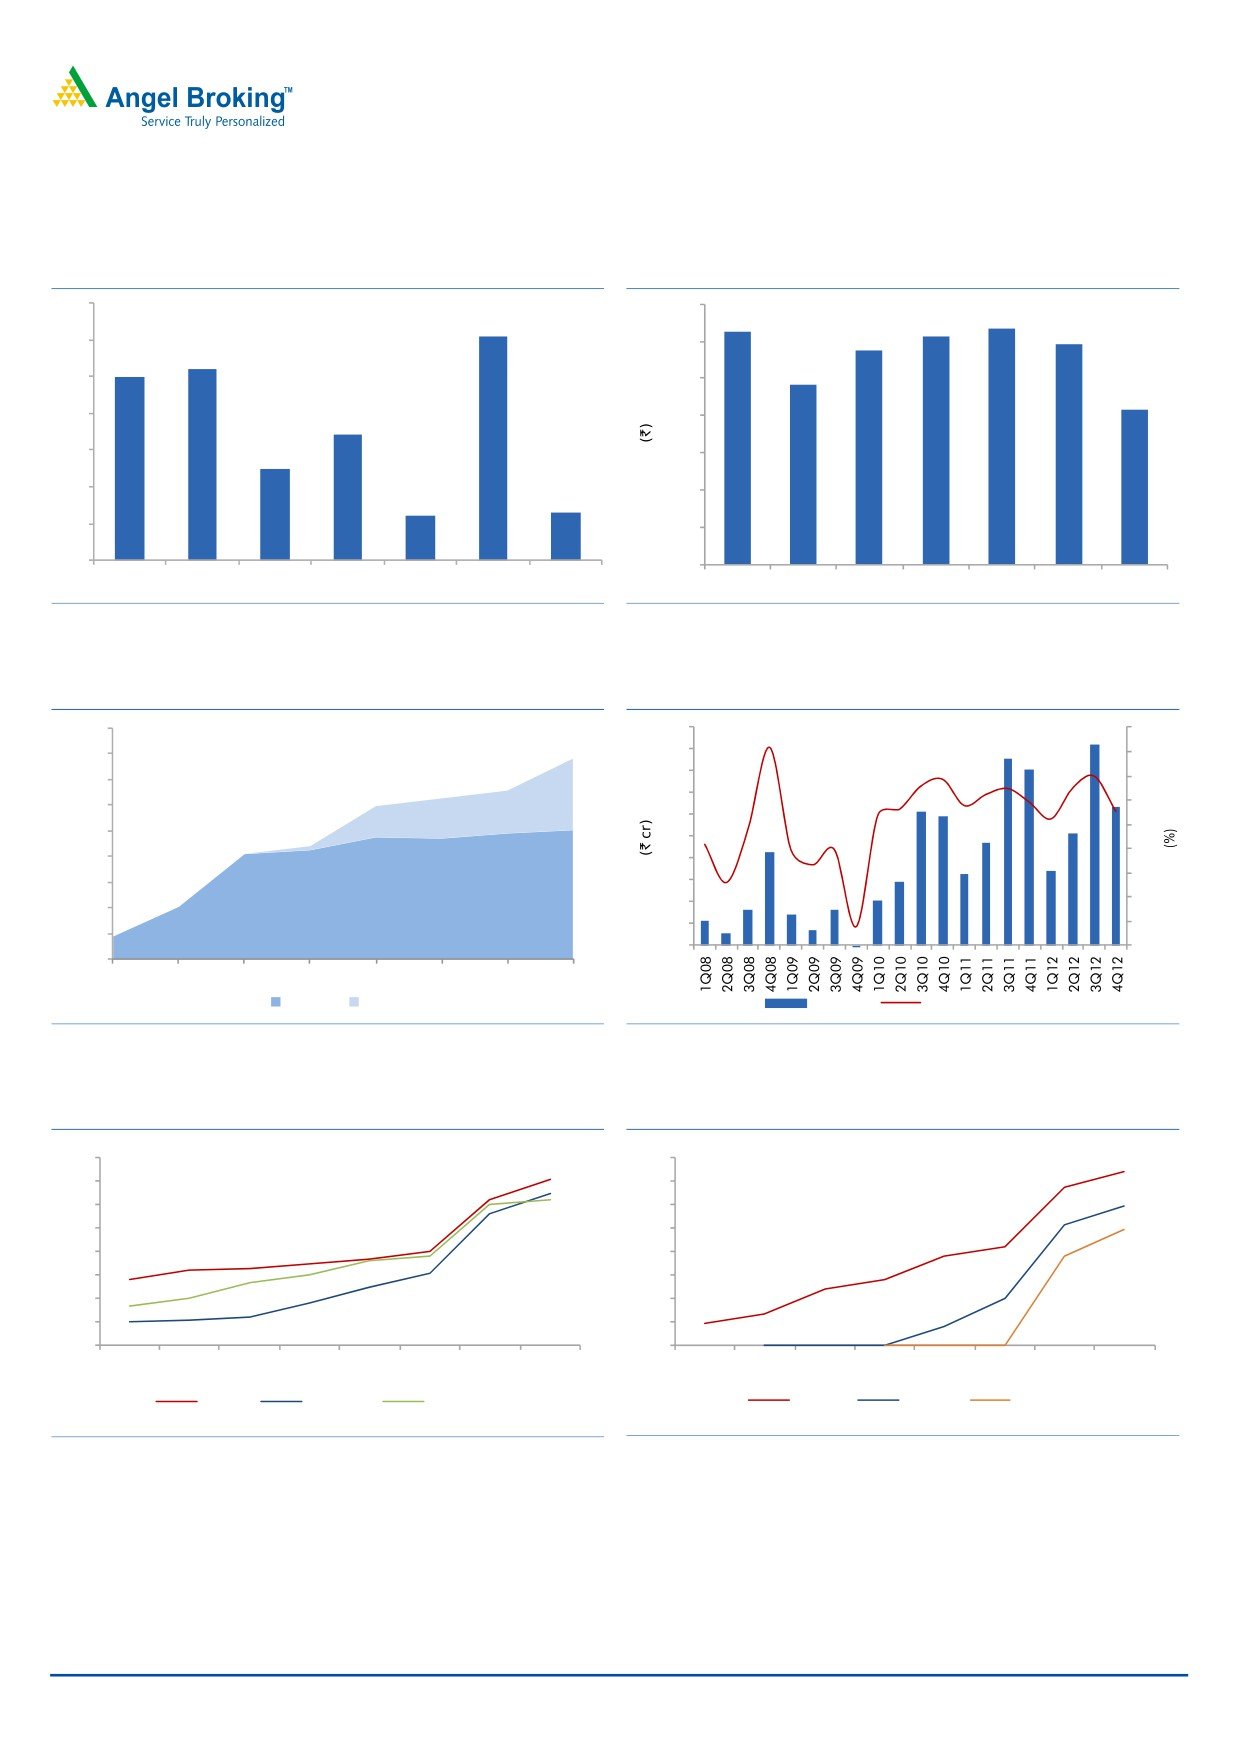
Exhibit 32: MLIFE: Area sold (mn sq. ft.)
Exhibit 33: MLIFE: Average sales realization
0.7
5500
0.6
5000
0.5
4500
0.4
4000
0.3
3500
0.2
3000
0.1
2500
0
2000
2Q11
3Q11
4Q11
1Q12
2Q12
3Q12
4Q12
2Q11
3Q11
4Q11
1Q12
2Q12
3Q12
4Q12
Source: Company, Angel Research
Source: Company, Angel Research
Exhibit 34: MWC: Area leased (acres)
Exhibit 35: MLIFE: Quarterly EBITDA margin
1800
50
40
1600
45
35
40
1400
30
35
1200
25
30
20
1000
25
15
800
20
10
600
15
10
5
400
5
0
200
0
(5)
0
2005
2006
2007
2008
2009
2010
2011
2012
Chennai Jaipur
EBIDTA
EBITDA margin (RHS)
Source: Company, Angel Research
Source: Company, Angel Research
Exhibit 36: Execution schedule of Mumbai projects
Exhibit 37: Execution schedule of NCR projects
80
80
70
70
60
60
50
50
40
40
30
30
20
20
10
10
0
0
1Q11
2Q11
3Q11
4Q11
1Q12
2Q12
3Q12
4Q12
1Q11
2Q11
3Q11
4Q11
1Q12
2Q12
3Q12
4Q12
Aspen
Angelica
Splendour -II
Aura- I
Aura- II
Aura- III
Source: Company, Angel Research
Source: Company, Angel Research
May 17, 2012
11
Mahindra Lifespaces Developers | Initiating coverage
MLIFE: Operational snapshot
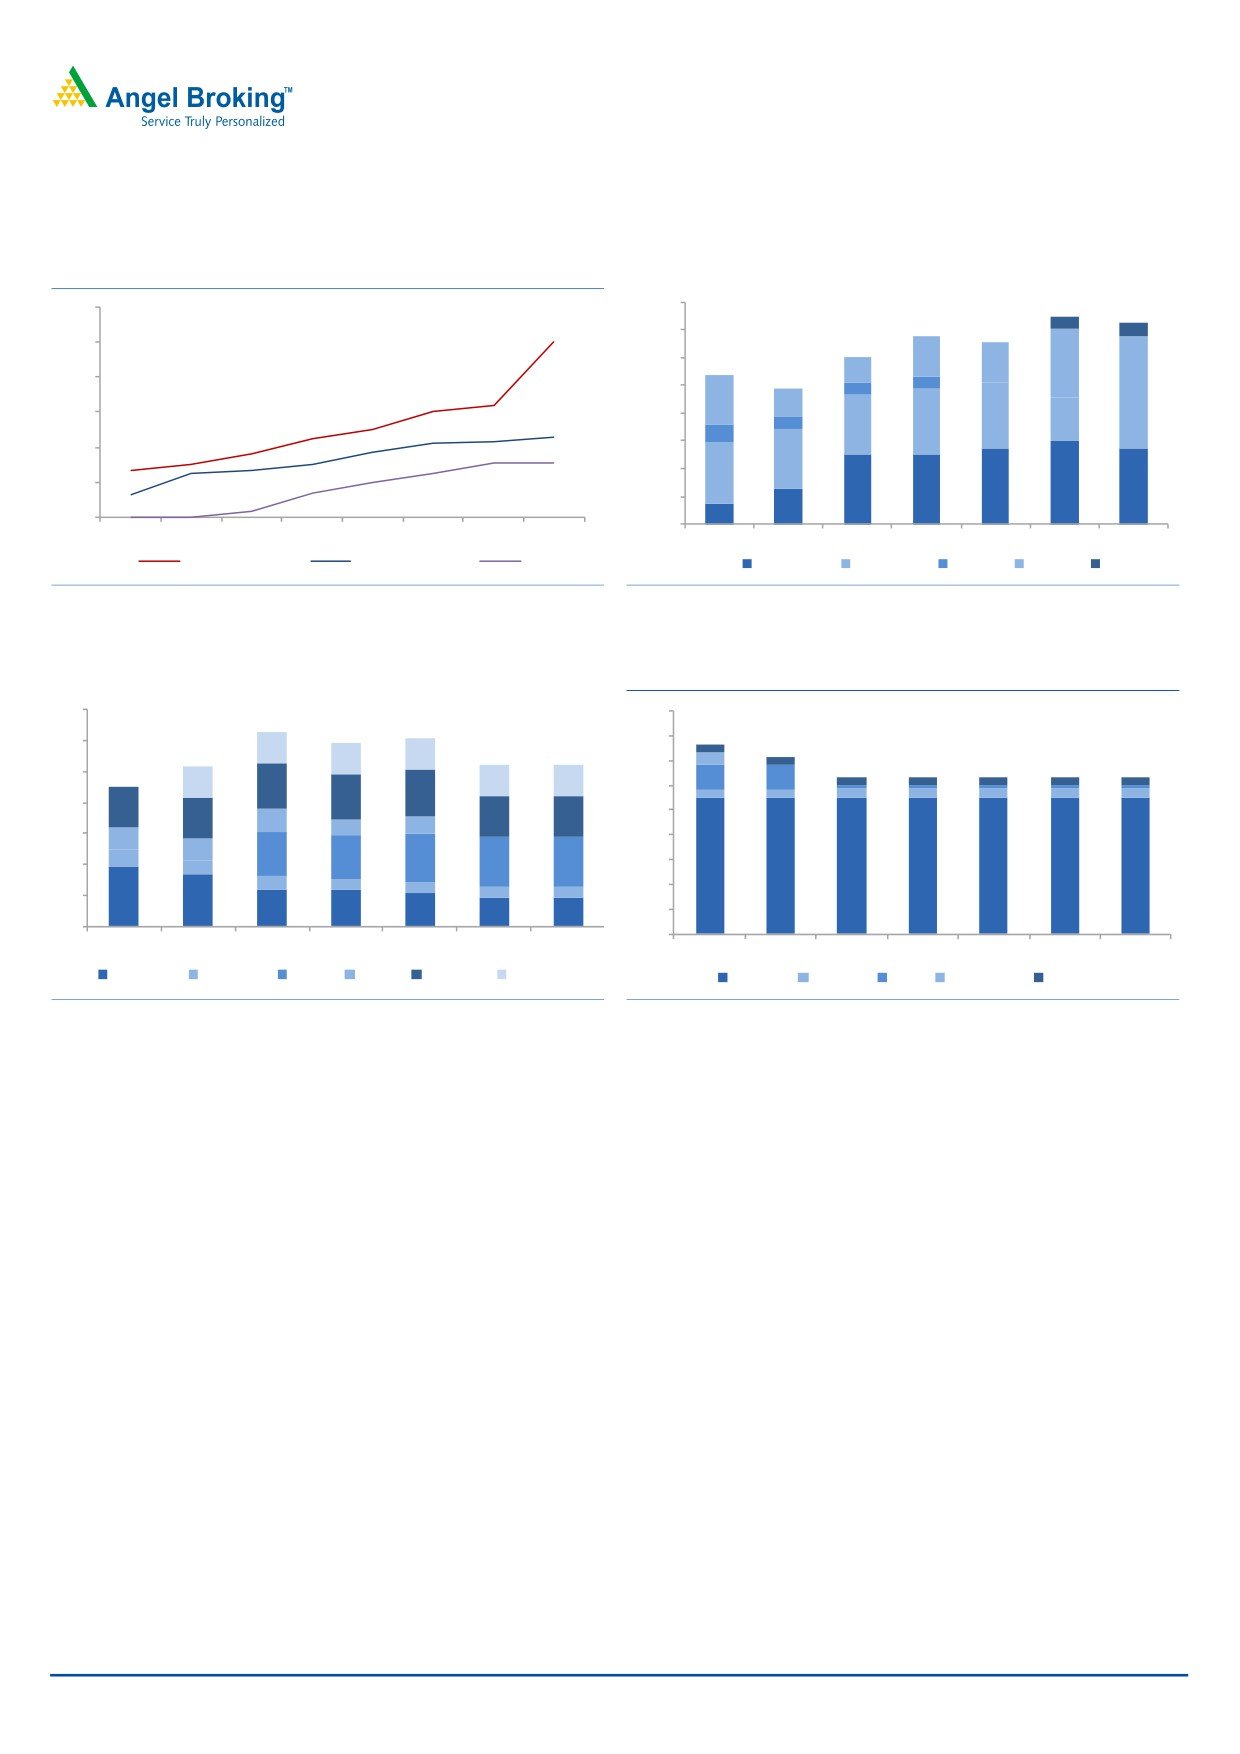
Exhibit 38: New Chennai: Project execution schedule
Exhibit 39: Ongoing projects evolution by city (mn sqft)
4.00
120
3.50
100
3.00
80
2.50
60
2.00
1.50
40
1.00
20
0.50
0
-
1Q11
2Q11
3Q11
4Q11
1Q12
2Q12
3Q12
4Q12
2Q11
3Q11
4Q11
1Q12
2Q12
3Q12
4Q12
Aqualily Villas A
Aqualily Villas B
Iris Ph I
Chennai
Mumbai
Pune
NCR
Nagpur
Source: Company, Angel Research
Source: Company, Angel Research *represents total area of ongoing project
Exhibit 40: Forthcoming projects evolution (mn sq. ft.)
Exhibit 41: Land bank evolution by city (mn sq. ft.)
7
18
16
6
14
5
12
4
10
3
8
2
6
4
1
2
0
0
2Q11
3Q11
4Q11
1Q12
2Q12
3Q12
4Q12
2Q11
3Q11
4Q11
1Q12
2Q12
3Q12
4Q12
Chennai
Mumbai
Pune
NCR
Nagpur
Hyderabad
Chennai
Mumbai Pune Hyderabad
Nasik
Source: Company, Angel Research
Source: Company, Angel Research
May 17, 2012
12
Mahindra Lifespaces Developers | Initiating coverage
Valuation
We value MLIFE on SOTP basis using NAV approach for its standalone business
and value its subsidiaries on NAV/Cap Rate/BV basis and arrive at an SOTP value
of `470. We apply a 20% discount to our SOTP value to arrive at our target price
of `376, suggesting an upside of 21% from current levels. MLIFE is currently
trading at PB (FY2014E) of 0.9x, with our target price of `376, suggesting a PB
(FY2014E) of 1.1x.
Real estate development business contributes `315/share
We have valued MLIFE’s real estate business using the NAV approach, where we
value the company’s standalone as well as subsidiary residential projects
individually. We have assumed cost of equity of 16.9% (Beta - 1.2; risk-free rate -
8.5%; and risk premium - 7.0%), cost of debt of 12% and arrive at a WACC of
13.3%.
MWC (Chennai and Jaipur) contributes `97/share
MWC Chennai is relatively at a more mature stage than MWC Jaipur, with ~92%
of industrial area leased. We value MWC by applying a capitalization rate of 8%
on its FY2014E operating income and discounting it back. Similarly, for MWC
Jaipur, we apply a capitalization rate of 8% on its FY2016E operating income and
then discount it back. Despite valuing the MWC portfolio cautiously, we have
arrived at a potential upside of 21%, which suggests that the stock might already
have priced in an adverse impact of removal of tax benefits.
We initiate coverage of MLIFE with a Buy rating and a target price of `392.
Exhibit 42: MLIFE: SOTP breakdown
Valuation method
MLIFE value
Value/share
Residential
NAV
1,286
315
Commercial
Cap rate of 8%
109
27
MWC- Jaipur
Cap rate of 8%
119
29
MWC Chennai
Cap rate of 8%
278
68
Current Investments
Book Value
128
31
SOTP
470
Target price (20% Disc. to NAV)
376
CMP
312
Upside
21%
Source: Angel Research, Company
May 17, 2012
13
Mahindra Lifespaces Developers | Initiating coverage
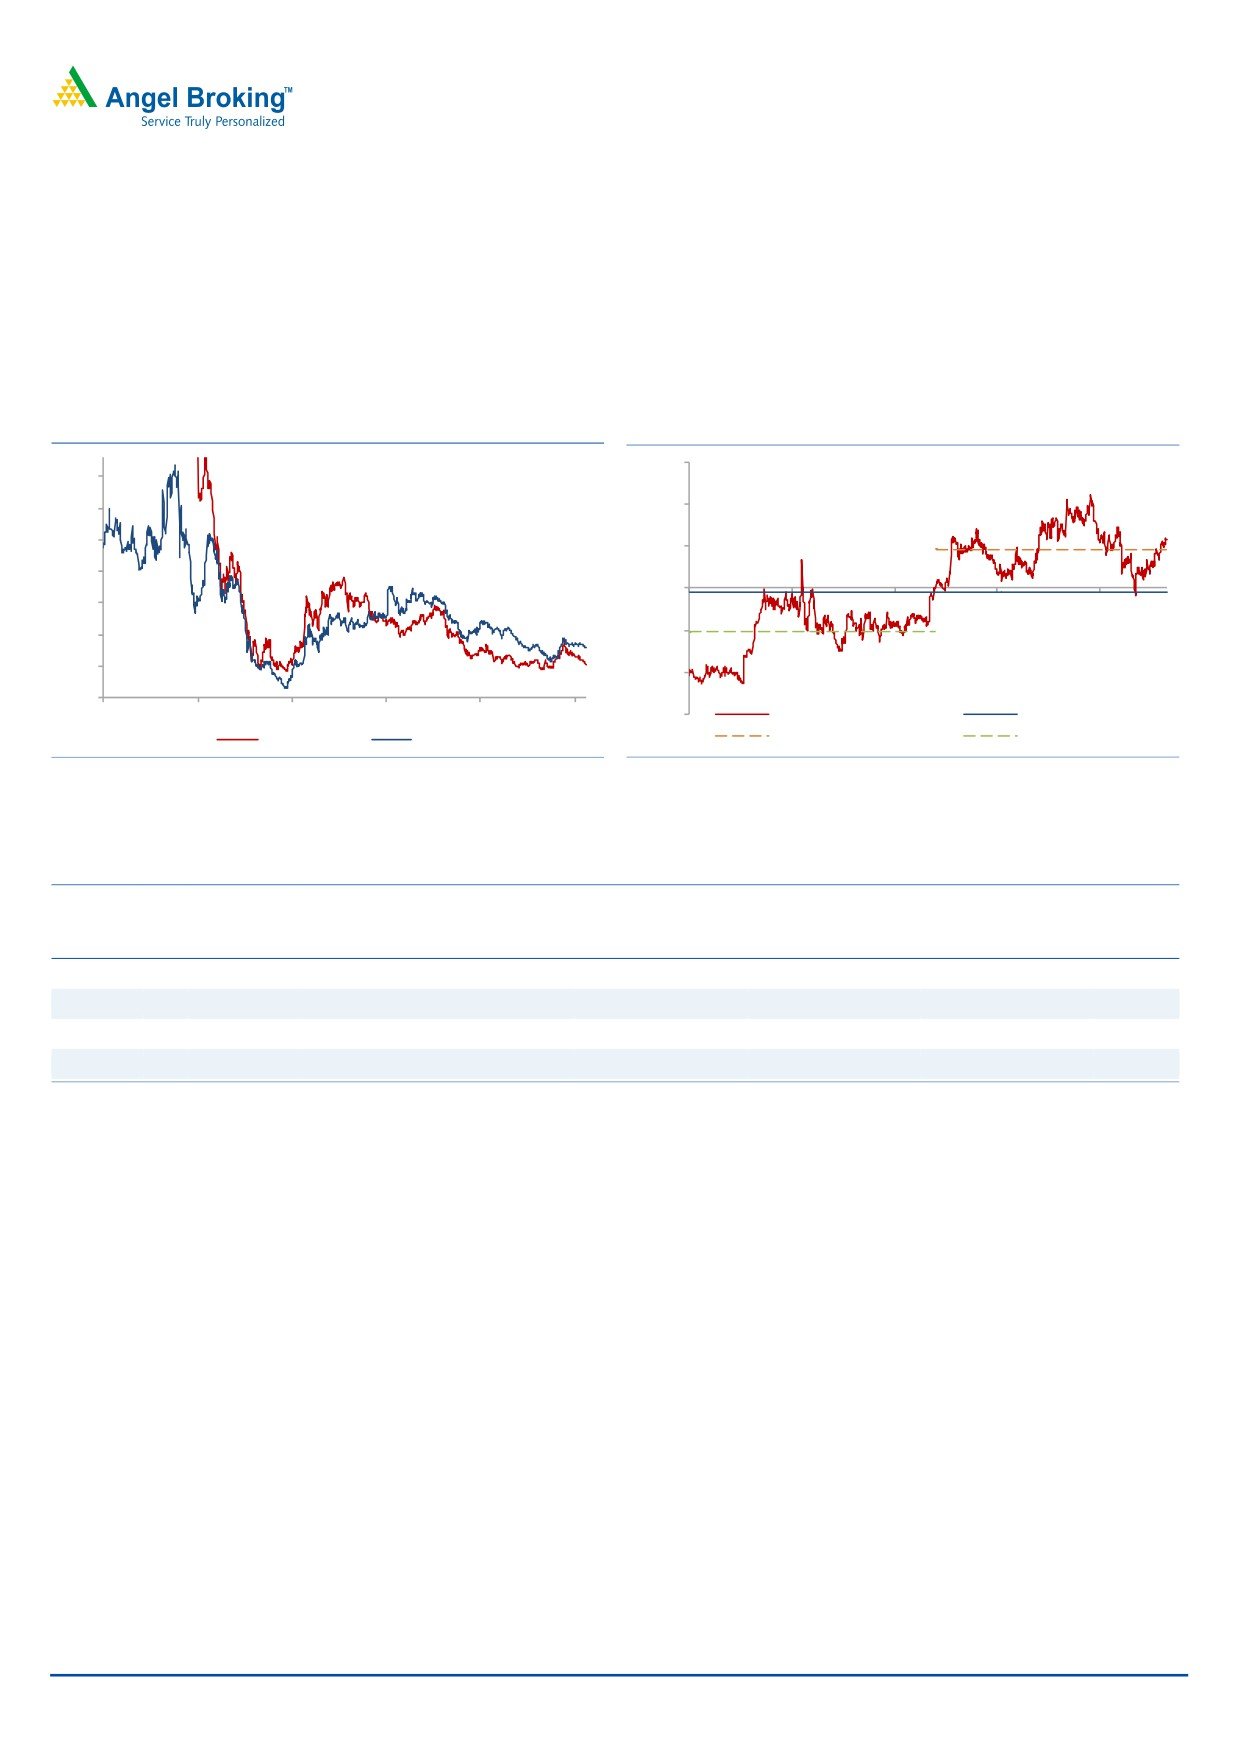
MLIFE deserves a premium to BSE Realty, in our view
Given MLIFE’s strong balance sheet, good corporate governance and brand name
along with strong parent backing, we are of the opinion that MLIFE deserves to
trade at a premium to sector average, especially given the corporate governance
concerns regarding the real estate sector.
Exhibit 43: One-year forward PB
- MLIFE vs. BSE
Exhibit 44: MLIFE deserves a premium to BSE Realty -
Realty Index
Currently trading at 35% premium
90
3.7
3.2
60
2.7
30
2.2
-
1.7
Sep
-07
Sep-08
Sep-09
Sep-10
Sep-11
1.2
(30)
0.7
(60)
0.2
Apr-07
Apr-08
Apr-09
Apr-10
Apr-11
Apr-12
(90)
Prem.
Average
BSE Realty*
MLIFE
Average since Feb'10
Average till feb'10
Source: Company, Angel Research, Bloomberg *Bloomberg Consensus
Source: Company, Angel Research, Bloomberg
numbers
Exhibit 45: MLIFE vs. peers
Market Net Debt to EBITDA Net Debt to Equity
ROE
P/Book
P/Earnings
Cap
Price
FY2013E FY2014E FY2013E FY2014E FY2013E FY2014E FY2013E FY2014E FY2013E FY2014E
(` cr)
MLIFE
312
1,266
1.4
1.0
0.2
0.2
10.2
10.1
1.0
0.9
10.0
9.2
DLF
182
31,216
5.6
4.4
1.0
0.9
6.3
8.4
1.2
1.1
19.0
13.5
HDIL
62
2,581
3.5
3.1
0.4
0.4
8.0
8.7
0.2
0.2
2.9
2.5
Anant Raj
51
1,505
2.4
1.7
0.2
0.2
6.1
8.5
0.4
0.3
6.1
4.0
Source: Company, Angel Research
May 17, 2012
14
Mahindra Lifespaces Developers | Initiating coverage
Key risks
MLIFE’s projects in Chennai are based in MWC - Chennai. Therefore, their
performance is linked to MWC Chennai’s leasing activity. Any decline/slow
growth in MWC Chennai leasing will adversely impact its Chennai projects
and value of its 11 mn sq. ft. land bank.
Delays in getting project and land approvals will lead to slowdown in future
launches, which would impact sales.
Slower-than-expected execution will delay MLIFE’s revenue recognition and
negatively impact its brand name.
Failure of any meaningful rate cuts by HFCs and banks will lead to muted
housing demand for MLIFE.
Better-than-expected leasing in MWC brands, especially MWC Jaipur, poses
an upside risk to the target price, as we have conservatively valued MWC’s
portfolio.
May 17, 2012
15
Mahindra Lifespaces Developers | Initiating coverage
Company overview
Mahindra Lifespaces Developers (MLDL), a 51% owned subsidiary of Mahindra
and Mahindra Group, is in the business of real estate development, with a focus
on residential projects and integrated infrastructure developments such as business
cities, industrial parks and SEZs. MLDL has till date developed ~7mn sq. ft. of
residential projects in cities like Mumbai, Pune, NCR, Chennai and is expanding its
presence to cities like Hyderabad, Nagpur and Nasik by increasing its focus on the
premium and mid-market segments. The company has also announced its plans to
enter the affordable housing segment in tier-2 cities.
MLDL is also present in integrated development space, with two operational
projects through its subsidiaries - MWC Jaipur and MWC Chennai. These are
spread over an area of ~4,200 acres with presence of SEZs and DTAs.
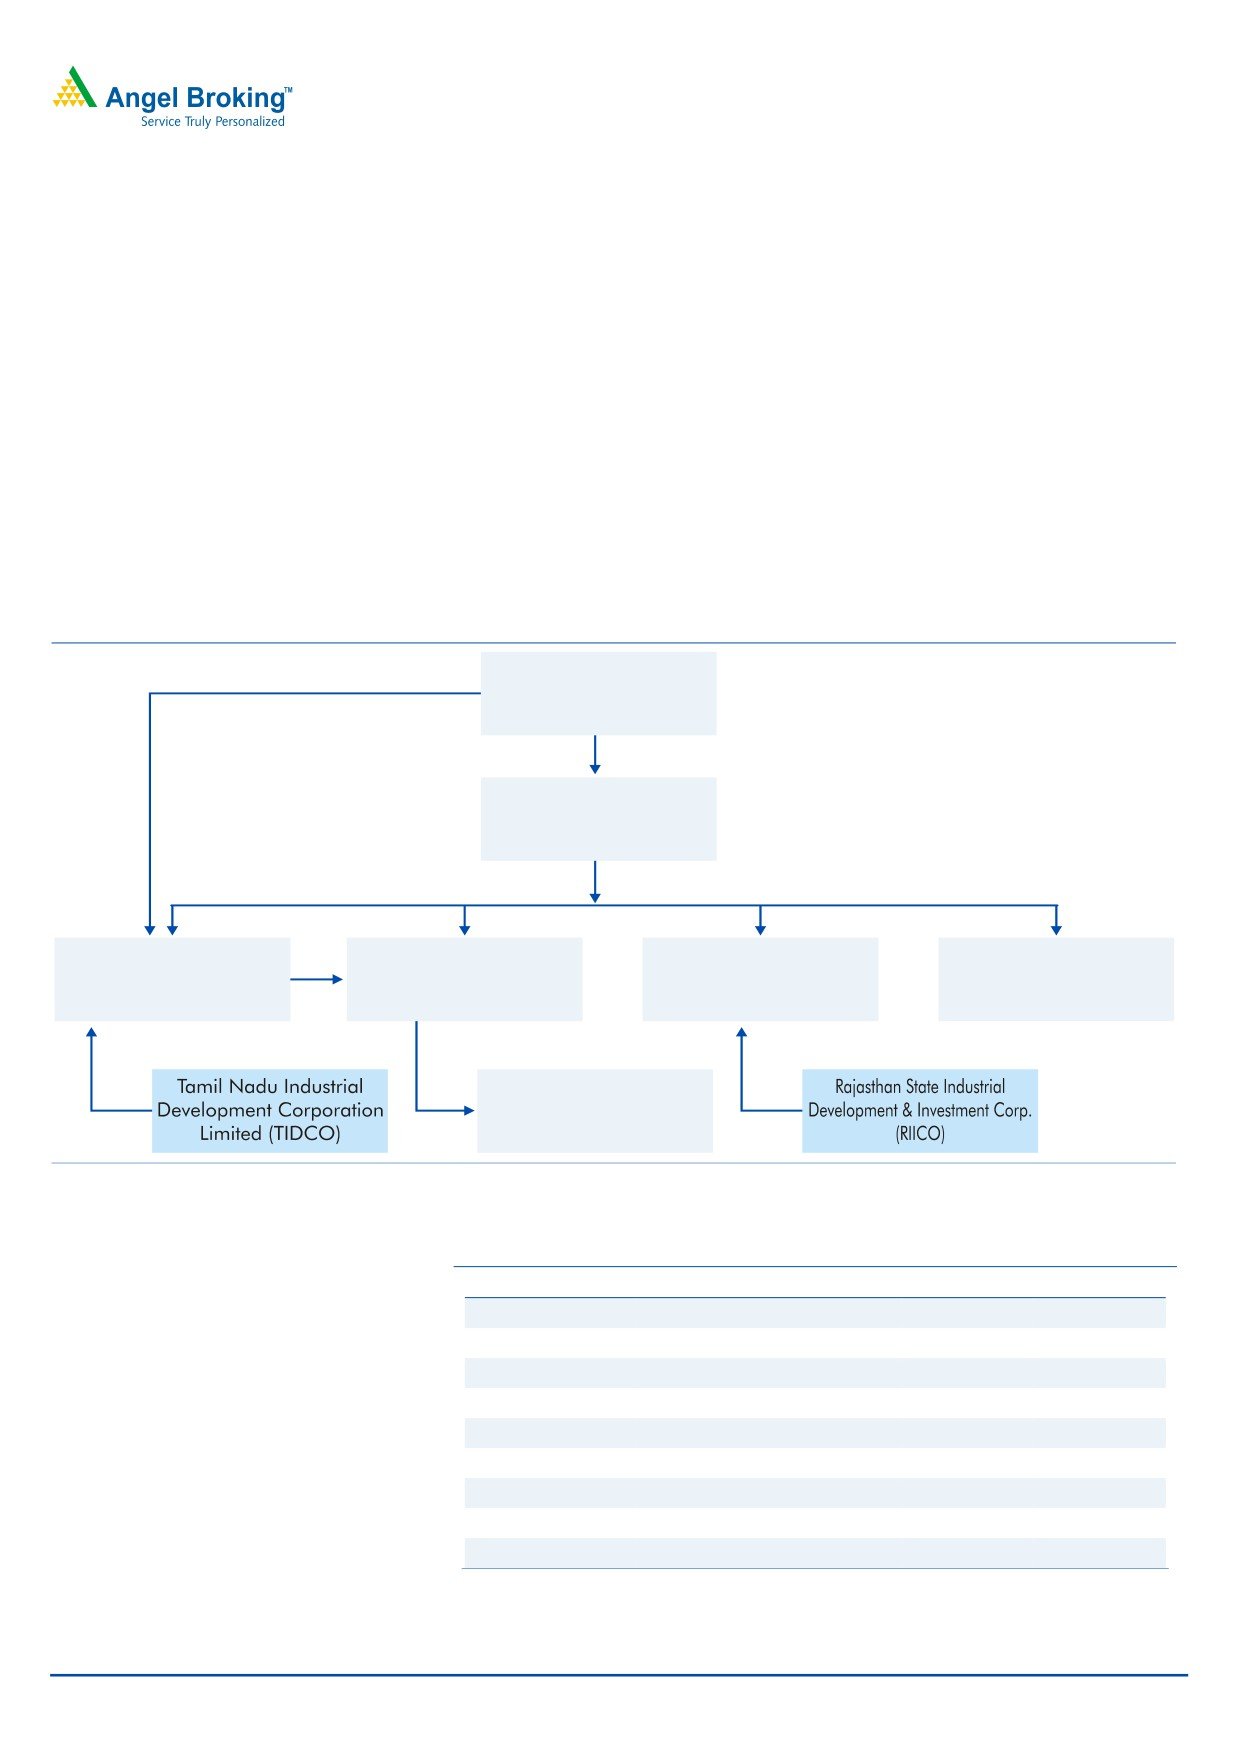
Exhibit 46: Corporate structure
Mahindra and
6%
Mahindra Group
51%
Mahindra Lifespace
Developers
(MLDL)
83%
74%
74%
70%
Mahindra World City
Mahindra Integrated
Mahindra World City
Mahindra Bebanco
26%
Developers Ltd.
Township Ltd.
(Jaipur)
Developers Ltd
(MWCDL)
(MITL)
(MWCJL)
(MBDL)
Mahindra Residential
26%
51%
11%
Developers Ltd
(MRDL)
Source: Company
Exhibit 47: MLIFE: Project snapshot
Location (mn sq. ft.)
Completed
Ongoing
Forthcoming
Land bank
Chennai
0.6
1.5
1.0
11.0
Mumbai
3.1
0.8
0.4
0.7
Pune
1.6
-
1.6
0.3
NCR
1.7
1.2
-
-
Nagpur
-
0.2
1.3
-
Hyderabad
-
-
1.0
-
Nasik
-
-
-
0.6
Bangalore
0.1
-
-
-
Total
7.0
3.8
5.2
12.6
Source: Company
May 17, 2012
16
Mahindra Lifespaces Developers | Initiating coverage
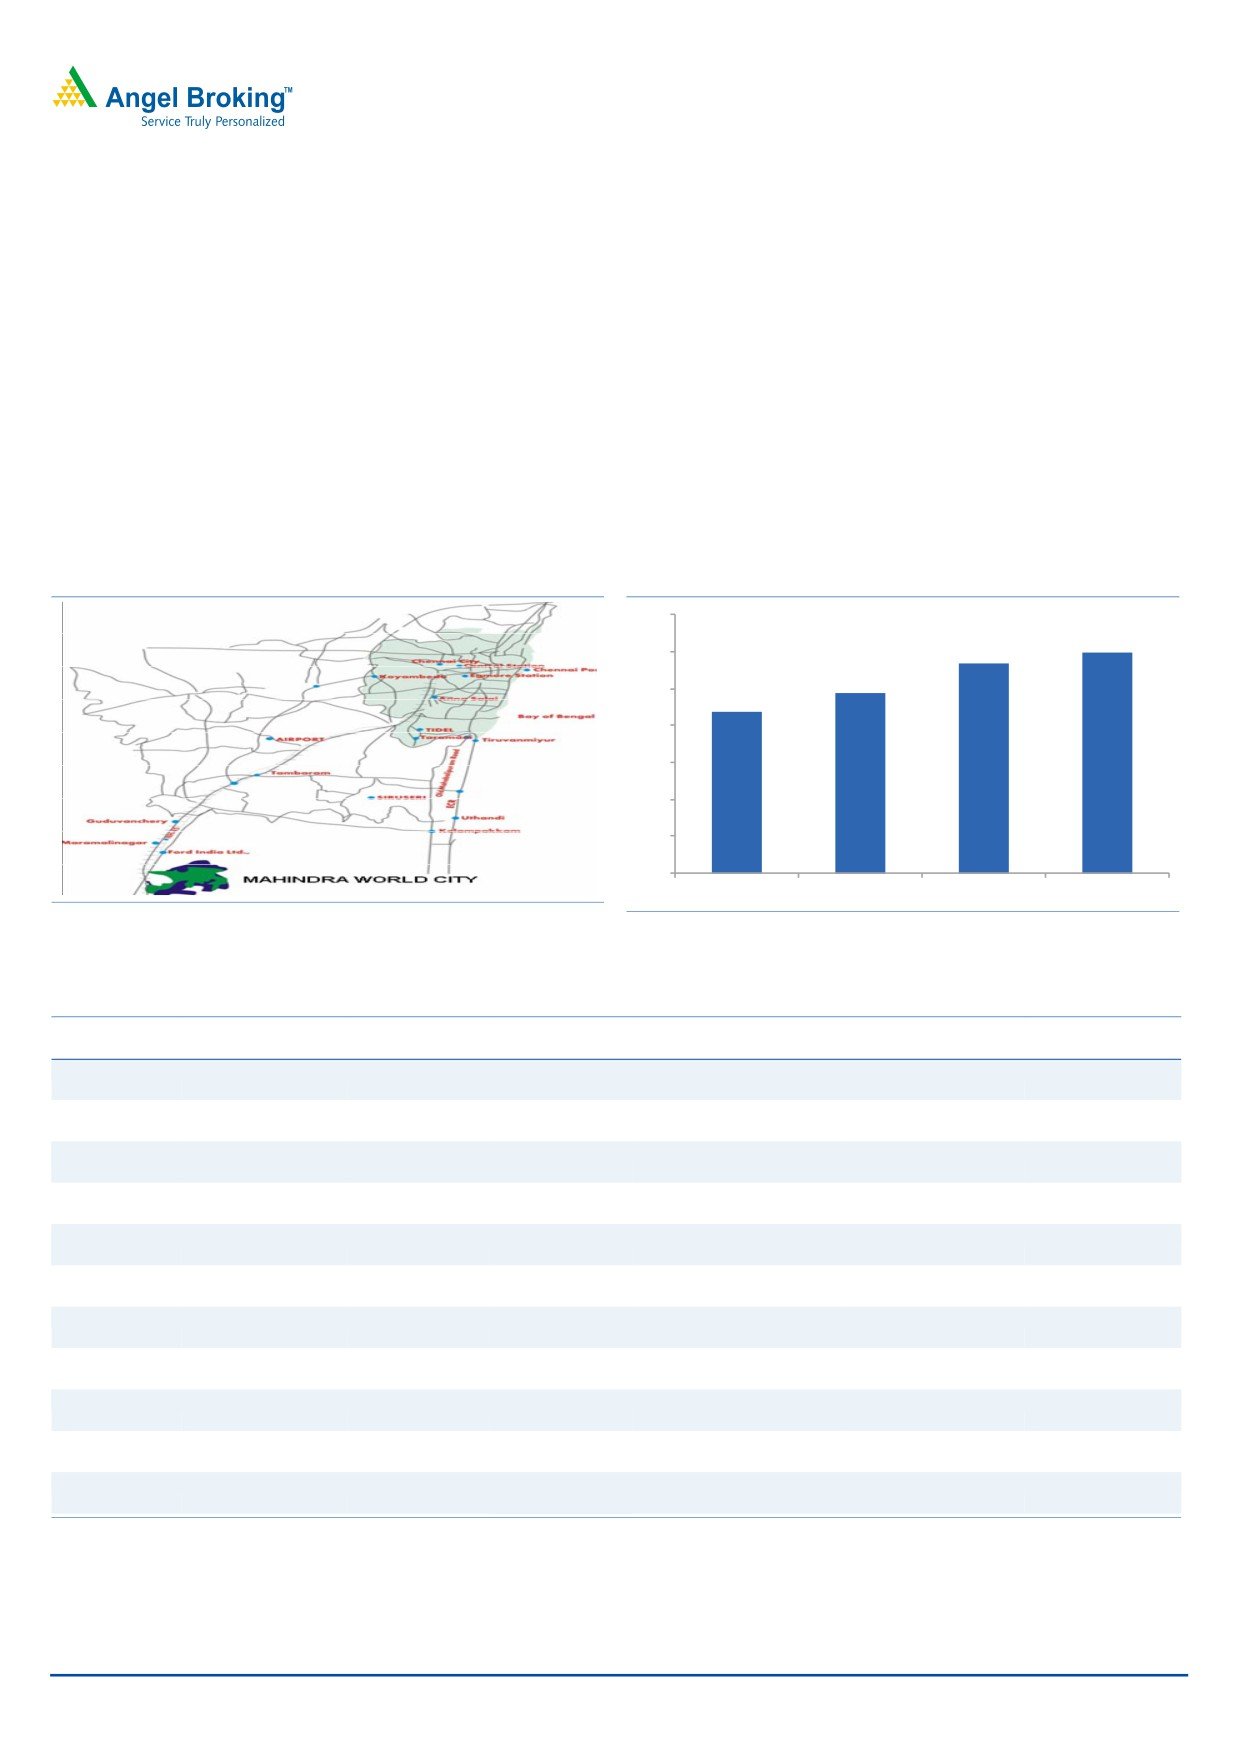
Mahindra World City (MWC) - Chennai
MWC Chennai is jointly promoted by Mahindra World City Developers Ltd.
(MWCDL) and Tamil Nadu Industrial Development Corporation Ltd. (TIDCO), with
1) three sector-specific SEZs catering to industry sectors viz. IT (services and
manufacturing), apparel and fashion accessories, and auto ancillaries; 2) a DTA;
and 3) a residential and social infrastructure zone. The project is spread across an
area of 1,550 acres (includes 100 acres expansion to cater to fresh demand).
MWCDL has signed MoUs with multi-national companies from Japan, U.S. and
Ireland in the auto ancillary sector for around 50% of the proposed expansion
area. The business zone has 60 clients, of which 28 are in SEZ and 32 are in DTA.
MWC is located on National Highway 45 and is ~60km from the Chennai city.
Exhibit 48: MWC Chennai - Location
Exhibit 49: Client base of MWC Chennai
70
60
57
60
49
50
44
40
30
20
10
0
FY2009
FY2010
FY2011
FY2012
Source: Company, Angel Research
Source: Company, Angel Research
Exhibit 50: Clients of MWC Chennai
IT SEZ
Auto SEZ
Apparel SEZ
DTA
DTA
DTA
Social
Atos Origin*
Brakes India
AI Enterprises
Alpha
Guangdong Greatoo
Netafim
Duet Hotels
Packaging
Cap Gemini
Madras
Bengal Hangers
American Axle
Husky Injection
NTN Corporation
JSP Hospitals
India
Engineering
Molding Systems
Electronic
Sundaram
Capella
Armstrong
Ingersoll Rand
Parker Hannifin
Mahindra World
Recycling
Brake Linings
Fashions
School
Helios &
Sundaram Clayton Intermode
B. Braun
JCF Valves
Sakazaki Engraving
AmelioDay Care
Matheson*
Medical
Infosys
Sundram Fasteners Leather Craft
BMW India
JSP Foams
Sanwa Synergy
BP -Petrol Station
Technologies
Mastek
Timken Engineering Linea Fashions
CII
Kryolan Cosmetics
Sharda Motor
Canopy
Industries
MindTree*
UCAL Fuel Systems Rico Group
DePuy Medical
Lincoln Electric
SMC Pneumatic
Company
Renault Nissan*
Srinivasa
Federal Mogul
Mahindra & Mahindra
Tesa Tapes India
Fashions
Tech Mahindra*
Slam Apparel
Freight Systems
Milton Roy India
Tridon Automotive
VIPL
Timex Garments
Fujitec India
Musashi Paints
TTK Healthcare
Wipro
Galipoglu
Mecaplast India
Hidromas
Source: Company
May 17, 2012
17
Mahindra Lifespaces Developers | Initiating coverage
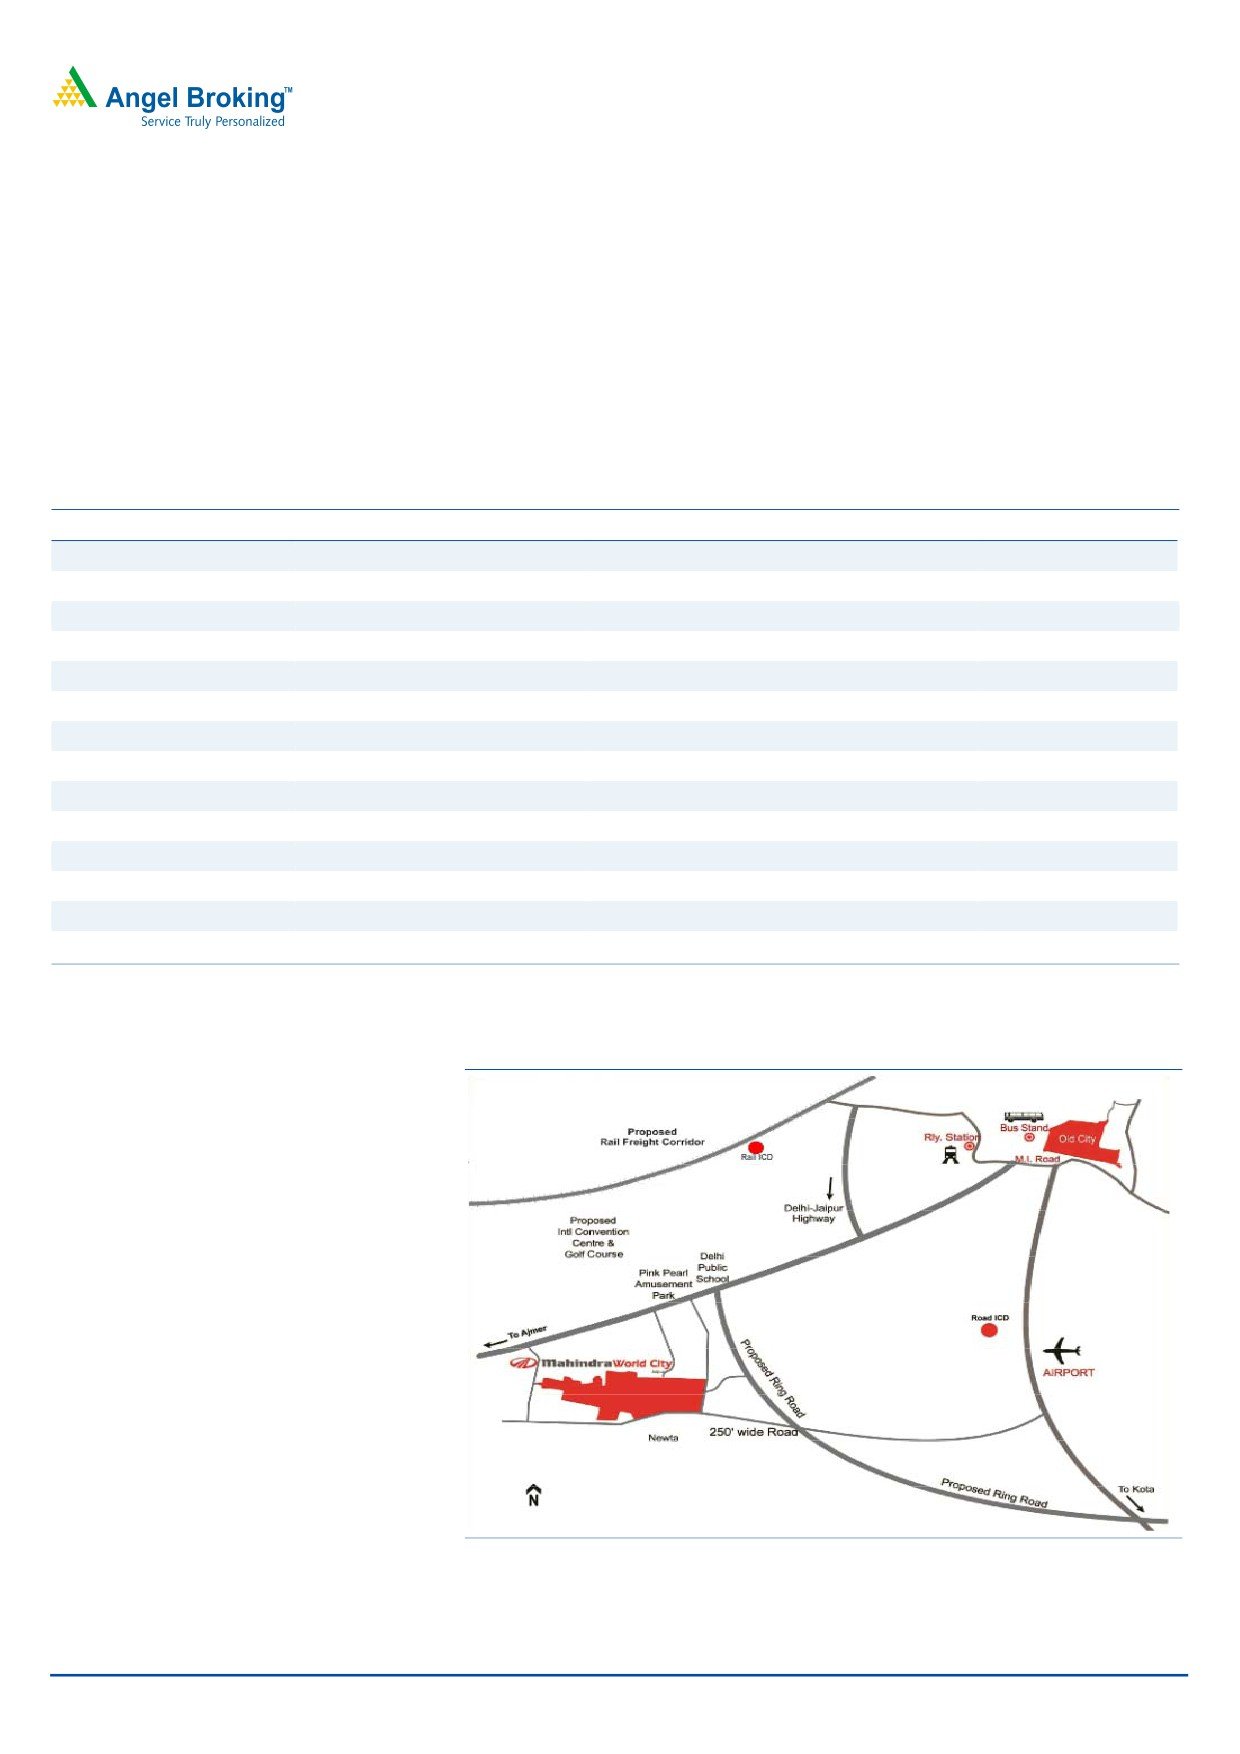
MWC Jaipur
MWC Jaipur is a 74-26 joint venture between MLIFE and Rajasthan State Industrial
Development and Investment Corporation Limited (RIICO). It is being developed as
a multi-product SEZ and DTA across 3,000 acres. The project has received
notifications for three SEZs - IT/ITeS, light engineering (including automotive and
auto components) and handicrafts; and formal approval for two more SEZs,
namely gems and jewelry (25 acres) and IT/ITeS (86 acres). MWC Jaipur also
plans to expand in segments like apparel and logistics.
Exhibit 51: Clients of MWC Jaipur
IT/ITeS SEZ
Handicrafts SEZ
Engineering & Related Industries SEZ
DTA
DBOI Global Services
GAD Industries
Dynamic Powertech
ICICI Bank
EXL Service
Jaipur Crafts
Gravita
State Bank of India
SystweakSoftware
Kirat Crafts
India Agrovision
Genpact
Laxmi Ideal Interiors
KnitproInternational
Girnar Software
OrviDesign
Marsons Industries
Infosys BPO
Rajdhani Craft
Poly Medicure
Infosys Ltd.
RatanTextiles
QH Talbros
Isys Softech
Rediprint International
Tijaria International
Nagarro Sortware
Samurai Designs & Interiors
Veto Electricals
Nucleus Software
Seesham Handicraft House
Veto Polymers & Metals
Truworth KPO Services
Rama Handicrafts
Wipro
Art Age Furnishings
ConnexxionsIT Services
Rustic Furniture
Tech Mahindra
Source: Company
Exhibit 52: MWC Jaipur - Location
Source: Company, Angel Research
May 17, 2012
18
Mahindra Lifespaces Developers | Initiating coverage
Upcoming business cities
MLIFE is planning to launch two integrated business cities, in-line with its existing
MWC portfolio. The new integrated cities will be developed in Dholera (Gujarat)
and in the Northern part of Chennai. Both the projects are expected to be
launched in March 2013.
Integrated Business City, Chennai, will be spread across 1,000 acres to cater
to mid-size ancillary industries of this segment, including auto components,
electronics, precision engineering and logistics. The company has already
acquired 50% of land requirements. The land is being acquired through
private negotiations.
Integrated Business City, Dholera, Gujarat will be spread across 2,500 acres
and will be located on the proposed Delhi Mumbai industrial corridor. Land
acquisition will be facilitated by the Gujarat government.
May 17, 2012
19
Mahindra Lifespaces Developers | Initiating coverage
Profit and Loss Account (Consolidated)
Y/E March (` cr)
FY2009
FY2010
FY2011
FY2012E
FY2013E
FY2014E
Operating income
342
418
612
701
814
897
% chg
47.9
22.3
46.4
14.6
16.1
10.2
Operating Expenses
229
253
366
427
498
548
Personnel
14
18
23
29
34
38
Other
26
34
47
53
63
69
Total Expenditure
269
305
436
510
595
655
EBITDA
73
113
176
191
219
242
% chg
10.9
55.3
56.6
8.5
14.5
10.4
(% of Net Sales)
21.2
27.0
28.8
27.3
26.9
27.0
Depreciation
(4)
7
8
9
10
12
EBIT
76
106
168
182
209
230
% chg
24.8
38.8
58.6
8.1
15.0
10.0
(% of Net Sales)
22.4
25.4
27.5
26.0
25.7
25.7
Interest & other charges
4
9
11
21
27
36
Other Income
29
22
15
27
24
35
(% of sales)
1.1
2.2
1.9
3.0
3.4
4.1
PBT
102
119
172
188
206
229
% chg
10.2
16.4
44.7
9.3
9.8
10.8
Tax
31.3
38.3
58.7
59.3
65.1
72.1
(% of PBT)
30.7
32.3
34.1
31.5
31.5
31.5
PAT (reported)
71
81
113
129
141
157
Extraordinary (Exp)/Inc.
Minority Interest
7
2
5
10
13
18
ADJ. PAT
64
78
108
119
128
139
% chg
(3.3)
22.2
37.8
10.1
7.4
8.3
(% of Net Sales)
18.8
18.8
17.7
17.0
15.7
15.4
Basic EPS (`)
16.1
19.2
26.5
29.2
31.3
33.9
Fully Diluted EPS (`)
16.1
19.2
26.5
29.2
31.3
33.9
% chg
(1.2)
19.6
37.7
10.1
7.4
8.3
May 17, 2012
20
Mahindra Lifespaces Developers | Initiating coverage
Balance Sheet (Consolidated)
Y/E March (` cr)
FY2009
FY2010
FY2011 FY2012E FY2013E FY2014E
SOURCES OF FUNDS
Equity Share Capital
41
41
41
41
41
41
Preference Capital
14
10
0
0
0
0
ESOP Outstanding
0
0
1
1
1
1
Reserves& Surplus
884
938
1,024
1,114
1,215
1,324
Shareholders’ Funds
939
989
1,065
1,155
1,256
1,366
Minority Interest
86
82
83
100
114
132
Total Loans
332
421
544
509
759
1,009
Deferred Tax Liability
9
10
15
22
22
22
Total Liabilities
1,365
1,501
1,708
1,786
2,151
2,528
APPLICATION OF FUNDS
Net Block
150
163
179
195
230
260
Goodwill
29
29
29
29
29
29
Capital Work-in-Progress
46
13
17
8
8
8
Investments
108
148
87
175
175
175
Current Assets
1,214
1,394
1,705
1,852
2,215
2,649
Cash
145
133
240
150
287
581
Loans & Advances
199
207
294
367
400
440
Inventory
768
906
936
1,049
1,215
1,283
Debtors
73
121
207
198
275
303
Other current assets
29
25
28
89
38
42
Current liabilities
182
245
310
473
506
593
Net Current Assets
1,032
1,148
1,395
1,379
1,708
2,056
Mis. Exp. not written off
Total Assets
1,365
1,501
1,708
1,786
2,151
2,528
May 17, 2012
21
Mahindra Lifespaces Developers | Initiating coverage
Cash Flow Statement (Consolidated)
Y/E March (` cr)
FY2009
FY2010
FY2011 FY2012E FY2013E FY2014E
Profit before tax
102
119
172
188
206
229
Depreciation
(4)
7
8
9
10
12
Change in Working Capital
(80)
(88)
6
(33)
119
(140)
Other income
(29)
(22)
(15)
(27)
(24)
(35)
Direct taxes paid
(31)
(38)
(59)
(59)
(65)
(72)
Others
(193)
(43)
132
149
218
132
Cash Flow from Operations
(151)
(20)
20
72
(28)
138
(Inc.)/Dec. in Fixed Assets
72
4
28
32
37
41
(Inc.)/Dec. in Investments
224
(35)
62
-
-
-
Other income
29
22
15
27
24
35
Others
(133)
(19)
(64)
(78)
(86)
(104)
Cash Flow from Investing
192
(29)
41
(19)
(24)
(28)
Issue of Equity
26
-
1
-
-
-
Inc./(Dec.) in loans
47
89
123
(27)
250
250
Dividend Paid (Incl. Tax)
13
13
19
25
27
29
Others
(29)
(65)
(98)
(71)
(81)
(94)
Cash Flow from Financing
57
36
46
(73)
196
185
Inc./(Dec.) in Cash
99
(12)
107
(20)
144
295
Opening Cash balances
46
145
133
240
220
364
Closing Cash balances
145
133
240
220
364
659
May 17, 2012
22
Mahindra Lifespaces Developers | Initiating coverage
Key Ratio’s
Y/E March (` cr)
FY2009
FY2010
FY2011 FY2012E FY2013E FY2014E
Valuation Ratio (x)
P/E (on FDEPS)
19.4
16.2
11.8
10.7
10.0
9.2
P/CEPS
21.1
15.0
10.9
9.9
9.3
8.5
P/BV
1.4
1.3
1.2
1.1
1.0
0.9
Dividend yield (%)
1.0
1.0
1.5
2.0
2.1
2.3
EV/Sales
4.3
3.7
2.6
2.3
2.1
1.9
EV/EBITDA
20.1
13.9
8.9
8.5
8.0
7.0
EV / Total Assets
1.1
1.0
0.9
0.9
0.8
0.7
Per Share Data (`)
EPS (Basic)
15.7
19.2
26.5
29.2
31.3
33.9
EPS (fully diluted)
15.7
19.2
26.5
29.2
31.3
33.9
Cash EPS
14.8
20.8
28.5
31.4
33.7
36.7
DPS
3.2
3.2
4.7
6.1
6.6
7.1
Book Value
230.1
242.3
260.8
282.9
307.6
334.4
Du pont Analysis
EBIT margin
22.4
25.4
27.5
26.0
25.7
25.7
Tax retention ratio
0.7
0.7
0.7
0.7
0.7
0.7
Asset turnover (x)
0.3
0.3
0.4
0.5
0.5
0.5
ROIC (Post-tax)
4.5
5.6
7.8
8.0
8.2
8.3
Cost of Debt (Post Tax)
0.0
0.0
0.0
0.0
0.0
0.0
Leverage (x)
0.2
0.1
0.2
0.2
0.2
0.2
Operating ROE
9.0
11.1
15.6
16.1
16.4
16.6
Returns (%)
ROCE (Pre-tax)
6.0
7.4
10.5
10.4
10.6
9.8
Angel ROIC (Pre-tax)
6.5
8.2
11.9
11.7
12.0
12.1
ROE
6.8
7.9
10.2
10.3
10.2
10.1
Turnover ratios (x)
Asset Turnover
0.3
0.4
0.5
0.5
0.5
0.5
Inventory / Sales (days)
764
731
550
517
508
508
Receivables (days)
63
85
98
105
106
118
Payables (days)
236
255
233
280
301
306
WC cycle (ex-cash) (days)
837
831
647
621
594
590
Solvency ratios (x)
Net debt to equity
0.08
0.14
0.20
0.16
0.24
0.19
Net debt to EBITDA
1.1
1.2
1.2
1.0
1.4
1.0
Interest Coverage (EBIT / Interest)
20.4
11.4
14.9
8.6
7.7
6.3
May 17, 2012
23
Mahindra Lifespaces Developers | Initiating coverage
Research Team Tel: 022 - 39357800
DISCLAIMER
This document is solely for the personal information of the recipient, and must not be singularly used as the basis of any investment
decision. Nothing in this document should be construed as investment or financial advice. Each recipient of this document should make
such investigations as they deem necessary to arrive at an independent evaluation of an investment in the securities of the companies
referred to in this document (including the merits and risks involved), and should consult their own advisors to determine the merits and
risks of such an investment.
Angel Broking Limited, its affiliates, directors, its proprietary trading and investment businesses may, from time to time, make
investment decisions that are inconsistent with or contradictory to the recommendations expressed herein. The views contained in this
document are those of the analyst, and the company may or may not subscribe to all the views expressed within.
Reports based on technical and derivative analysis center on studying charts of a stock's price movement, outstanding positions and
trading volume, as opposed to focusing on a company's fundamentals and, as such, may not match with a report on a company's
fundamentals.
The information in this document has been printed on the basis of publicly available information, internal data and other reliable
sources believed to be true, but we do not represent that it is accurate or complete and it should not be relied on as such, as this
document is for general guidance only. Angel Broking Limited or any of its affiliates/ group companies shall not be in any way
responsible for any loss or damage that may arise to any person from any inadvertent error in the information contained in this report.
Angel Broking Limited has not independently verified all the information contained within this document. Accordingly, we cannot testify,
nor make any representation or warranty, express or implied, to the accuracy, contents or data contained within this document. While
Angel Broking Limited endeavours to update on a reasonable basis the information discussed in this material, there may be regulatory,
compliance, or other reasons that prevent us from doing so.
This document is being supplied to you solely for your information, and its contents, information or data may not be reproduced,
redistributed or passed on, directly or indirectly.
Angel Broking Limited and its affiliates may seek to provide or have engaged in providing corporate finance, investment banking or
other advisory services in a merger or specific transaction to the companies referred to in this report, as on the date of this report or in
the past.
Neither Angel Broking Limited, nor its directors, employees or affiliates shall be liable for any loss or damage that may arise from or in
connection with the use of this information.
Note: Please refer to the important `Stock Holding Disclosure' report on the Angel website (Research Section). Also, please refer to the
latest update on respective stocks for the disclosure status in respect of those stocks. Angel Broking Limited and its affiliates may have
investment positions in the stocks recommended in this report.
Disclosure of Interest Statement
Mahindra Lifespaces Developers
1. Analyst ownership of the stock
No
2. Angel and its Group companies ownership of the stock
No
3. Angel and its Group companies' Directors ownership of the stock
No
4. Broking relationship with company covered
No
Note: We have not considered any Exposure below ` 1 lakh for Angel, its Group companies and Directors
Ratings (Returns):
Buy (> 15%)
Accumulate (5% to 15%)
Neutral (-5 to 5%)
Reduce (-5% to 15%)
Sell (< -15%)
May 17, 2012
24