Please refer to important disclosures at the end of this report
1
Medplus Health Services Limited
IPO NOTE
Medplus Health Services Limited
December 10, 2021
Medplus Health Services Limited was incorporated in November 2006 by Gangadi
Madhukar Reddy with other promoters. Medplus is the second largest pharmacy
retailer in India, in terms of the number of stores as of March 31, 2021, and in
terms of revenue from the operation. Medplus offers a wide range of
pharmaceutical products and fast-moving consumer goods (FMGC), such as
medicines, vitamins, medical devices, home, and personal care products, etc.
Positives
(a) Medplus is the second largest pharmacy retailer in India, in terms
of the number of stores as of March 31, 2021, and in terms of revenue from
the operation. (b) Adding value proposition to the customer in terms of 2-hour
delivery, competitive pricing and a wide range of Pharmaceutical and FMCG
products. (c) Medplus is the first pharmacy retailer in India to offer an
omnichannel platform i.e. customers can visit the stores or place the order
online by mobile application or website. (d) Strong execution track record of
stores expansion, from 48 stores in 2006 to more than 2300 stores in 2021.
Investment concerns: (a) Increase in competition, from offline as well as online
companies like Apollo Pharmacy, Tata 1mg, Netmeds etc. (b) The company has
got some benefit of Covid related revenue in 2021 and in H1FY2022, once Covid
revenue normalizes it may be difficult for the company to have double-digit
revenue growth. (c) Company may face certain challenges to expand its retail
chain in other geographies.
Outlook & Valuation: Based on H1FY2022 numbers, the IPO is priced at a
EV/EBITDA of 27.5 times and price to sales at 2.5 times at the upper price band
of the IPO. Medplus is the second largest pharmacy retailer in India, company
offer a good value proposition to its customer in terms of discount, wide range of
product and fast delivery. We believe that the company omnichannel platform will
help to deliver strong growth in future. Hence, we are assigning a
“SUBSCRIBE” recommendation to the Medplus Health Services Limited IPO.
Key Financials
Y/E March (₹ cr)
FY19
FY20
FY21
H1FY21
H1FY22
Net Sales
2,272
2,871
3,069
1,463
1,880
% chg
-
26
6.9
-
28.5
Net Profit
12.1
2.2
63.4
22.4
66.6
% chg
-
(81.8)
2,782
-
197.3
EBITDA (%)
5.8
5.3
7.8
7.3
9.0
EPS (as stated)
1.3
0.2
5.7
2.1
6.0
P/E (x)
627
3,980
140
190
66.4
P/BV (x)
30.5
16.8
12.2
15.0
11.1
EV/EBITDA
69.7
60.2
38.6
43.1
27.5
EV/Sales
4.0
3.2
3.0
3.1
2.5
Source: Company, Angel Research
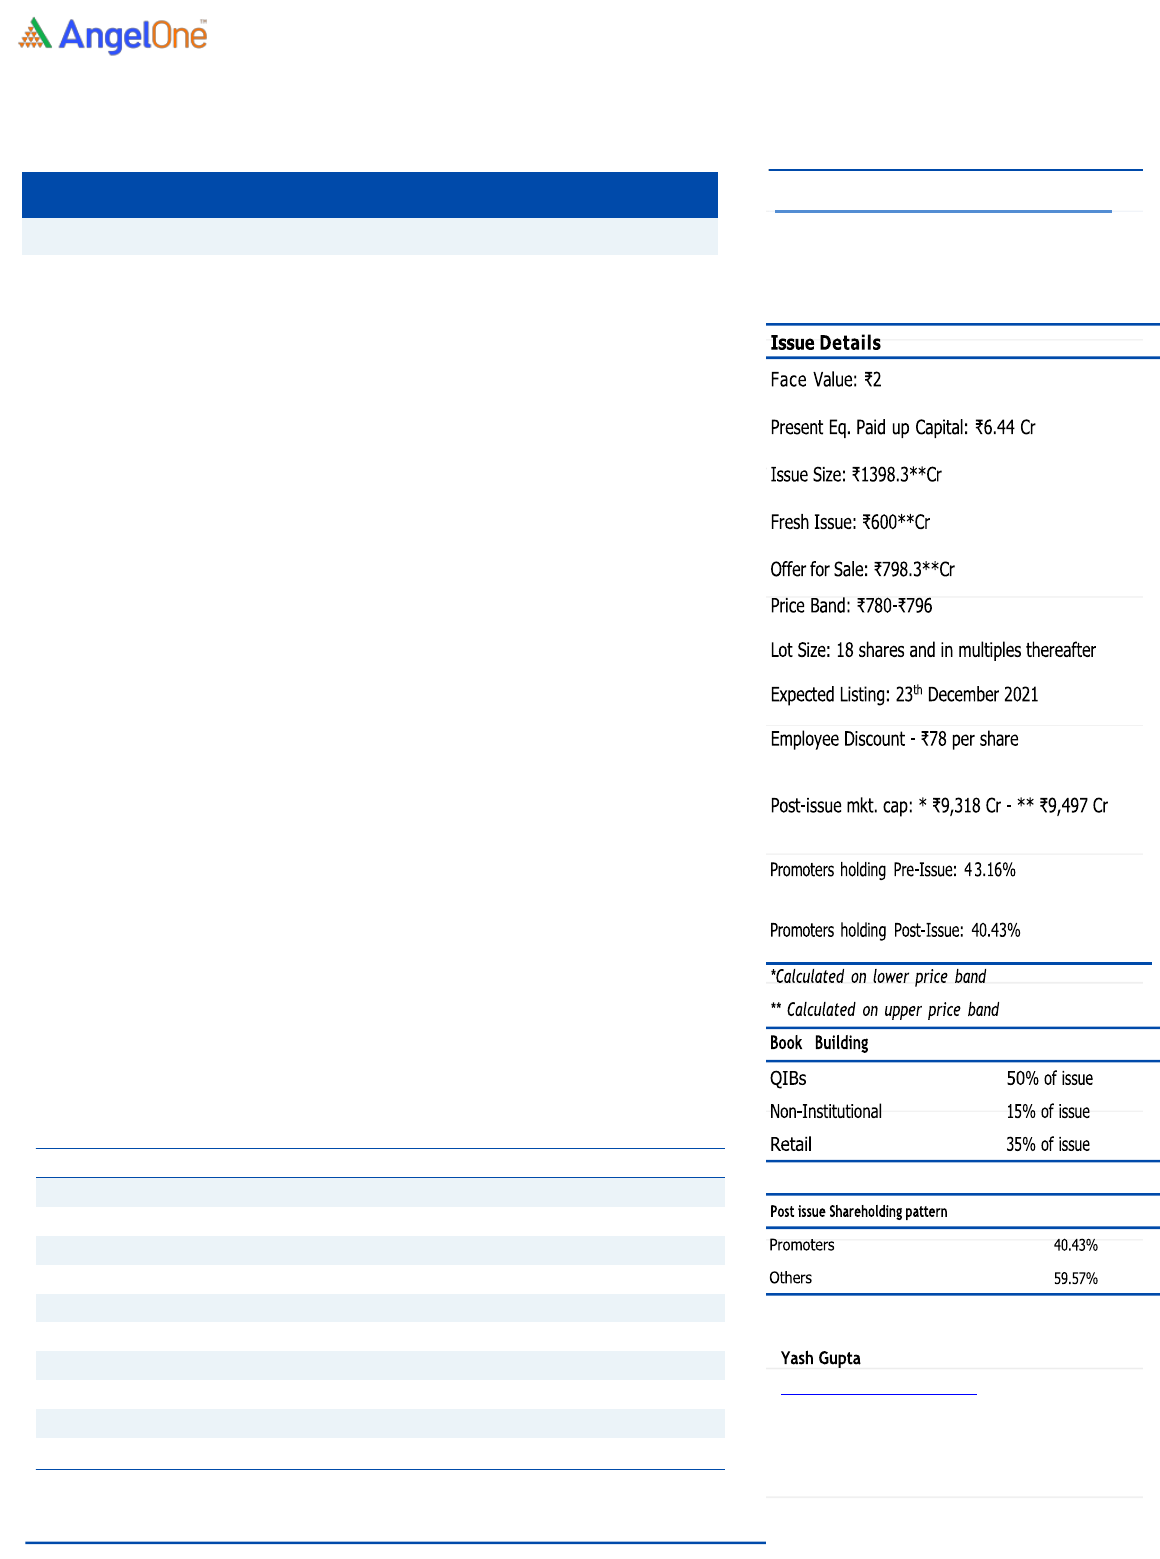
SUBSCRIBE
Issue Open: December 13, 2021
Issue Close: December 15, 2021

Medplus Health Services Limited | IPO Note
December 10, 2021
2
Company Background
Medplus Health Services Limited was incorporated in November, 2006 by
Gangadi Madhukar Reddy with other promoters. Medplus is the second largest
pharmacy retailer in India, in terms of number of stores as of March 31, 2021
and in terms of revenue from operation. Medplus offers a wide range of
products, including pharmaceutical and wellness products, including
medicines, vitamins, medical devices and test kits, and fast-moving consumer
goods (FMCG), such as home and personal care products, including toiletries,
baby care products, soaps and detergents, and sanitizers.
Company having more than 2300 offline retail network stores in 261 cities
across the states of Tamil Nadu, Andhra Pradesh, Telangana, Karnataka,
Odisha, West Bengal and Maharashtra. In 2020 company started focusing on
online sales, now company able to deliver their online purchases customers
within 2 hours of purchase in select cities of Hyderabad, Bangalore, Kolkata,
Pune and Nagpur. Medplus employs a data analytics driven cluster-based
approach to their store network expansion.
Medplus has 3 manufacturing plants in Telangana, company manufacture
range of plastic products, optical frames, spectacles and liquid disinfectants
etc.
Medplus hold strong market share in Chennai, Bangalore, Hyderabad and
Kolkata, company has market share of approximately 30%, 29%, 30% and
22%, respectively in organized pharmacy retail market. Companies number of
stores has grown significantly, as of September 30, 2021, company operate
546 stores in Karnataka, 475 stores in Tamil Nadu, 474 stores in Telangana,
297 stores in Andhra Pradesh, 224 stores in West Bengal, 221 stores in
Maharashtra and 89 stores in Odisha.
Issue Details –
The issue comprises of new issue of ₹600 crores and offer for sale of ₹798.3
crores. With the IPO, price band of ₹780-₹796.
Pre & Post issue share holding
(Pre-issue)
(Post-issue)
Particular
No of shares
%
No of shares
%
Promoter
4,82,33,135
43.2%
4,82,33,135
28.4%
Public
6,31,00,810
56.5%
7,06,45,321
41.6%
Employee Trust
4,27,220
0.4%
4,27,220
0.3%
Total
11,17,61,165
100.0%
16,96,24,024
100.0%
Source: Company, Angel Research

Medplus Health Services Limited | IPO Note
December 10, 2021
3
Objectives of the Offer
The IPO aims to utilize the net proceed for working capital requirement.
General Corporate Purposes.
Key Management Personnel
Gangadi Madhukar Reddy is the Managing Director and Chief Executive Officer
of the company. He is one of the Promoters of the company and has been a
Director of the company since incorporation on November 30, 2006.
Anish Kumar Saraf is the Non-Executive Director of the company. He is the
managing director of Warburg Pincus India Pvt Ltd and has been in the
employment of the company for 15 years.
Cherukupalli Bhaskar Reddy is the Chief Operating Officer – outlet operations
of the company. He joined the company on March 1, 2007. He has over 14
years of experience in the pharmaceutical industry.
Hemanth Kundavaram is the CFO of the company. He joined the company on
January 2, 2021. He has over 15 years of experience in corporate finance and
accounting in various industries.
Madhavan Ganesan is the Non-Executive Independent Director of the
company. He has over 34 years of experience in various companies in the
retail, technology and the industrial sectors.
Hiroo Mirchandani is the Non-Executive Independent Director of the company.
Her business career has primarily been in the healthcare and consumer goods
sectors.

Medplus Health Services Limited | IPO Note
December 10, 2021
4
Consolidated Profit & Loss account
Y/E March (₹ cr)
FY19
FY20
FY21
H1FY21
H1FY22
Total operating income
2,272
2,871
3,069
1,463
1,880
% chg
-
26
6.9
-
28.5
Total Expenditure
2,153
2,737
2,852
1,364
1,721
Raw material
1844
2337
2424
1144
1479
Employee Benefit Expense
211
272
339
180
180
Other Expenses
98
128
90
40
62
EBITDA
119
134
217
98
159
% chg
-
12
62
-
62
(% of Net Sales)
5.2
4.7
7.1
6.7
8.4
Depreciation& Amortization
58.5
74.8
88.2
42.2
54.7
EBIT
60.7
59.2
128.6
56.0
104.1
% chg
-
-2
117
-
86
(% of Net Sales)
2.7
2.1
4.2
3.8
5.5
Interest & other Charges
50
47
55
27
31
Other Income
12.2
17.2
21.5
8.4
10.9
(% of Sales)
0.5
0.6
0.7
0.6
0.6
PBT
22.9
29.7
95.3
37.4
83.7
(% of Net Sales)
1.0
1.0
3.1
2.6
4.5
Tax
10.8
27.5
31.9
15.0
17.1
PAT (reported)
12.1
2.2
63.4
22.4
66.6
% chg
-
(82)
2,782
-
197.3
(% of Net Sales)
0.5
0.1
2.1
1.5
3.5
EPS (as stated)
1.27
0.2
5.7
2.1
6.0
% chg
-
(84)
2,750
-
187
Source: Company, Angel Research
Medplus Health Services Limited | IPO Note
December 10, 2021
5
Consolidated Balance Sheet
Y/E March (₹ cr)
FY19
FY20
FY21
H1FY21
H1FY22
SOURCES OF FUNDS
Equity Share Capital
0.2
0.2
0.4
0.2
6.4
Other equity
291
529
731
591
795
Shareholders Funds
291
529
731
591
801
Total Loans
287
321
401
344
464
Other liabities
8.1
17.7
18.3
18.7
17.6
Total Liabilities
586
867
1,151
954
1,282
APPLICATION OF FUNDS
Net Block
47
60
87
61
108
Current Assets
469
816
923
828
987
Sundry Debtors
9
6
5
4
7
Cash &Bank Balance
25
114
107
42
26
Other Assets
17
25
49
67
74
Current liabilities
372
481
415
431
464
Net Current Assets
97
335
508
397
524
Other Non Current Asset
442
473
555
496
651
Total Assets
586
867
1151
954
1282
Source: Company, Angel Research

Medplus Health Services Limited | IPO Note
December 10, 2021
6
Consolidated Cash Flow Statement
Y/E March (₹ cr)
FY19
FY20
FY21
H1FY21
H1FY22
Profit before tax
22.7
29.3
95.0
37.2
83.5
Depreciation
58.5
74.8
88.3
42.2
54.7
Change in Working Capital
(33.1)
(251.4)
(130.6)
(76.4)
(69.0)
Interest Expense
14.1
6.5
8.3
4.7
2.6
Direct Tax Paid
(12.5)
(14.8)
(28.7)
(8.9)
(16.3)
Others
16.8
20.9
30.5
42.2
1.8
Cash Flow from Operations
146.4
(6.6)
2.9
5.7
156.3
(Inc.)/ Dec. in Fixed Assets
(21.6)
(30.1)
(54.0)
(9.5)
(41.6)
Investment
(1.3)
(1.9)
14.9
(3.7)
(58.6)
Interest received
3.6
5.3
4.2
1.7
1.6
Other
0
(0.9)
0.2
0.2
-
Cash Flow from Investing
(19.3)
(27.6)
(34.7)
(11.3)
(98.6)
Proceeds Convertible Preference Sh.
-
203.8
98.0
-
-
Dividend paid on equity shares
(14.1)
(6.5)
(8.3)
(4.7)
(2.6)
Others
-
0.6
-
-
0.4
Cash Flow from Financing
(82.8)
89.8
(5.6)
(47.6)
(60.6)
Inc./(Dec.) in Cash
44.5
55.6
(37.2)
(53.4)
(2.6)
Opening Cash balances
(91.3)
(46.8)
8.8
8.8
(28.4)
Closing Cash balances
(46.8)
8.8
(28.4)
(44.6)
(31.0)
Source: Company, Angel Research
Key Ratios
Y/E March
FY19
FY20
FY21
H1FY21
H1FY22
Valuation Ratio (x)
P/E (on FDEPS)
627
3,980
140
190.4
66.4
P/CEPS
126.0
115.5
58.7
68.9
36.7
P/BV
30.5
16.8
12.2
15.0
11.1
EV/Sales
4.0
3.2
3.0
3.1
2.5
EV/EBITDA
69.7
60.2
38.6
43.1
27.5
Per Share Data (Rs)
EPS (fully diluted )
1.27
0.20
5.70
2.09
5.99
Cash EPS
6.3
6.9
13.6
5.8
10.9
Book Value
26.1
47.3
65.4
52.9
71.7
DPS
-
-
-
-
-
Number of share
11.18
11.18
11.18
11.18
11.18
Returns (%)
RONW
4.1
0.4
8.7
3.8
8.4
Turnover ratios (x)
Asset Turnover (net)
25.4
27.3
23.2
27.5
24.4
Receivables (days)
1.4
0.8
0.6
0.5
0.7
Inventory Days
63.3
81.8
89.2
85.5
78.6
Payables (days)
31.3
36.6
22.3
28.9
27.6
Working capital cycle (days)
33.4
46.1
67.5
57.1
51.8
Source: Company, Angel Research

Medplus Health Services Limited | IPO Note
December 10, 2021
7
Research Team Tel: 022 - 40003600 E-mail: [email protected] Website: www.angelone.in
DISCLAIMER
Angel Broking Limited (hereinafter referred to as “Angel”) is a registered Member of National Stock Exchange of India Limited,
Bombay Stock Exchange Limited and Metropolitan Stock Exchange Limited. It is also registered as a Depository Participant
with CDSL and Portfolio Manager and investment advisor with SEBI. It also has registration with AMFI as a Mutual Fund
Distributor. Angel Broking Limited is a registered entity with SEBI for Research Analyst in terms of SEBI (Research Analyst)
Regulations, 2014 vide registration number INH000000164. Angel or its associates has not been debarred/ suspended by SEBI
or any other regulatory authority for accessing /dealing in securities Market.
This document is solely for the personal information of the recipient, and must not be singularly used as the basis of any
investment decision. Nothing in this document should be construed as investment or financial advice. Each recipient of this
document should make such investigations as they deem necessary to arrive at an independent evaluation of an investment
in the securities of the companies referred to in this document (including the merits and risks involved), and should consult
their own advisors to determine the merits and risks of such an investment.
Angel or its associates or research analyst or his relative may have actual/beneficial ownership of 1% or more in the securities
of the subject company at the end of the month immediately preceding the date of publication of the research report.
Neither Angel or its associates nor Research Analysts or his relative has any material conflict of interest at the time of
publication of research report.
Angel or its associates might have received any compensation from the companies mentioned in the report during the period
preceding twelve months from the date of this report for services in respect of managing or co-managing public offerings,
corporate finance, investment banking or merchant banking, brokerage services or other advisory service in a merger or
specific transaction in the normal course of business. Angel or its associates did not receive any compensation or other
benefits from the companies mentioned in the report or third party in connection with the research report. Neither Angel nor
its research analyst entity has been engaged in market making activity for the subject company.
Reports based on technical and derivative analysis center on studying charts of a stock's price movement, outstanding
positions and trading volume, as opposed to focusing on a company's fundamentals and, as such, may not match with a
report on a company's fundamentals. Investors are advised to refer the Fundamental and Technical Research Reports
available on our website to evaluate the contrary view, if any.
The information in this document has been printed on the basis of publicly available information, internal data and other
reliable sources believed to be true, but we do not represent that it is accurate or complete and it should not be relied on as
such, as this document is for general guidance only. Angel Broking Limited or any of its affiliates/ group companies shall not
be in any way responsible for any loss or damage that may arise to any person from any inadvertent error in the information
contained in this report. Angel Broking Limited has not independently verified all the information contained within this
document. Accordingly, we cannot testify, nor make any representation or warranty, express or implied, to the accuracy,
contents or data contained within this document. While Angel Broking Limited endeavors to update on a reasonable basis
the information discussed in this material, there may be regulatory, compliance, or other reasons that prevent us from doing
so.
This document is being supplied to you solely for your information, and its contents, information or data may not be
reproduced, redistributed or passed on, directly or indirectly.
Neither Angel Broking Limited, nor its directors, employees or affiliates shall be liable for any loss or damage that may arise
from or in connection with the use of this information. Angel or its associates or Research Analyst or his relative might have
financial interest in the subject company. Research analyst has not served as an officer, director or employee of the subject
company.
