
Life Insurance Corporation of India
Please refer to important disclosures at the end of this report
1
The Life Insurance Corporation of India (LIC) is the country's largest insurance
provider with a market share of 66.2%/61.4% in terms of new business premium
for FY2021/9MFY2022. LIC is the largest asset manager in India with AUM of
₹40.1 trillion, as on 31
st
December, 2021, on a standalone basis. LIC offers a wide
variety of participating and non participating products to its customers including
ULIP’s, saving insurance products, term insurance products, health insurance, and
annuity & pension products. LIC has the largest individual agent network among
life insurance entities in India, comprising approximately 1.33 million individual
agents as on 31st Dec’21, which was 6.8 times the number of individual agents of
the 2nd largest life insurer.
Positives: (a) The largest player in the fast growing and underpenetrated Indian life
insurance sector, 5th largest life insurer globally by GWP. (b) Cross-cyclical product
mix that caters to diverse consumer needs. (c) Presence across India through an
omni-channel distribution network with an unparalleled agency force. (d) Trusted
brand and a customer-centric business model. (e) Robust risk management
framework.
Investment concerns: (a) Continued market share loss to private players (b) Adverse
persistency metrics (e.g, volatility in market, regulatory change, losing faith etc)
could have a material adverse effect on company’s financial condition. (c) Adverse
impact due to COVID-19 type pandemic. (d) Difficult to value the company given
complex methodology involved in calculating embedded value.
Outlook & Valuation: At the upper end of the price band the LIC IPO is offered at
P/EV (embedded value) of 1.1x as compared to other large listed private life
insurance companies which are trading at multiples of 2.5-4.3x Sep’21 EV. Though
there are concerns over LIC regarding market share loss in individual insurance
business and historically lower margins, we believe that valuations factor in most of
the negatives. Expected improvements in product mix and greater transfer of
surplus to shareholders account over the coming years are expected to drive profits
from current low levels, which along with cheap valuations provide comfort.
Moreover, discount of ₹45 and ₹60 for retail investors & LIC policyholders makes
the issue more attractive for them. Hence, we are assigning a “SUBSCRIBE”
recommendation to the issue.
Key Financials
Y/E March (₹ cr)
FY'19
FY'20
FY'21
9M FY'22
New business premium
144,038
180,274
185,523
126,778
Growth (%)
25.2%
2.9%
-
APE
40,566
47,972
45,588
29,923
Growth (%)
18.3%
-5.0%
-
VNB margin (%)
-
-
9.9%
9.3%
IEV*
NA
46,497
95,605
539,686
PAT
2,627
2,710
2,974
1,715
P/IEV
NA
12.9
6.3
1.1
EPS
4.2
4.3
4.7
2.7
P/E
228.7
221.2
201.9
-
ROE
293%
247%
43%
19%
Source: Company RHP, Angel Research
SUBSCRIBE
Issue Open: May 04, 2022
Issue Close: May 09, 2022
Offer for Sale: ` 19,517 cr - `20,557 cr
QIBs 45% of issue
Non-Institutional 13% of issue
Retail 35% of issue
Policyholders 10% of issue
Promoters 96.5%
Others 3.5%
Post Issue Shareholding Pattern
Post Eq. Paid up Capital: ` 6,325 cr
Issue size (amount): ₹ 19,517 cr - ₹ 20,557
Price Band: ₹902 - ₹949
Lot Size: 15 shares and in multiple thereafter
Post-issue mkt. cap: * `5,70,515 cr - ** `6,00,242 cr
Promoters holding Pre-Issue: 100%
Promoters holding Post-Issue: 96.5%
*Calculated on lower price band
** Calculated on upper price band
Book Building
Fresh issue: `0 cr
Issue Details
Face Value: `10
Present Eq. Paid up Capital: ` 6,325 cr
IPO NOTE
Life Insurance Corporation of India
April 30, 2022

LIC | IPO Note
April 30, 2022
2
Company background
LIC is India's only government-owned insurance provider company. Life Insurance
Corporation of India (“LIC”) was established on September1, 1956, under the LIC
Act by merging and nationalizing 245 private life insurance companies in India. It
is providing life insurance in India for more than 65 years and is the largest life
insurer in India. It is a part insurance and part investment products company. Their
plans are a combination of insurance and investment with a guaranteed return.
LIC has over 13.5 lakh agents who help bring most of the new business.
Largest Insurance Company in India with significant market share
LIC is the largest life insurer in India, with a 61.6% market share in terms of
total/gross written premiums (GWP) and a 61.4% market share in terms of New
Business Premium (“NBP”) for 9MFY2022. Moreover LIC has a 71.8% market
share in terms of number of individual policies issued and 88.8% market share in
terms of number of group policies issued for the 9 months ended December 31,
2021.
LIC’s market share in the Indian life insurance industry for Fiscal 2021 was 64.1%
in terms of GWP, 66.2% in terms of NBP, 74.6% in terms of number of individual
policies issued, and 81.1% in terms of number of group policies issued.
Wide product basket catering to all segments
LIC has a broad, diversified product portfolio covering various segments across
individual products and group products. Their individual products comprise (i)
participating insurance products and (ii) non-participating products, which include
(a) savings insurance products; (b) term insurance products; (c) health insurance
products; (d) annuity and pension products; and (e) unit linked insurance products.
LIC’s individual product portfolio in India comprised 33 individual products (17
participating products and 16 non-participating products) and 7 individual riders.
LIC’s group products comprise (i) group term insurance products, (ii) group savings
insurance products; (iii) group savings pension products; and (iv) group annuity
products. LIC’s group product portfolio in India comprised 11 group products
Robust pan India distribution network driven by individual agents
LIC has a robust pan India omni-channel distribution platform for individual
products which comprises of (i) individual agents, (ii) bancassurance partners, (iii)
alternate channels (iv) digital sales (v) Micro Insurance agents and (vi) Point of
Sales Persons-Life Insurance scheme.
LIC has the largest individual agent network among life insurance entities in India,
comprising approximately 1.33 million individual agents as on 31
st
Dec’21, which
was 6.8 times the number of individual agents of the 2nd largest life insurer. As on
31st Dec’21, LIC had 2,048 branch offices and 1,559 satellite offices in India,
covering 91% of all districts in India.
LIC’s individual policies are primarily distributed by their individual agents who
were responsible for sourcing 94.8%/96.2% of LIC’s NBP for their individual
products in India, for FY2021/9MFY2022 respectively.
LIC | IPO Note
April 30, 2022
3
Continued dominant position in group insurance driving NBP growth
In terms of business parameters LIC’s new business premium (NBP) has grown at a
CAGR of 13.5% between FY2019-FY2021 while total premium has grown at a
CAGR of 9.2% during the same period. Total premium in India has grown at a
CAGR of 9.3% while annualized premium equivalent (APE) has grown at a CAGR
of 6.0% CAGR during the same period.
Exhibit 1: Key Operating & financial parameters
Particulars (₹ cr)
FY2019
FY2020
FY2021
9MFY22
Premium (consolidated)
340,295
382,811
405,851
285,730
Of which:
(i) First year premiums
31,677
58,446
34,341
22,215
(ii) Single premiums & consideration for annuities granted
112,361
121,828
151,182
104,562
(iii) NBP ((i)+(ii))
144,038
180,274
185,523
126,778
(iv) Renewable premiums
196,257
202,537
220,328
158,952
Premium (in India)
337,130
379,014
402,888
283,753
Individual APE (in India)
31,448
35,297
32,271
20,904
Group APE
9,118
12,675
13,317
9,019
Total annualized premium equivalent (“APE”) (in India)
40,566
47,972
45,588
29,923
AUM (Consolidated)
3,271,033
3,338,108
3,692,967
4,032,170
IEV
-
46,497
95,605
539,686 *
VNB Margin (%)
-
-
9.9%
9.3%
Operating expenses related to insurance business to premium ratio (as a % of premium)
8.3%
9.0%
8.7%
9.5%
Conservation Ratio
92.2%
88.8%
84.5%
93.7%
Source: Company RHP, Angel Research; * IEV as of 30
th
Sep’21
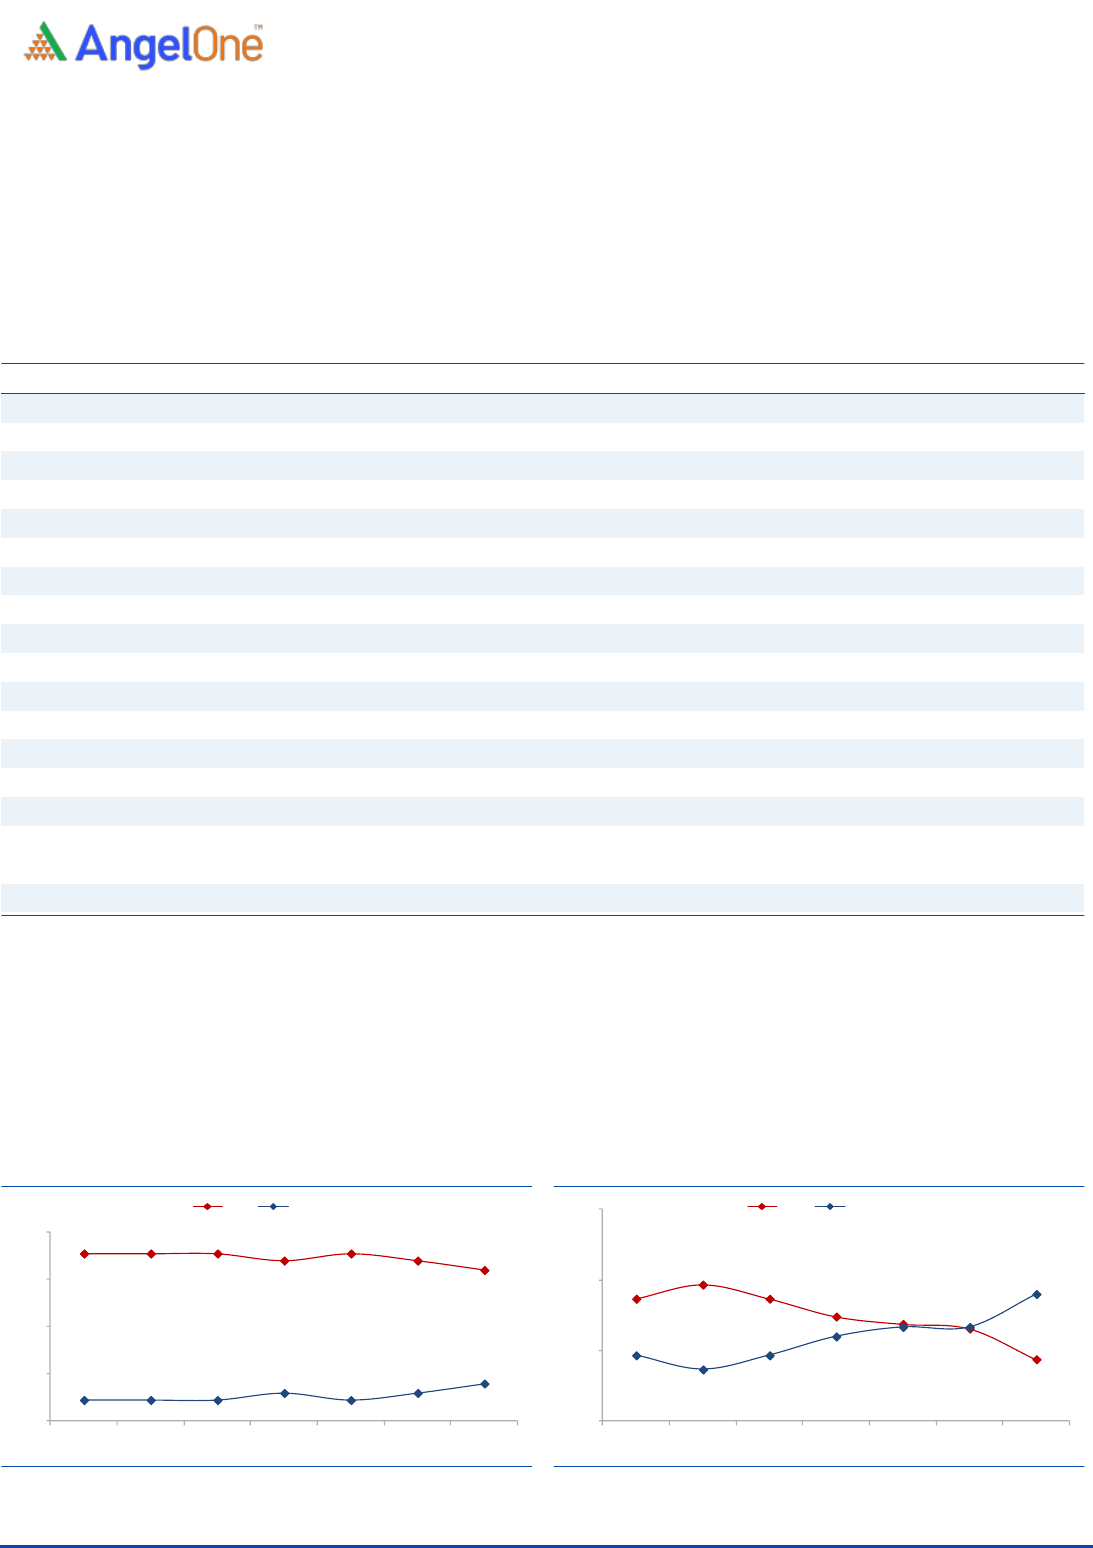
LIC continues to be an overall market leader in the insurance space with a
66.2%/61.4% market share in new business premium for FY2021/9MFY2022.
LIC’s dominant position in the life insurance business is largely driven by its 75%+
market share in the group insurance business. However over the past few years
LIC has lost significant market share in the high margin individual insurance
business.
Exhibit 2: Market share (NBP) – Group insurance
Source: Company RHP, Angel Research
Exhibit 3: Market share (NBP) – Individual insurance
Source: Company RHP, Angel Research
81%
81%
81%
78%
81%
78%
74%
19%
19%
19%
22%
19%
22%
26%
10%
30%
50%
70%
90%
FY16
FY17
FY18
FY19
FY20
FY21
9MFY22
LIC
Private players
56%
59%
56%
52%
51%
50%
43%
44%
41%
44%
48%
50%
50%
57%
30%
45%
60%
75%
FY16
FY17
FY18
FY19
FY20
FY21
9MFY22
LIC
Private players
LIC | IPO Note
April 30, 2022
4
High proportion of Group & Participating businesses have been a drag on margins
In terms of annual premium equivalent (APE) LIC derives a significant portion of
their business from group and participating businesses which are by nature low
margin business as compared to individual and non-participating and protection
business. Higher contribution from group insurance and participating business has
been a drag on LIC’s NBP margins at 9.3% for 9MFY2022 which is significantly
lower than the listed life insurance players despite its size and scale.
Exhibit 4: The IPO is priced at a significant discount to listed life insurance companies
Company Name
CMP
(Rs.)**
Market cap
(Rs. Cr)**
Total premium
(Rs Cr)#
NBP
(Rs. Cr)#
PAT
(Rs. Cr)#
VNB Margin
(%)#
P/EV
(X)*
LIC
949
600,242
284,050
126,020
1,715
9.3%
1.1
HDFC Life
583
123,060
31,540
17,190
821
26.5%
4.3
ICICI Pru Life
526
75,646
25,750
10,250
572
27.1%
2.5
SBI Life
1,108
110,831
41,250
18,790
834
25.5%
3.1
Source: Company, BSE, Angel Research; * EV/IEV as of 30
th
Sep’21; ** CMP, M Cap. as of closing 29
th
Apr’22 for listed companies; # 9MFY22 figures
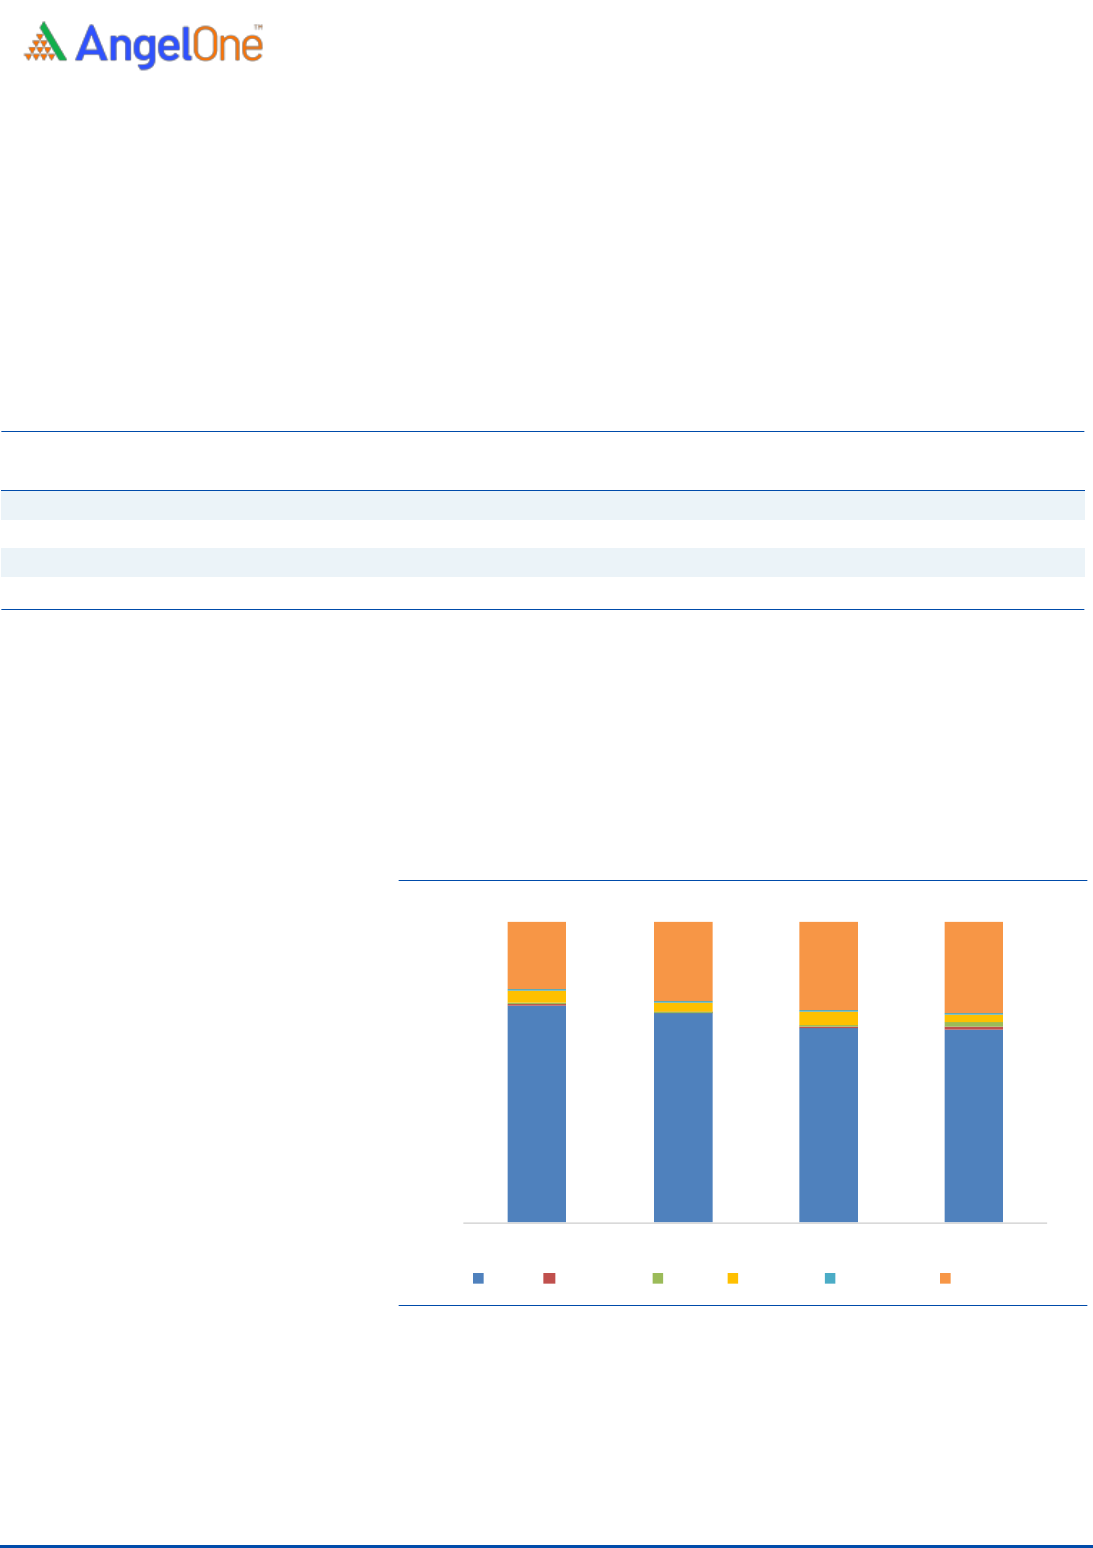
Over the last few years there has been a shift from participating to non
participating policies in the product mix. However participating policies still
accounted for 64.4% of LIC’s total APE in 9MFY2022 which is significantly higher
than private life insurance companies like HDFC Life, ICICI Prudential and SBI Life
where participating business account for less than 30% of total APE.
Exhibit 5: Product mix skewed towards PAR products
Source: Company RHP, Angel Research
Moreover, LIC’s PAT margins are also significantly lower than listed private players
due to 1. Greater share of participating product in the mix and 2. Transfer of 5%
of surplus in participation policies from policyholder’s a/c to shareholder’s account
as compared to 10% by private players.
72.5%
69.5%
64.8%
64.4%
4.1%
3.2%
4.4%
2.9%
22.5%
26.4%
29.2%
30.1%
0%
25%
50%
75%
100%
FY2019
FY2020
FY2021
9MFY2022
PAR
Non PAR
ULIP
Annuity
Protection
Group

LIC | IPO Note
April 30, 2022
5
Shift towards non PAR products and increased transfer to shareholders a/c to drive
profit growth
There has been more than an 800bps shift in product mix away from PAR products
as a % of APE between FY2019 to 9MFY2022, which is expected to continue over
the next few years. LIC still has significant scope in terms of achieving a more
balanced product mix relative to private players.
Against the current policy of transferring 5% of surplus in participating products to
shareholders’ account, the company will start transferring 7.5% and 10.0% of
surplus to shareholders account from FY2023 and FY2025, which will bring LIC in
line with other private players. For Non PAR products, LIC has already stated
transferring 100% of surplus to shareholders account from FY2022 (as compared
to 5% earlier), which is in line with other private players.
Exhibit 6: Surplus transfer to shareholders a/c for LIC
Product Type
FY2021
FY2022
FY2023
FY2024
Post FY2025
Participating
5.0%
5.0%
7.5%
7.5%
10.0%
Others
5.0%
100.0%
100.0%
100.0%
100.0%
Source: Company RHP, Angel Research
We believe that shift in product mix towards non PAR products will drive
improvement in VNB margins from current low levels to mid teens figure over the
next few years. Greater transfer of surplus from policyholders account along with
improvement in VNB margins will drive profits from current low levels.
Discounted valuations to listed peers provide comfort
At the upper end of the price band the LIC IPO is offered at P/EV (embedded
value) of 1.1x as compared to other listed players which are trading at multiples of
2.5-4.3x Sep’21 EV. Though there are concerns over LIC regarding market share
loss in the individual product business and low margins, we believe that valuations
factor in most of the negatives.
Expected improvements in product mix and greater transfer of surplus over the
coming years are expected to drive profits from current low levels which along with
cheap valuations provide comfort. Key risk to the thesis is continued market share
loss in the high margin individual business and continued high contribution from
low margin PAR and group insurance business.

LIC | IPO Note
April 30, 2022
6
Issue details
The IPO is entirely made up of offer for sale of 221,374,920 equity shares by
the Government of India.
Pre & Post Shareholding
(Pre-Issue)
(Post-Issue)
Particulars
No of shares
%
No of shares
%
Promoter
6,324,997,701
100%
6,103,622,781
96.5%
Public
0
0%
221,374,920
3.5%
Total
6,324,997,701
100%
6,324,997,701
100%
Source: Company, Angel Research
Objectives of the Offer
To achieve the benefits of listing the equity shares on the stock exchange.
To carry out an offer for sale of 221,374,920 shares by selling
shareholders.
Key Management Personnel
Mangalam Ramasubramanian Kumar is the Whole-time Chairperson of LIC. He
joined LIC in the year 1983 and has experience in the insurance sector. Previously,
he was the zonal manager of South, North-Central and North zones of LIC and
has also headed the personnel and pension & group schemes department.
Pankaj Jain is a Government Nominee Director of the Corporation and is an
officer at the Indian Administrative Service from the 1990 batch. He is presently
serving as a secretary in the Ministry of Petroleum, Government of India. He is a
qualified cost accountant from the Institute of Cost Accountants of India and a
member of the International Financial Services Centres Authority.
Raj Kumar is the Managing Director of the Corporation. He joined the Corporation
in the year 1984 as an apprentice officer and has experience in the insurance
sector. He has also served as the chief executive officer of LIC Mutual Fund Asset
Management Limited.
Siddhartha Mohanty is the Managing Director of the Corporation. He holds
bachelor’s degree in law and a master’s degree of arts (political science) from
Utkal University, Bhubaneswar, Odisha. He previously served as COO and CEO
of LIC Housing Finance Limited and has held various other key positions.
Ipe Mini is the Managing Director of the Corporation. She holds master’s degree
of commerce from the Faculty of Commerce and Management Studies, Andhra
University. Previously, she was also the shareholder director of Central Bank of
India.
Bishnu Charan Patnaik is the Managing Director of LIC. He joined LIC in the year
1985 and has experience in the insurance sector and has handled several
positions in LIC.
Dr Ranjan Sharma is the Independent Director of LIC. He is experienced in the
field of academics.
Vinod Kumar Verma is the Independent Director of LIC. He is experienced in
electronics business. He is an Independent Director of LIC from October 29, 2021

LIC | IPO Note
April 30, 2022
7
Financial Summary Policyholders Account (technical)
Y/E March (₹ cr)
FY’19
FY’20
FY’21
9M FY’22
Premiums earned - Net
339,972
382,476
405,398
285,342
Income from Investments
225,044
242,836
285,520
226,254
Other income
5,794
20,294
12,791
684
Total
570,810
645,605
703,709
512,279
Commission
20,483
21,548
22,358
15,538
Operating expenses
28,332
34,426
35,162
27,267
Other exp
4,832
19,732
13,456
0
GST & other charges
110
98
93
56
Provisions
21,158
35,276
16,483
-273
Benefits paid (Net)
252,381
255,479
288,489
234,620
Interim Bonuses Paid
1,651
1,673
2,229
2,470
Change in valuation of policy liabilities
253,585
296,628
321,134
239,357
Transfer to/ (from) Provision
for Linked Liabilities
-9,312
-9,110
434
-9,528
Transfer (others)
6
4
9
1,129
Share of Profit (Associates/Minority Interest)
3,185
6,947
717
2,225
Surplus/(deficit) net
769
-3,202
4,579
3,868
Source: Company, Angel Research
Financial Summary Shareholders Account (Non-technical)
Y/E March (₹ cr)
FY’19
FY’20
FY’21
9M FY’22
Amounts transferred
from Policyholders' account
2,599
2,696
2,963
1,638
Income from investments & others
46
35
23
120
Total
2,645
2,731
2,986
1,757
Expenses other than insurance
0
0
0
0
Contribution to Policyholders' account
2
6
5
0
Others
0
6
0
0
Profit before Tax
2,642
2,719
2,980
1,757
Provision for tax
15
8
6
42
PAT
2,627
2,710
2,974
1,715
Source: Company, Angel Research

LIC | IPO Note
April 30, 2022
8
Balance Sheet
Y/E March (₹ cr)
FY’19
FY’20
FY’21
9M FY’22
Sources of Funds
Share capital
100
100
100
6,325
Reserve and surplus
798
892
6,705
2,499
Credit/[debit] fair value change account
(89)
10
78
141
Minority Interest (Shareholders)
88
96
99
102
Borrowings
269,401
253,414
4
4
Policyholders' funds
3,096,023
3,159,634
3,739,414
4,080,610
Funds For Future Appropriations
13
29
3
1,107
Total Liabilities
3,366,335
3,414,175
3,746,404
4,090,787
Applications of Funds
Shareholders’ investments
369
401
426
5,187
Policyholders’ investments
2,877,687
2,957,908
3,498,441
3,843,617
Asset held to cover linked liabilities
33,567
32,170
32,975
23,467
Loans
249,880
237,435
108,764
111,141
Fixed assets
14,568
14,572
3,474
3,463
Net current assets
190,264
171,690
102,325
103,912
Total Assets
3,366,335
3,414,175
3,746,404
4,090,787
Source: Company, Angel Research

LIC | IPO Note
April 30, 2022
9
Key Ratios
Y/E March (₹ cr)
FY'19
FY'20
FY'21
9M FY'22
Growth
New Business Premium
144,038
180,274
185,523
126,778
Net Premium Earned
339,972
382,476
405,398
285,342
APE
40,566
47,972
45,588
29,923
AUM
3,271,033
3,338,108
3,692,967
4,032,170
PAT
2,627
2,710
2,974
1,715
Growth (%)
-
-
-
-
New Business Premium
-
25%
3%
-
Net Premium Earned
-
13%
6%
-
APE
-
18%
-5%
-
AUM
-
2%
11%
-
PAT
-
3%
10%
-
Valuations
EPS (Rs)
4.2
4.3
4.7
2.7
BV (Rs)
1.4
1.7
11.0
14.3
IEV (per share)
-
74
151
853*
P/IEV
-
12.9
6.3
1.1
P/E
228.7
221.2
201.9
-
Capital & Efficiency
VNB Margin
-
-
9.9%
9.3%
ROE (%)
293%
247%
43%
19%
Commission ratio (%)
6.0%
5.6%
5.5%
5.4%
Insurance expense (%)
8.3%
9.0%
8.7%
9.6%
Expense ratio (%)
14.4%
14.6%
14.2%
15.0%
Source: Company, Angel Research; * As of 30
th
Sep’21

LIC | IPO Note
April 30, 2022
10
Research Team Tel: 022 - 40003600 E-mail: [email protected] Website: www.angelone.in
DISCLAIMER
Angel One Limited (hereinafter referred to as “Angel”) is a registered Member of National Stock Exchange of India Limited, Bombay Stock
Exchange Limited and Metropolitan Stock Exchange Limited. It is also registered as a Depository Participant with CDSL and Portfolio
Manager and investment advisor with SEBI. It also has registration with AMFI as a Mutual Fund Distributor. Angel One Limited is a
registered entity with SEBI for Research Analyst in terms of SEBI (Research Analyst) Regulations, 2014 vide registration number
INH000000164. Angel or its associates has not been debarred/ suspended by SEBI or any other regulatory authority for accessing /dealing
in securities Market.
This document is solely for the personal information of the recipient, and must not be singularly used as the basis of any investment
decision. Nothing in this document should be construed as investment or financial advice. Each recipient of this document should make
such investigations as they deem necessary to arrive at an independent evaluation of an investment in the securities of the companies
referred to in this document (including the merits and risks involved), and should consult their own advisors to determine the merits and
risks of such an investment.
Angel or its associates or research analyst or his relative may have actual/beneficial ownership of 1% or more in the securities of the subject
company at the end of the month immediately preceding the date of publication of the research report. Neither Angel or its associates nor
Research Analysts or his relative has any material conflict of interest at the time of publication of research report.
Angel or its associates might have received any compensation from the companies mentioned in the report during the period preceding
twelve months from the date of this report for services in respect of managing or co-managing public offerings, corporate finance,
investment banking or merchant banking, brokerage services or other advisory service in a merger or specific transaction in the normal
course of business. Angel or its associates did not receive any compensation or other benefits from the companies mentioned in the report
or third party in connection with the research report. Neither Angel nor its research analyst entity has been engaged in market making
activity for the subject company.
Reports based on technical and derivative analysis center on studying charts of a stock's price movement, outstanding positions and trading
volume, as opposed to focusing on a company's fundamentals and, as such, may not match with a report on a company's fundamentals.
Investors are advised to refer the Fundamental and Technical Research Reports available on our website to evaluate the contrary view, if
any.
The information in this document has been printed on the basis of publicly available information, internal data and other reliable sources
believed to be true, but we do not represent that it is accurate or complete and it should not be relied on as such, as this document is for
general guidance only. Angel One Limited or any of its affiliates/ group companies shall not be in any way responsible for any loss or
damage that may arise to any person from any inadvertent error in the information contained in this report. Angel One Limited has not
independently verified all the information contained within this document. Accordingly, we cannot testify, nor make any representation or
warranty, express or implied, to the accuracy, contents or data contained within this document. While Angel One Limited endeavors to
update on a reasonable basis the information discussed in this material, there may be regulatory, compliance, or other reasons that prevent
us from doing so.
This document is being supplied to you solely for your information, and its contents, information or data may not be reproduced,
redistributed or passed on, directly or indirectly.
Neither Angel One Limited, nor its directors, employees or affiliates shall be liable for any loss or damage that may arise from or in
connection with the use of this information. Angel or its associates or Research Analyst or his relative might have financial interest in the
subject company. Research analyst has not served as an officer, director or employee of the subject company.
