Please refer to important disclosures at the end of this report
1
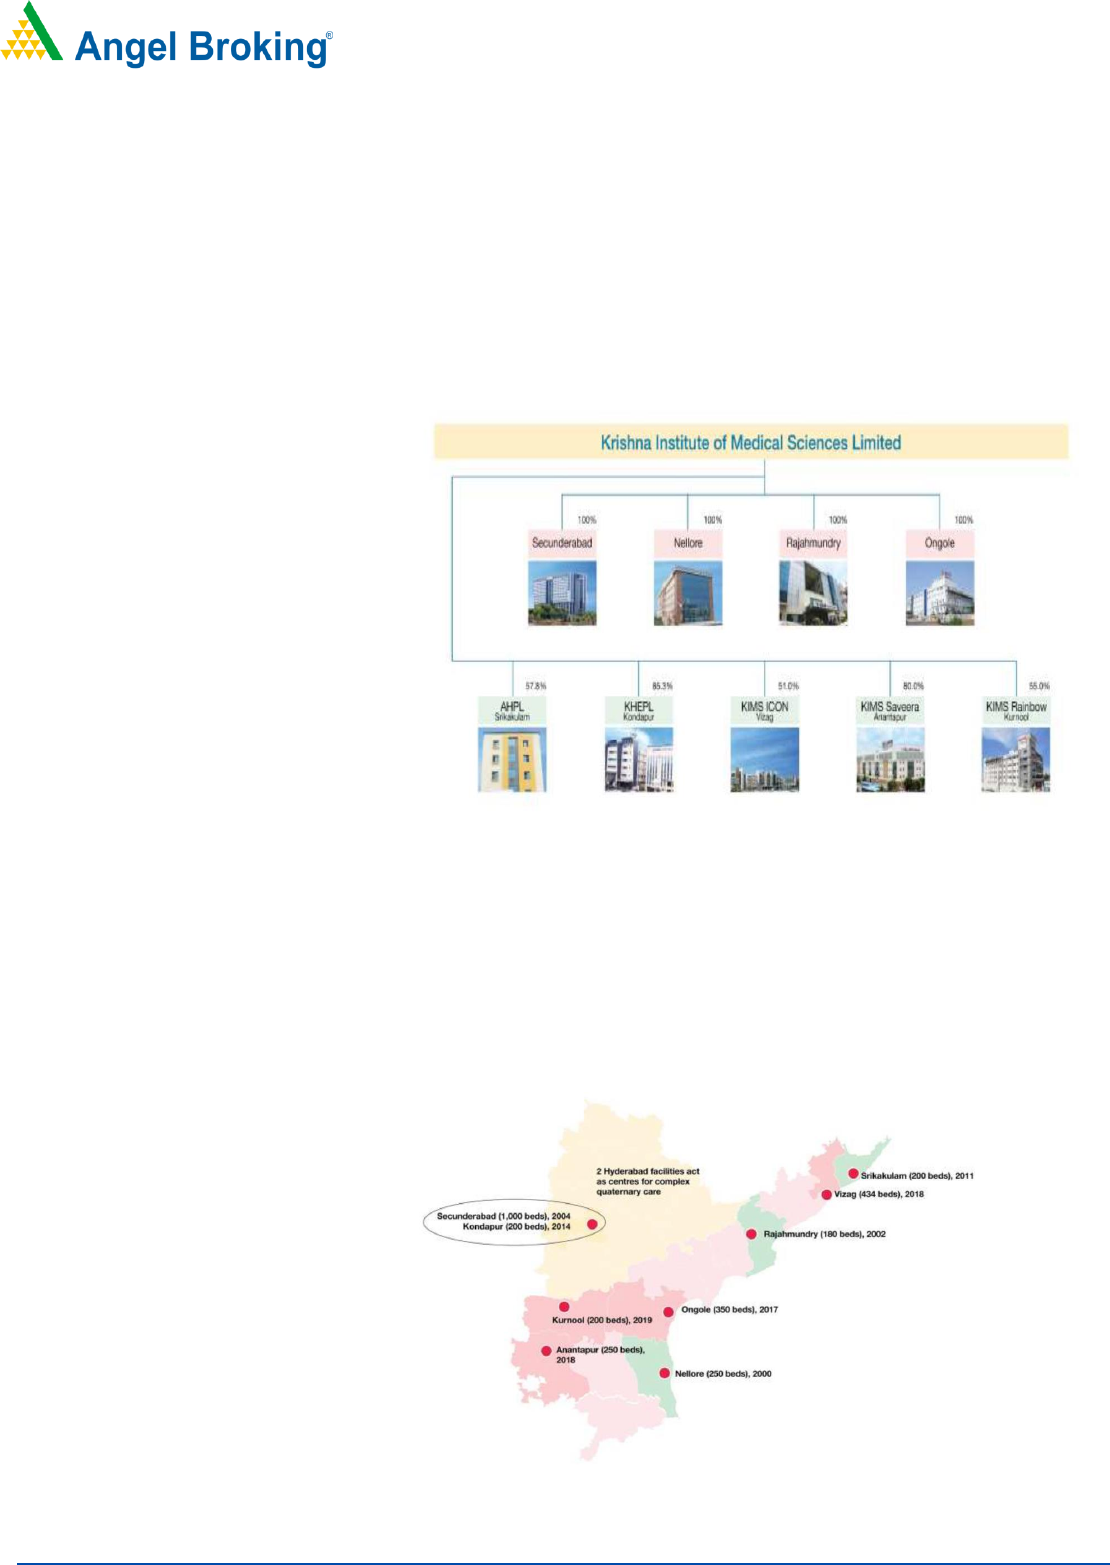
Krishna Institute of Medical Sciences Limited is one of the largest corporate healthcare
groups in South India specially in AP and Telangana. It provides multi-disciplinary
integrated healthcare services, with a focus on primary secondary, tertiary care and
quaternary healthcare. Company operates 9 multi-specialty hospitals under the “KIMS
Hospitals” brand, with an aggregate bed capacity of 3,064, including over 2,500
operational beds as of March 31, 2021.
Positives: (a) Company having a good track record of retaining high quality doctors,
consultants and medical support staff. (b) Company having negative Debt/Equity ratio,
which is one of the lowest ratios among the peers. (c) Company having very high ROCE
of 24% in FY2021 along with one of the highest EBITDA growth in the last 3 years.
Investment concerns: (a) Business highly dependent on our healthcare professionals,
including doctors that company engage on a consultancy basis, business and financial
results could be impacted if it is unable to retain healthcare professionals. (b) Company
dependence on their flagship hospital at Secunderabad in Telangana is at 33% any
geopolitical changes can impact the company business. (c) Upcoming expansion plans
in Bangalore & Chennai will require a lot of fresh capitals and both are very competitive
markets.
Outlook & Valuation: Based on FY-2021PE of 31.2x and EV/EBITDA of 17.8x at upper
band of the IPO price and are slightly better than the peers’ companies. Similarly,
company having one of the best ROE & ROCE of 23.8% and 24.8% respectively.
Company having a very healthy balance sheet with negative Net Debt/ Equity. We
expect the upcoming expansion plan in Bangalore & Chennai can be funded through
internal accruals and minimum amount of debt. We are assigning a “SUBSCRIBE”
recommendation to the issue.
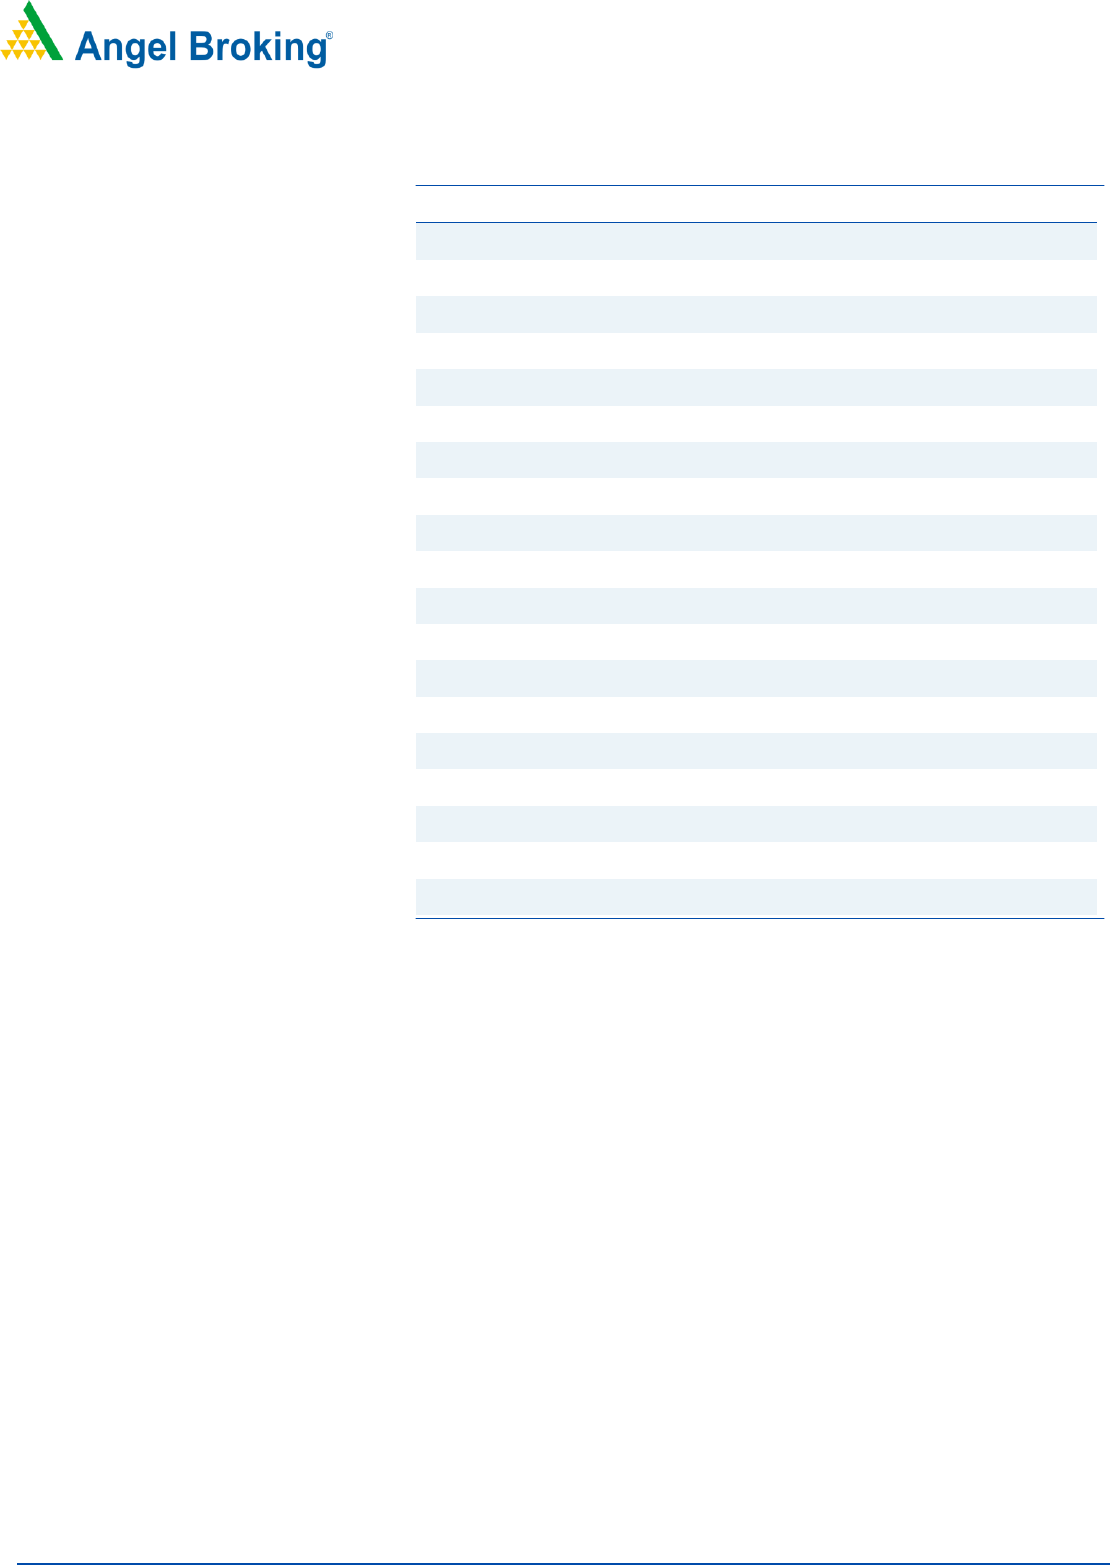
Key Finance
Y/E March (` cr)
FY2019
FY2020
FY2021
Net Sales
918.0
1,122.6
1,329.9
% chg
-
22.3
18.5
Net Profit
(48.8)
115.1
205.5
% chg
-
-
78.6
EBITDA (%)
8.8
21.8
27.9
EPS (Rs)
(6.6)
15.4
26.5
P/E (x)
(125.9)
53.4
31.2
P/BV (x)
11.4
10.3
7.4
ROE (%)
(9.0)
19.2
23.8
ROCE (%)
2.6
17.7
24.8
EV/EBITDA
79.3
26.1
17.8
EV/Sales
7.0
5.7
5.0
Source: Company, Angel Research
SUBSCRIBE
Issue Open: June 16, 2021
Issue Close: June 18, 2021
QIBs 75% of issue
Non-Institutional 15% of issue
Retail 10% of issue
Promoters 38.8%
Others 61.2%
Post Issue Shareholding Pattern
Post Eq. Paid up Capital: ₹ 80 cr
Issue size (amount): ₹2143.74 cr**
Price Band: ₹ 815-825
Lot Size: 18 shares and in multiple thereafter
Post-issue mkt. cap: *₹ 6522 cr - **₹ 6602 cr
Promoters holding Pre-Issue: 46.8%
Promoters holding Post-Issue: 38.8%
*Calculated on lower price band
** Calculated on upper price band
Book Building
Fresh issue: ₹ 200 cr.
Issue Details
Face Value: ₹ 10
Present Eq. Paid up Capital: ₹ 77.59 cr
Offer for Sale: ₹ 1943.7Cr
Yash Gupta,
+022 39357600, Extn: 6872
Research Analyst
Yash.gupta@angelbroking.com
IPO Note
June 15, 2021
Krishna Institute of Medical Sciences Limited
KIMS Ltd | IPO Note
June15, 2021
2
Company background
Company first hospital was established in Nellore (AP) in 2000 by Dr. Bhaskara Rao
Bollineni, a renowned cardiothoracic surgeon in India and started with a capacity of
approximately 200 beds. Then it significantly expanded hospital network in recent
years through acquisitions of hospitals in Ongole (AP) in Fiscal Year 2017, Vizag
(AP) and Anantapur (AP) in Fiscal Year 2019 and Kurnool (AP) in Fiscal Year 2020.
Approximately one-third of 3,064 beds were launched in the last four years and also
improved on overall bed occupancy rate.
Company strategically focuses on the southern India healthcare market where it has
a strong understanding of regional nuances, customer culture and the mindset of
medical professionals and where there is significant and growing need for quality
and affordable healthcare services. Dr. Abhinay assumed as CEO position in 2019
and played a leadership role in expanding the KIMS’ network over the last 5 years,
including in the launch of KIMS Kondapur and the acquisitions of our hospitals in
Ongole (AP), Vizag (AP), Anantapur (AP) and Kurnool (AP). Currently company
aggregate beds are 3064 out of which 2500 are operational beds.

KIMS Ltd | IPO Note
June15, 2021
3
In Fiscal Year 2021, its nine hospitals recorded ARPOB (Average Revenue Per
Operating Bed) of 20,609, a bed occupancy rate of 78.60%, and an ALOS (Average
of length of stay) of 5.53 days, on an aggregate basis. In Fiscal Year 2021, ARPOB
for the hospitals situated in Tier 1 cities was 39,571 and ARPOB for the hospitals
situated in Tier 2-3 cities was 11,187.
Issue details
The issue size is ` 2143.74Cr, which comprises of fresh issues of up to `200 crore
& offer for sale of ` 1943.74Cr in the price band of `815-`825 per share.
Pre and post IPO shareholding pattern
No of shares
(Pre-issue)
%
(Post-issue)
%
Promoter
36,323,850
46.8
31,086,304
38.8
Public
41,269,433
53.2
48,943,574
61.2
Total
77,593,283
100.0
80,029,878
100.0
Source: Company, Angel Research & RHP.
Objectives of the Offer
Repayment/pre-payment, in full or part, of certain borrowings availed by
Company and by Subsidiaries viz KHKPL, SIMSPL and KHEPL; and
General corporate purposes
Key Management Personnel
Dr. Bhaskara Rao Bollineni is the Managing Director of the Company. He holds a
bachelor’s degree in medicine and surgery from Andhra University and a master’s
degree in general surgery from Madras Medical College, Chennai, Tamil Nadu. He
has also been admitted as a Diplomate of the National Board of Examinations, New
Delhi for the practice of cardio-thoracic surgery. He has over 27 years of experience
in cardiothoracic surgery and has in the past held various positions with Apollo
Hospitals, Austin Hospital, University of Melbourne and Mahavir Hospital and
Research Centre.
Anitha Dandamudi is a Whole-time Director of the Company. She holds a diploma
in business management from the ICFAI University and a certification for the six-
sigma green belt. She also holds certifications for the auditing of quality systems as
per ISO 9001-2000 and ISO 9004-2000, and has completed a training program
on internal quality audit for the NABH. She has over 16 years of experience in the
hospital industry, having held various positions with our Company, and has also
served as vice president of administration at e-Talent Software Limited.

KIMS Ltd | IPO Note
June15, 2021
4
Dr. Abhinay Bollineni is an Executive Director of the Company. He holds a bachelor’s
degree in medicine and a bachelor’s degree in surgery from Dr. NTR University of
Health Sciences, Andhra Pradesh (Faculty of Modern Medicine) through Deccan
College of Medical Sciences. He also participated in the ‘International Visitor
Leadership Program on Oncology: Research, Prevention and Treatment’ held by the
U.S. Department of State where he undertook training in diagnosis, treatment
methods, alternative therapies, support groups and follow-up care for cancer
patients and their families.
Sandeep Naik is a Non-Executive Director of the Company. He holds a bachelor’s
degree in engineering from the University of Bombay, and has completed his
master’s degree in science from the Virginia Commonwealth University and a
master’s in business administration from Wharton School of Business at University
of Pennsylvania. He is a Managing Director and head of General Atlantic’s business
in India and Asia-Pacific and a member of the management committee at General
Atlantic.
KIMS Ltd | IPO Note
June15, 2021
5
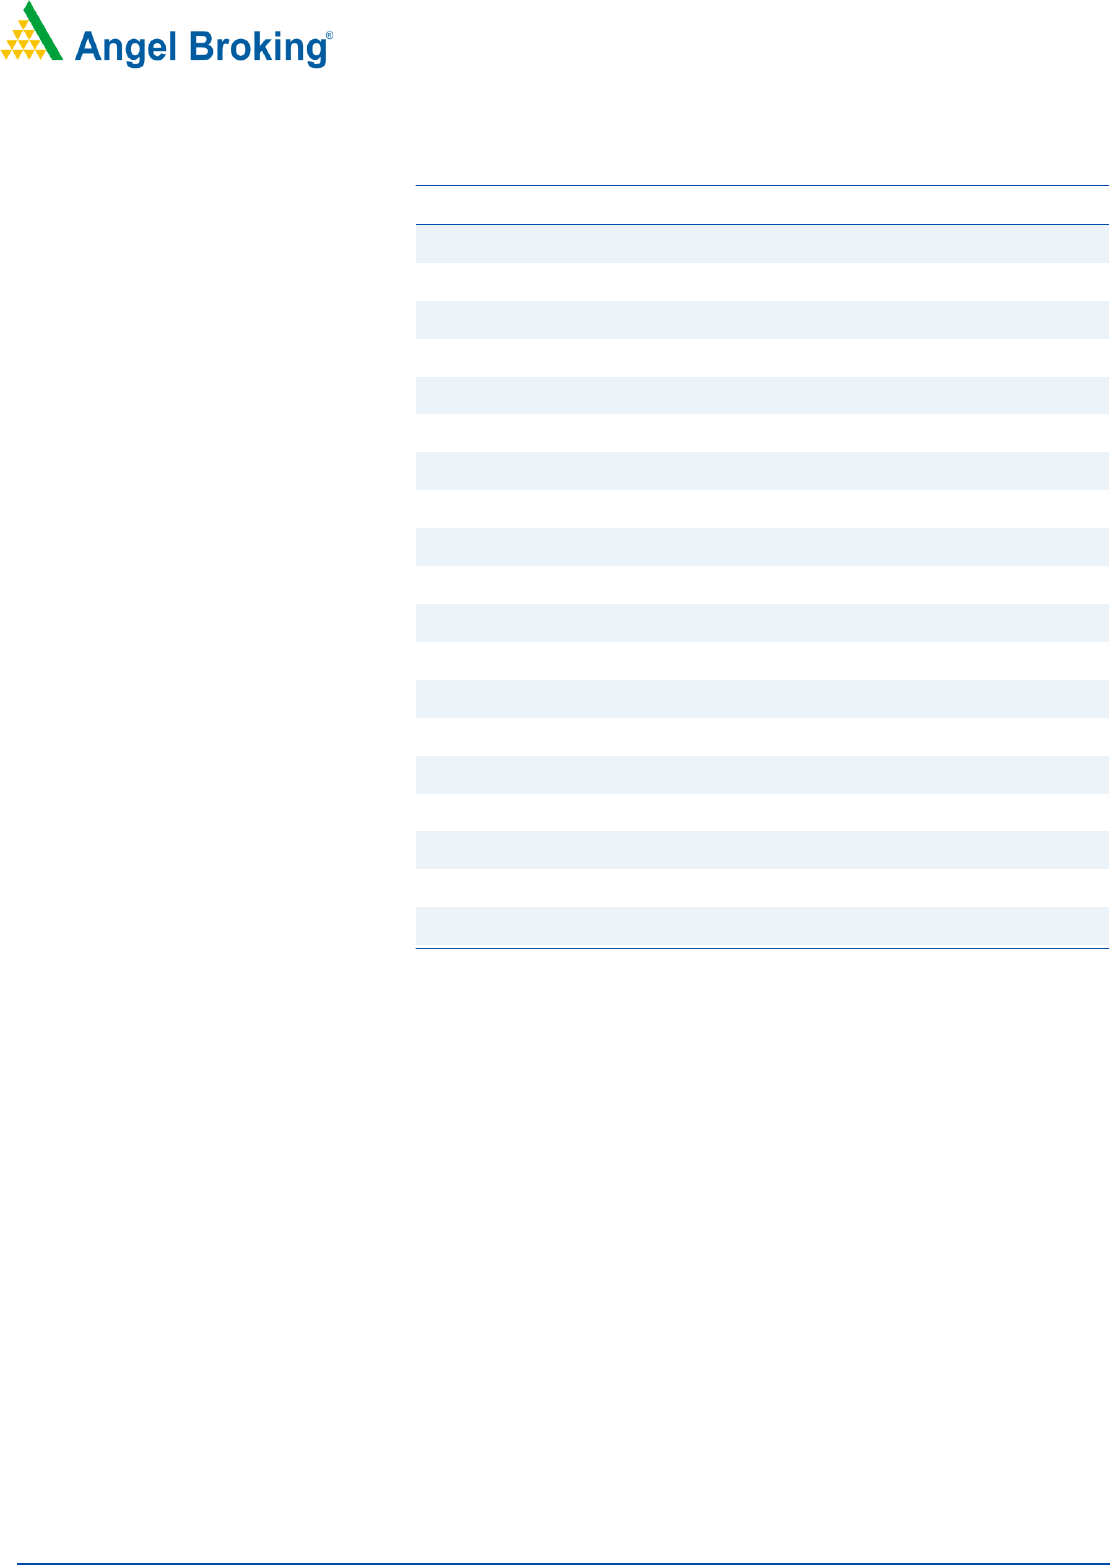
Consolidated Profit & Loss Statement
Y/E March (` cr)
FY2019
FY2020
FY2021
Total operating income
918
1,123
1,330
% chg
-
22.3
18.5
Total Expenditure
837
878
959
Purchase of medical consumables
210
254
289
Employee benefits expense
163
198
220
Other expenses
464
425
450
EBITDA
81
245
371
% chg
-
202.6
51.4
(% of Net Sales)
8.8
21.8
27.9
Depreciation& Amortization
56
71
70
EBIT
25
174
301
% chg
-
612
72.8
(% of Net Sales)
2.7
15.5
22.7
Finance costs
46
40
32
Other income
6
6
10
Recurring PBT
-15.4
140.5
279.0
% chg
-
-
98.6
Tax
33.4
25.5
73.5
PAT (reported)
-48.8
115.1
205.5
% chg
-
-
78.6
(% of Net Sales)
-5.3
10.3
15.5
Basic & Fully Diluted EPS (`)
-6.6
15.4
26.5
Source: Company, Angel Research
KIMS Ltd | IPO Note
June15, 2021
6
Consolidated Balance Sheet Statement
Y/E March (`cr)
FY2019
FY2020
FY2021
SOURCES OF FUNDS
Equity Share Capital
74.5
74.5
77.6
Other equity (Retained Earning)
466
524
786
Shareholders’ Funds
541
598
864
Total Loans
287
292
252
Other liabilities
109
97
97
Total Liabilities
936
987
1,213
APPLICATION OF FUNDS
Property, plant and equipment
708
749
771
Capital work-in-progress
0
2
9
Goodwill
75
85
85
Other intangible assets
26
26
25
Right-of-use assets
56
56
51
Current Assets
174
220
451
Inventories
27
30
24
Trade receivables
123
132
110
Cash and cash equivalents
8
41
52
Bank balances other than (ii) above
2
5
232
Loans
2
2
2
Other financial assets
9
5
23
Other current assets
3
4
7
Current Liability
183
209
223
Net Current Assets
-9
11
228
Other Non-Current Asset
80
58
45
Total Assets
936
987
1,213
Source: Company, Angel Research
KIMS Ltd | IPO Note
June15, 2021
7
Consolidated Cash flow
Y/E March (`cr)
FY2019
FY2020
FY2021
Operating profit
193
255
380
Net changes in working capital
-28
0
14
Cash generated from operations
165
255
394
Direct taxes paid
-31
-54
-38
Cash flow operating activities
134
202
356
Purchase of property, plant and equipment
-77
-52
-94
Proceeds from sale
0
1
1
Others
-33
-73
-261
Cash Flow from Investing
-110
-125
-354
Repayment of long-term borrowings
-186
-72
-141
Proceeds from long-term borrowings
130
81
46
Proceeds from short-term borrowings
-25
-12
45
Payment of lease liabilities
-8
-9
-7
Proceeds from issue of shares
88
-
95
Others
-26
-33
-27
Cash Flow from Financing
-27
-44
10
Inc./(Dec.) in Cash
-3
32
12
Opening Cash balances
11.0
8.1
40.5
Closing Cash balances
8.1
40.5
52.1
Source: Company, Angel Research
KIMS Ltd | IPO Note
June15, 2021
8
Key Ratios
Y/E March
FY2019
FY2020
FY2021
Valuation Ratio (x)
P/E (on FDEPS)
(125.9)
53.4
31.2
P/CEPS
803.4
33.1
23.3
P/BV
11.4
10.3
7.4
EV/Sales
7.0
5.7
5.0
EV/EBITDA
79.3
26.1
17.8
Per Share Data (`)
EPS (Basic)
(6.6)
15.4
26.5
EPS (fully diluted)
(6.6)
15.4
26.5
Cash EPS
1.0
24.9
35.4
Book Value
72.6
80.3
111.3
Returns (%)
ROE
(9.0)
19.2
23.8
ROCE
2.6
17.7
24.8
Turnover ratios (x)
Receivables (days)
49.0
43.0
30.1
Inventory (days)
10.7
9.9
6.6
Payables (days)
-
-
-
Working capital cycle (days)
59.7
52.9
36.7
Source: Company, Angel Research

KIMS Ltd | IPO Note
June15, 2021
9
Research Team Tel: 022 - 39357800 E-mail: [email protected] Website: www.angelbroking.com
DISCLAIMER
Angel Broking Limited (hereinafter referred to as “Angel”) is a registered Member of National Stock Exchange of India Limited, Bombay
Stock Exchange Limited and Metropolitan Stock Exchange Limited. It is also registered as a Depository Participant with CDSL and Portfolio
Manager and investment advisor with SEBI. It also has registration with AMFI as a Mutual Fund Distributor. Angel Broking Limited is a
registered entity with SEBI for Research Analyst in terms of SEBI (Research Analyst) Regulations, 2014 vide registration number
INH000000164. Angel or its associates has not been debarred/ suspended by SEBI or any other regulatory authority for accessing
/dealing in securities Market. Angel or its associates/analyst has not received any compensation / managed or co-managed public
offering of securities of the company covered by Analyst during the past twelve months.
This document is solely for the personal information of the recipient, and must not be singularly used as the basis of any investment
decision. Nothing in this document should be construed as investment or financial advice. Each recipient of this document should make
such investigations as they deem necessary to arrive at an independent evaluation of an investment in the securities of the companies
referred to in this document (including the merits and risks involved), and should consult their own advisors to determine the merits and
risks of such an investment.
Reports based on technical and derivative analysis center on studying charts of a stock's price movement, outstanding positions and
trading volume, as opposed to focusing on a company's fundamentals and, as such, may not match with a report on a company's
fundamentals. Investors are advised to refer the Fundamental and Technical Research Reports available on our website to evaluate the
contrary view, if any.
The information in this document has been printed on the basis of publicly available information, internal data and other reliable sources
believed to be true, but we do not represent that it is accurate or complete and it should not be relied on as such, as this document is for
general guidance only. Angel Broking Limited or any of its affiliates/ group companies shall not be in any way responsible for any loss
or damage that may arise to any person from any inadvertent error in the information contained in this report. Angel Broking Limited
has not independently verified all the information contained within this document. Accordingly, we cannot testify, nor make any
representation or warranty, express or implied, to the accuracy, contents or data contained within this document. While Angel Broking
Limited endeavors to update on a reasonable basis the information discussed in this material, there may be regulatory, compliance, or
other reasons that prevent us from doing so.
This document is being supplied to you solely for your information, and its contents, information or data may not be reproduced,
redistributed or passed on, directly or indirectly.
Neither Angel Broking Limited, nor its directors, employees or affiliates shall be liable for any loss or damage that may arise from or in
connection with the use of this information.
