Quick take
HSIL Ltd
BUY
CMP
`433
Operating into the most growing segments
Target Price
`510
HSIL Limited (HSIL) is an Indian company, which offers sanitaryware products, faucets
and glass bottles. The company's segments include building products division,
Investment Period
12 Months
packaging products division and others division (retail, consumer, pipes, caps and
closures, etc.) The company’s ~46% revenue comes from building products division,
Stock Info
~43% from Packaging products division and balance from others division.
Sector
Sanitaryware
Market Cap (` cr)
2,840
Strong demand for sanitaryware to benefit HSIL: The current market size of sanitaryware
Net Debt (` cr)
782
is around `4,000-4,200cr. The market is expected to grow at ~10% CAGR going
Beta
1.1
forward on the back of increasing disposable income, urbanization, evolving
52 Week High / Low
564/ 278
preferences and government initiatives (Swachh Bharat, Housing for All, Smart cities,
Avg. Daily Volume
19,199
etc). Going forward, we estimate that HSIL would benefit from the expanding
Face Value (`)
2
sanitaryware industry backed by strong distribution network, good brand recall and
BSE Sensex
34,297
introduction of new products.
Nifty
10,546
Container glass business to be driven by demand revival: Indian market for container
Reuters Code
HSNT.BO
glass is estimated at ~`7,000cr, which is expected to grow at 4-5% CAGR going
Bloomberg Code
HSI.IN
forward. HSIL manufactures container glass for packaging needs of the companies in
the user industry (beverages, liquor, pharma, food industry, etc). HSIL is prominent
Shareholding Pattern (%)
player in the container glass segment in India. In our view, strong growth of companies
Promoters
48.4
in the user industry will lead to higher growth for HSIL.
MF / Banks / Indian Fls
26.2
Forayed into newer segments to boost additional growth: During FY16, the company
FII / NRIs / OCBs
7.8
has forayed into consumer segment, from which the company is expecting sales turnover
Indian Public / Others
17.6
of `500cr over the next 2 years with 10% of EBIT margin. Further, HSIL has expected to
launch security caps and closures in 1QFY19, which would be able to generate revenue
Abs. (%)
3m
1yr
3yr
around `130cr on full operating basis (EBIT is around 20-25%). Moreover, HSIL is also
Sensex
4.7
21.8
17.7
entering the PVC Pipe segment, which is expected to start commercial production around
Nikamal
(5.3)
(5.3)
4.5
in FY19 (will be able to generate revenue ~`400cr on peak utilization).
De-merger of building materials and consumer segment to unlock the valu e: HSIL is
demerging its consumer and building materials business, which is expected to be
completed by July 2018. Consumer and building material businesses contribute more
than 50% to the revenues of HSIL.
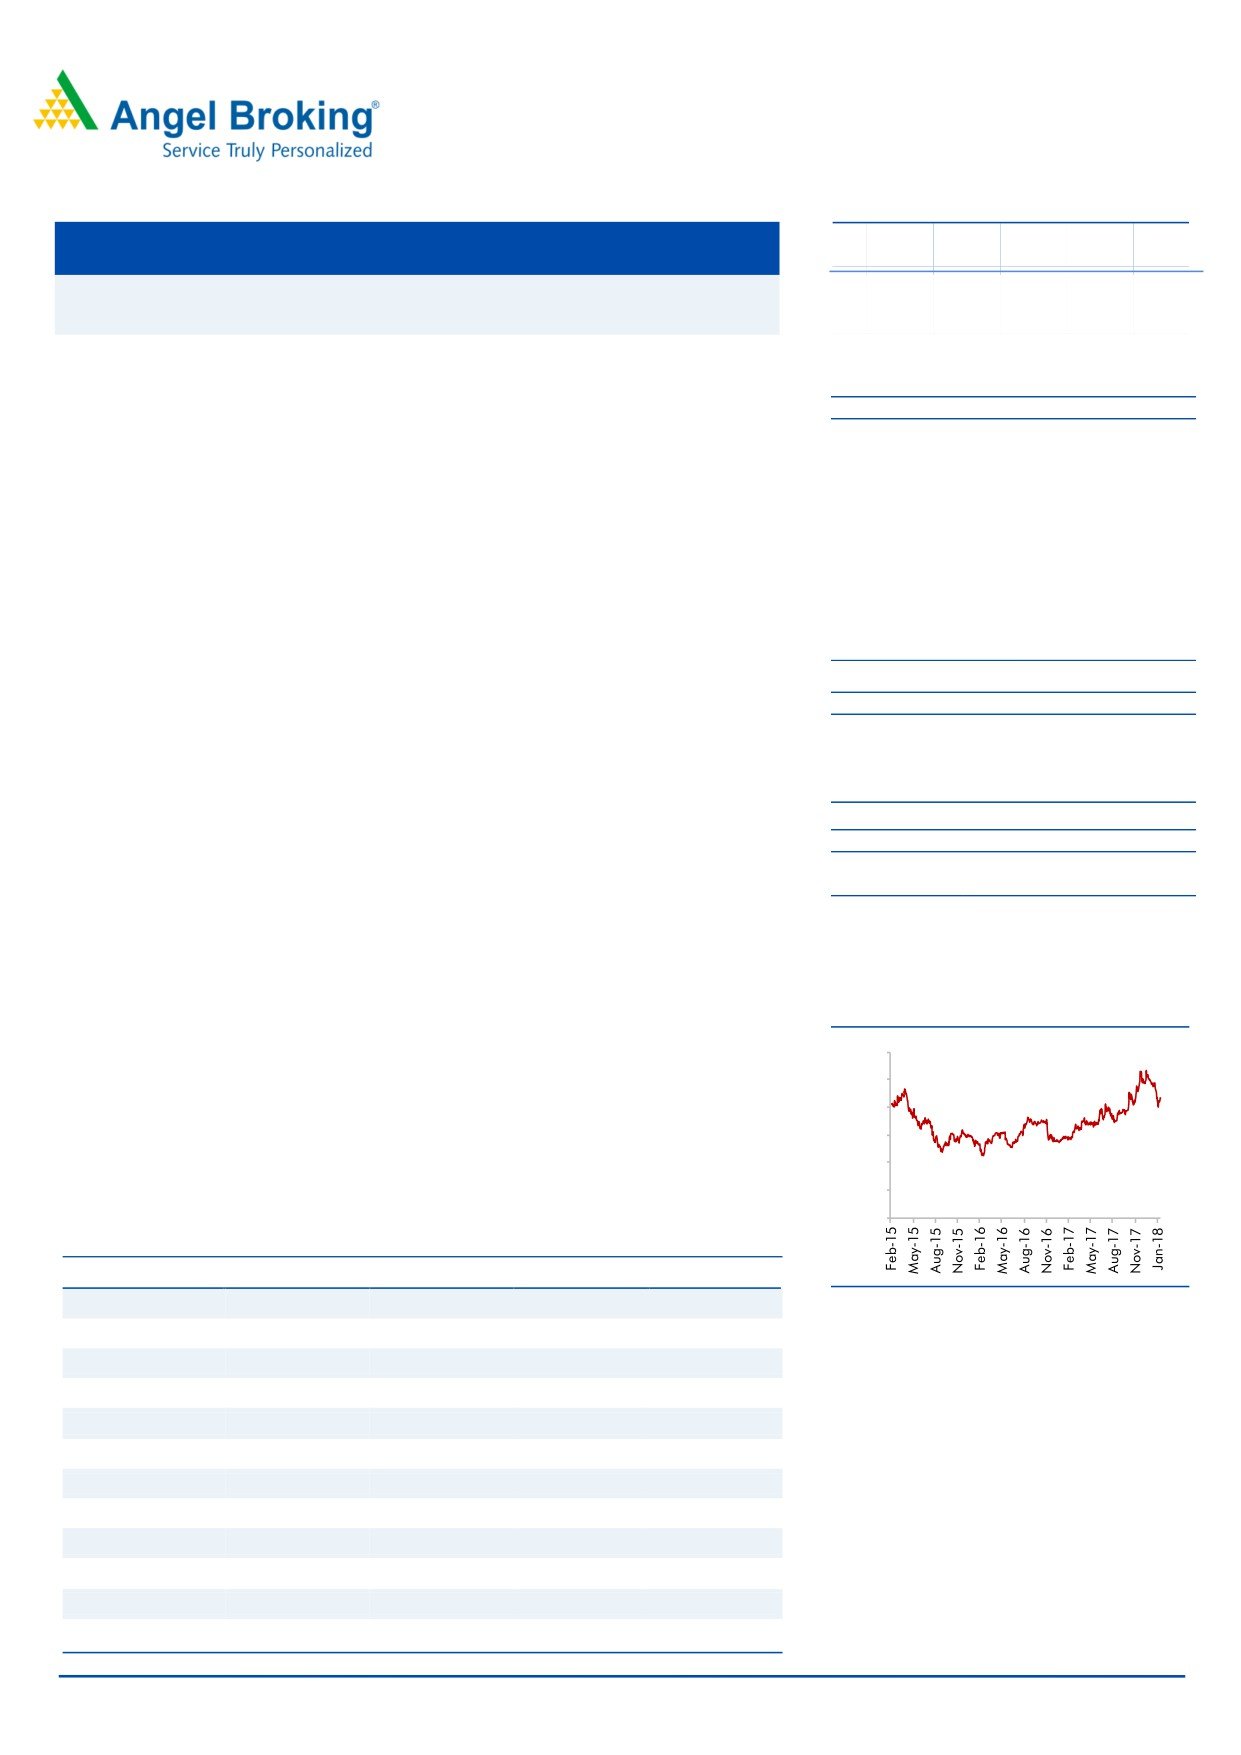
3 year daily price chart
Outlook and Valuation: Considering the various initiatives taken by the government like
smart cities, housing for all by 2022, Swachh Bharat Abhiyan and push towards
600
providing sanitation, would create new demand avenues for the sanitaryware segment.
500
Further, the company has entered into new segments like consumer, pipes and caps
and closures which will drive the further growth. We expect HSIL to report net revenue
400
CAGR of ~12% to ~`2,905cr over FY2017-20E. On bottom-line front, we expect
300
CAGR of ~15% to `154cr over FY2017-20E owing to improvement in operating
200
margins. We initiate coverage on HSIL with a Buy recommendation and target price of
100
`510, indicating an upside of ~18% from the current levels.
0
Key financials
Y/E March (` cr)
FY2017
FY2018E
FY2019E
FY2020E
Net Sales
2,078
2,204
2,506
2,905
Source: Company, Angel Research
% chg
5.0
6.0
13.7
15.9
Net Profit
100
81
114
154
% chg
(7.6)
(19.1)
40.5
34.7
Amarjeet S Maurya
OPM (%)
13.8
12.5
13.3
13.9
022-39357800 Ext: 6831
EPS (`)
13.9
11.2
15.8
21.2
P/E (x)
31.2
38.6
27.5
20.4
P/BV (x)
2.2
2.1
2.0
1.8
RoE (%)
6.9
5.4
7.2
9.0
RoCE (%)
7.4
6.6
8.4
10.1
EV/Sales (x)
1.8
1.7
1.5
1.4
EV/EBITDA (x)
13.2
14.0
11.6
9.8
Source: Company, Angel Research, Note: CMP as of February 15, 2018
Please refer to important disclosures at the end of this report
1
Quick take
HSIL
Investment rational
Strong demand for sanitaryware to benefit HSIL: The current market size of
sanitaryware is around `4,000-4,200cr. The market is expected to grow at ~10%
CAGR going forward on the back of increasing disposable income, urbanization,
evolving preferences and government initiatives (Swachh Bharat, Housing for All, Smart
cities, etc). Going forward, we estimate that HSIL would benefit from the expanding
sanitaryware industry backed by strong distribution network, good brand recall and
introduction of new products, which will aid in gaining market share and increase
revenues.
Container glass business to be driven by demand revival: Indian market for container
glass is estimated at ~`7,000cr, which is expected to grow at 4-5% CAGR going
forward. HSIL manufactures container glass for packaging needs of the companies in
the user industry (beverages, liquor, pharma, food industry, etc). HSIL is prominent
player in the container glass segment in India. In our view, strong growth of companies
in the user industry will lead to higher growth for HSIL.
Forayed into newer segments to boost additional growth: During FY16, the company
has forayed into consumer segment, from which the company is expecting sales
turnover of `500cr over the next 2 years with 10% of EBIT margin. Further, HSIL has
expected to launch security caps and closures in 1QFY19, which would be able to
generate revenue around `130cr on full operating basis (EBIT is around 20-25%).
Moreover, HSIL is also entering the PVC Pipe segment, which is expected to start
commercial production around in FY19 (will be able to generate revenue ~`400cr on
peak utilization).
De-merger of Building material and consumer segment to unlock the value: HSIL is
demerging its consumer and building materials business, which is expected to be
completed by July 2018. In this demerger, branding, marketing, sales, distribution, etc.
of consumer products and that of furniture, furnishings, home décor (Retail
Undertaking) will be demerged into an entity named Somany Home Innovation Limited
(SHIL). Moreover, branding, marketing, sales, distribution, etc. of building products
(BPDM) will be transferred to Brilloca Limited, which will be a wholly owned step down
subsidiary of SHIL. Post sanction of this scheme, SHIL will apply for listing on respective
stock exchanges. HSIL will retain the manufacturing of all the building & consumer
products in addition to manufacturing and sales of packaging products (Glassware).
February 16, 2018
2
Quick take
HSIL
Company Background
HSIL Limited is an Indian company, which offers sanitaryware, faucets and glass
bottles. The company's segments include building products division and packaging
products division. The building products division's products include sanitaryware, such
as water closets, wash basins, pedestals, squatting pans, urinals, cisterns and bidets;
wellness, such as bath tubs, shower panels, shower enclosures and whirlpools;
faucets/showers, such as showers, bathroom faucets and kitchen faucets; allied
products, such as seat covers and concealed cisterns; and consumer products, such as
kitchen appliances (vents, chimneys, waste crusher system, hobs and cooktops), water
heaters/geysers, air purifier and kitchen sink. The packaging products division's
products include glass containers, polyethylene terephthalate (PET) bottles, security caps
and closures. The company's brands include QUEO, Amore, Hindware Italian
Collection/Hindware Art, Benelave, Raasi, Moonbow, EVOK, AGI and Garden
Polymers.
Outlook and Valuation
Considering the various initiatives taken by the government like smart cities, housing for
all by 2022, Swachh Bharat Abhiyan and push towards providing sanitation, would
create new demand avenues for the sanitaryware segment. Further, the company has
entered into new segments like consumer, pipes and caps and closures which will drive
the further growth. We expect HSIL to report net revenue CAGR of ~12% to ~`2,905cr
over FY2017-20E. On bottom-line front, we expect CAGR of ~15% to `154cr over
FY2017-20E owing to improvement in operating margins. We initiate coverage on HSIL
with a Buy recommendation and target price of `510, indicating an upside of ~18%
from the current levels.
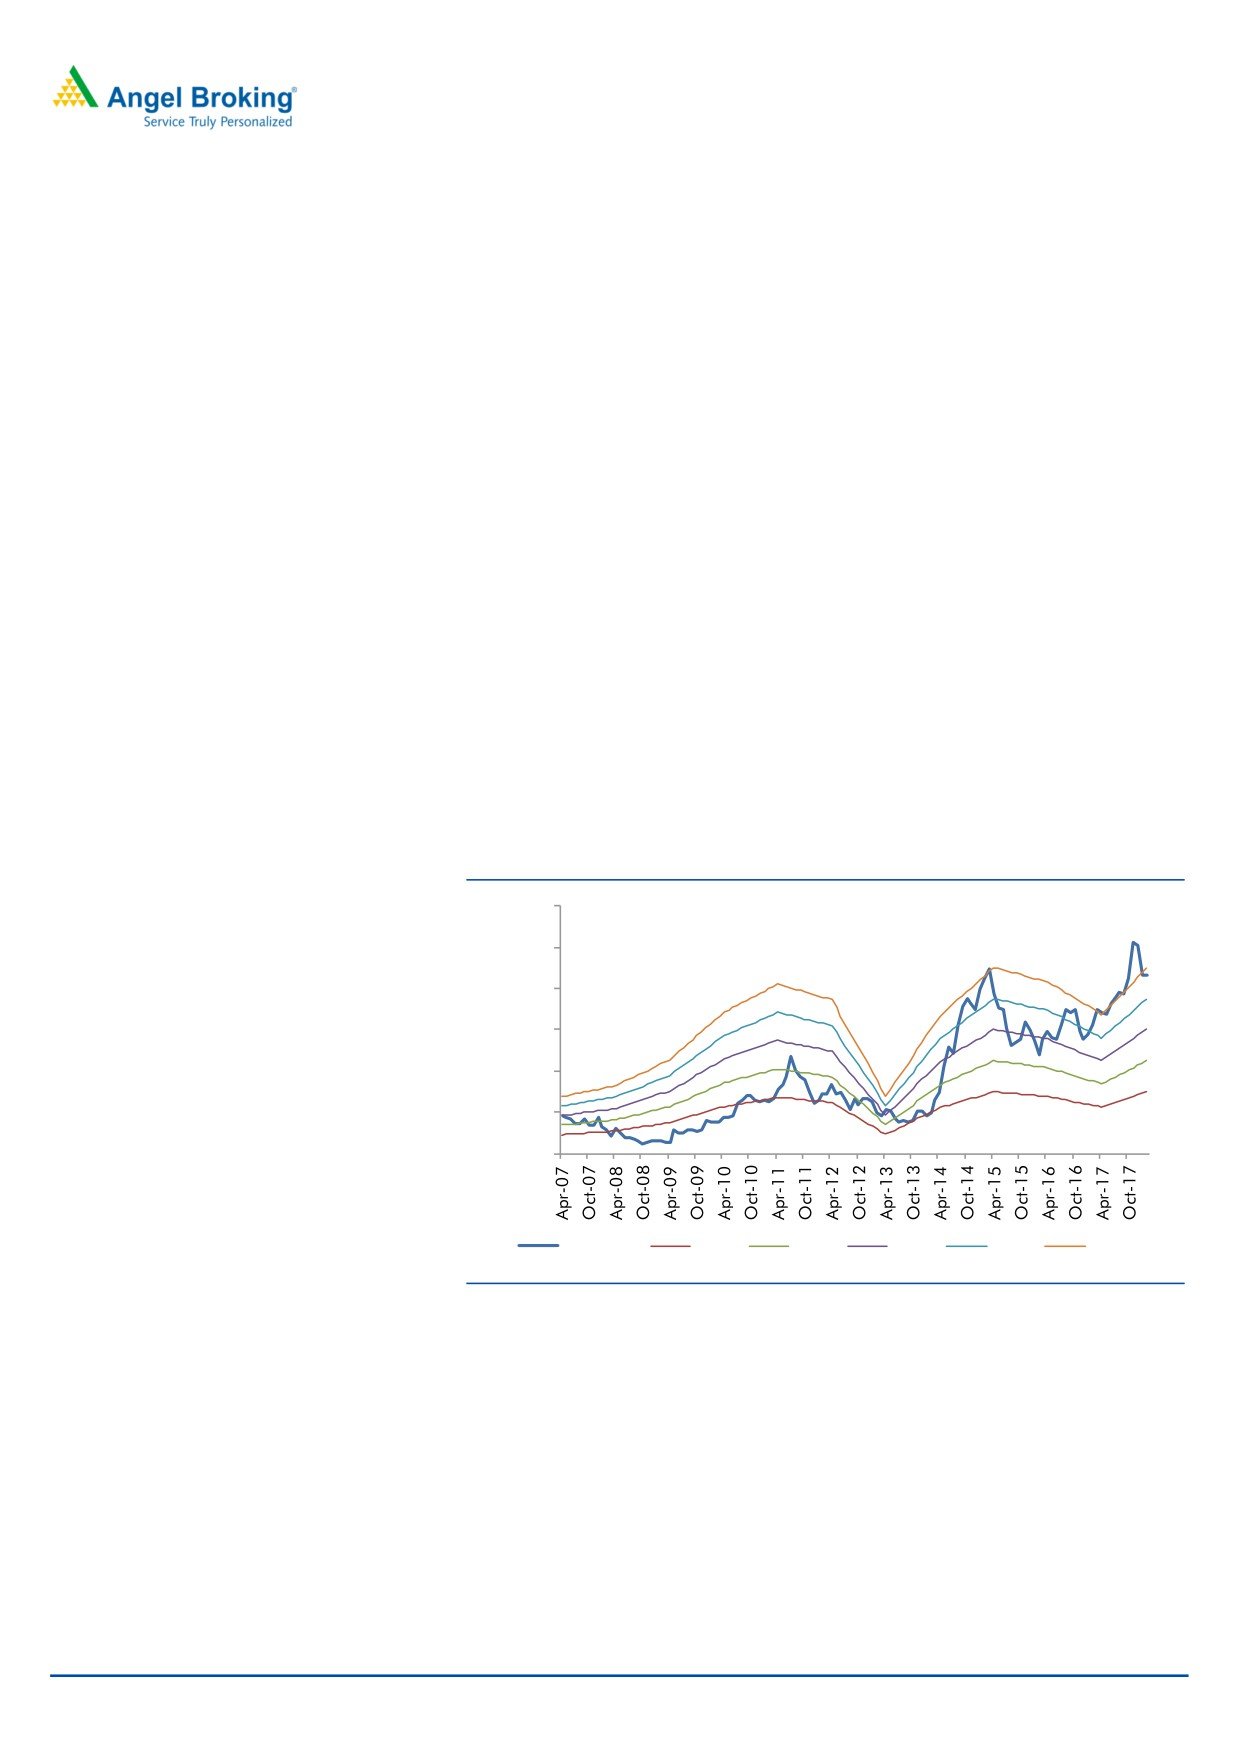
Exhibit 1: One year forward PE chart
600.00
500.00
400.00
300.00
200.00
100.00
0.00
Share Price
10.0 X
15.0 X
20.0 X
25.0 X
30.0 X
Source: Company, Angel Research
Risks to our estimates
Increase in input costs (sand, sandstone, clays, chemical fitting &
accessories purchased) could negatively impact profitability of
sanitaryware business and any increase in the price of soda ash (important
for the container glass business) would impact it negatively.
HSIL faces competition from domestic as well as international companies
(Chinese sanitaryware), which is a major threat for the company.
Any slowdown in Real estate sector could negatively impact the demand
for Sanitaryware products.
February 16, 2018
3
Quick take
HSIL
Consolidated Profit & Loss Statement
Y/E March (` cr)
FY2016
FY2017
FY2018E
FY2019E
FY2020E
Net Sales
1,979
2,078
2,204
2,506
2,905
% chg
(0.1)
5.0
6.0
13.7
15.9
Total Expenditure
1,663
1,791
1,928
2,173
2,502
Raw Material
763
805
855
975
1,133
Personnel
251
287
309
353
412
Power, Oil & Fuel
232
244
304
356
415
Others Expenses
418
456
461
489
541
EBITDA
315
287
275
333
403
% chg
(5.2)
(9.1)
(3.9)
21.0
20.8
(% of Net Sales)
15.9
13.8
12.5
13.3
13.9
Depreciation& Amortization
115
111
112
118
126
EBIT
201
176
164
216
277
% chg
(3.3)
(12.4)
(7.0)
31.8
28.4
(% of Net Sales)
10.1
8.5
7.4
8.6
9.5
Interest & other Charges
41
33
47
51
53
Other Income
15
5
5
6
6
(% of PBT)
8.5
3.1
4.1
3.2
2.6
Share in profit of Associ ates
-
-
-
-
-
Recurring PBT
174
147
121
170
229
% chg
30.4
(15.6)
(17.6)
40.5
34.7
Tax
66
47
40
56
76
(% of PBT)
37.7
31.7
33.0
33.0
33.0
PAT (reported)
109
100
81
114
154
% chg
27.0
(7.6)
(19.1)
40.5
34.7
(% of Net Sales)
5.5
4.8
3.7
4.5
5.3
Basic EPS (`)
15.0
13.9
11.2
15.8
21.2
Fully Diluted EPS (`)
15.0
13.9
11.2
15.8
21.2
% chg
27.0
(7.6)
(19.1)
40.5
34.7
February 16, 2018
4
Quick take
HSIL
Consolidated Balance Sheet
Y/E March (` cr)
FY2016
FY2017E
FY2018E
FY2019E
FY2020E
SOURCES OF FUNDS
Equity Share Capital
14
14
15
15
15
Reserves& Surplus
1,372
1,432
1,484
1,569
1,694
Shareholders Funds
1,387
1,447
1,499
1,584
1,709
Minority Interest
-
-
-
-
-
Total Loans
622
933
963
993
1,023
Deferred Tax Liability
247
242
242
242
242
Total Liabilities
2,256
2,621
2,704
2,819
2,974
APPLICATION OF FUNDS
Gross Block
1,628
1,730
1,880
1,980
2,080
Less: Acc. De preciation
113
223
335
453
579
Net Block
1,514
1,507
1,545
1,528
1,502
Capital Work-in-Progress
63
152
-
-
-
Investments
29
136
136
136
136
Current Assets
1,049
1,290
1,417
1,631
1,928
Inventories
490
493
537
625
740
Sundry De btors
390
398
435
508
605
Cash
20
144
114
110
89
Loans & Advances
51
68
88
113
145
Other Assets
97
187
242
276
349
Current liabilities
438
498
429
510
626
Net Current Assets
611
792
988
1,121
1,302
Deferred Tax Asset
40
34
34
34
34
Mis. Exp. not written off
-
-
-
-
-
Total Assets
2,256
2,621
2,704
2,819
2,974
February 16, 2018
5
Quick take
HSIL
Consolidated Cash flow Statement
Y/E March (` cr)
FY2016
FY2017
FY2018E FY2019E FY2020E
Profit before tax
174
147
121
170
229
Depreciation
115
111
112
118
126
Change in Working Capital
55
(16)
(226)
(137)
(202)
Interest / Dividend (Net)
39
32
0
0
0
Direct taxes paid
(71)
(73)
(40)
(56)
(76)
Others
(1)
4
0
0
0
C ash Flow from Operati ons
311
204
(33)
95
78
(Inc.)/ Dec. i n Fixed Assets
(74)
(224)
(150)
(100)
(100)
(Inc.)/ Dec. i n Inve stments
8
(104)
155
3
3
C ash Flow from Inve sting
(66)
(329)
5
(97)
(97)
Issue of Equity
0
0
0
0
0
Inc./(Dec.) in loans
80
211
30
30
30
Dividend Paid (Incl. T ax)
(25)
(29)
(29)
(29)
(29)
Interest / Divide nd (Net)
(302)
65
2
(3)
(3)
C ash Flow from Financing
(247)
248
3
(2)
(2)
Inc./(Dec.) in Cash
(3)
123
(26)
(4)
(21)
O pening Cash balance s
19
17
140
114
110
Closing Cash balances
17
140
114
110
89
February 16, 2018
6
Quick take
HSIL
Key Ratios
Y/E March
FY2016
FY2017
FY2018E
FY2019E
FY2020E
Valuati on Ratio (x)
P/E (on FDEPS)
28.9
31.2
38.6
27.5
20.4
P/CEPS
14.0
14.8
16.2
13.5
11.2
P/BV
2.3
2.2
2.1
2.0
1.8
Dividend yield (%)
0.9
0.9
0.9
0.9
0.9
EV/Sales
1.9
1.8
1.7
1.5
1.4
EV/EBITDA
11.8
13.2
14.0
11.6
9.8
EV / Total Assets
1.6
1.4
1.4
1.4
1.3
Per Share Data (Rs)
EPS (Basic)
15.0
13.9
11.2
15.8
21.2
EPS (fully diluted)
15.0
13.9
11.2
15.8
21.2
Cash EPS
30.9
29.2
26.7
32.1
38.7
DPS
4.0
4.0
4.0
4.0
4.0
Book Value
191.8
200.1
207.4
219.1
236.4
Returns (%)
ROCE
10.0
7.4
6.6
8.4
10.1
Angel ROIC (Pre-tax)
10.2
8.4
7.4
9.2
11.0
ROE
7.8
6.9
5.4
7.2
9.0
Turnover rati os (x)
Asset Turnover (Gross Block)
1.2
1.2
1.2
1.3
1.4
Inventory / S ales (days)
90
87
89
91
93
Receivables (days)
72
70
72
74
76
Payables (days)
31
39
39
39
40
Working capital cycle (ex-cash) (days)
131
118
122
126
129
Source: Company, Angel Research
February 16, 2018
7
Quick take
HSIL
Research Team Tel: 022 - 39357800
DISCLAIMER
Angel Broking Private Limited (hereinafter referred to as “Angel”) is a registered Member of National Stock Exchange of India Limited,
Bombay Stock Exchange Limited and MCX Stock Exchange Limited. It is also registered as a Depository Participant with CDSL and
Portfolio Manager with SEBI. It also has registration with AMFI as a Mutual Fund Distributor. Angel Broking Private Limited is a
registered entity with SEBI for Research Analyst in terms of SEBI (Research Analyst) Regulations, 2014 vide registration numb er
INH000000164. Angel or its associates has not been debarred/ suspended by SEBI or any other regulatory authority for accessing
/dealing in securities Market. Angel or its associates including its relatives/analyst do not hold any financial interest/ben eficial
ownership of more than 1% in the company covered by Analyst. Angel or its associates/analyst has not received any compensation /
managed or co-managed public offering of securities of the company covered by Analyst during the past twelve months. Angel/analyst
has not served as an officer, director or employee of company covered by Analyst and has not been engaged in market making activity
of the company covered by Analyst.
This document is solely for the personal information of the recipient, and must not be singularly used as the basis of any investment
decision. Nothing in this document should be construed as investment or financial advice. Each recipient of this document sho uld
make such investigations as they deem necessary to arrive at an independent evaluation of an investment in the securities of the
companies referred to in this document (including the merits and risks involved), and should consult their own advisors to de termine
the merits and risks of such an investment.
Reports based on technical and derivative analysis center on studying charts of a stock's price movement, outstanding positions and
trading volume, as opposed to focusing on a company's fundamentals and, as such, may not match with a report on a company's
fundamentals.
The information in this document has been printed on the basis of publicly available information, internal data and other reliable
sources believed to be true, but we do not represent that it is accurate or complete and it should not be relied on as such, as this
document is for general guidance only. Angel Broking Pvt. Limited or any of its affiliates/ group companies shall not be in any way
responsible for any loss or damage that may arise to any person from any inadvertent error in the information contained in th is report.
Angel Broking Pvt. Limited has not independently verified all the information contained within this document. Accordingly, we canno t
testify, nor make any representation or warranty, express or implied, to the accuracy, contents or data contained within this document.
While Angel Broking Pvt. Limited endeavors to update on a reasonable basis the information discussed in this material, there may be
regulatory, compliance, or other reasons that prevent us from doing so.
This document is being supplied to you solely for your information, and its contents, information or data may not be reproduced,
redistributed or passed on, directly or indirectly.
Neither Angel Broking Pvt. Limited, nor its directors, employees or affiliates shall be liable for any loss or damage th at may arise from
or in connection with the use of this information.
Note: Please refer to the important ‘Stock Holding Disclosure' report on the Angel website (Research Section). Also, please r efer to the
latest update on respective stocks for the disclosure status in respect of those stocks. Angel Broking Pvt. Limited and its affiliates may
have investment positions in the stocks recommended in this report.
Disclosure of Interest Statement
HSIL
1. Analyst ownership of the stock
No
2. Angel and its Group companies ownership of the stock
No
3. Angel and its Group companies' Directors ownership of the stock
No
4. Broking relationship with company covered
No
Note: We have not considered any Exposure below ` 1 lakh for Angel, its Group companies and Directors
Ratings (Based on expected returns
Buy (> 15%)
Accumulate (5% to 15%)
Neutral (-5 to 5%)
over 12 months investment period):
Reduce (-5% to -15%)
Sell (< -15)
February 16, 2018
8