Derivative Report
Feb 05, 2015
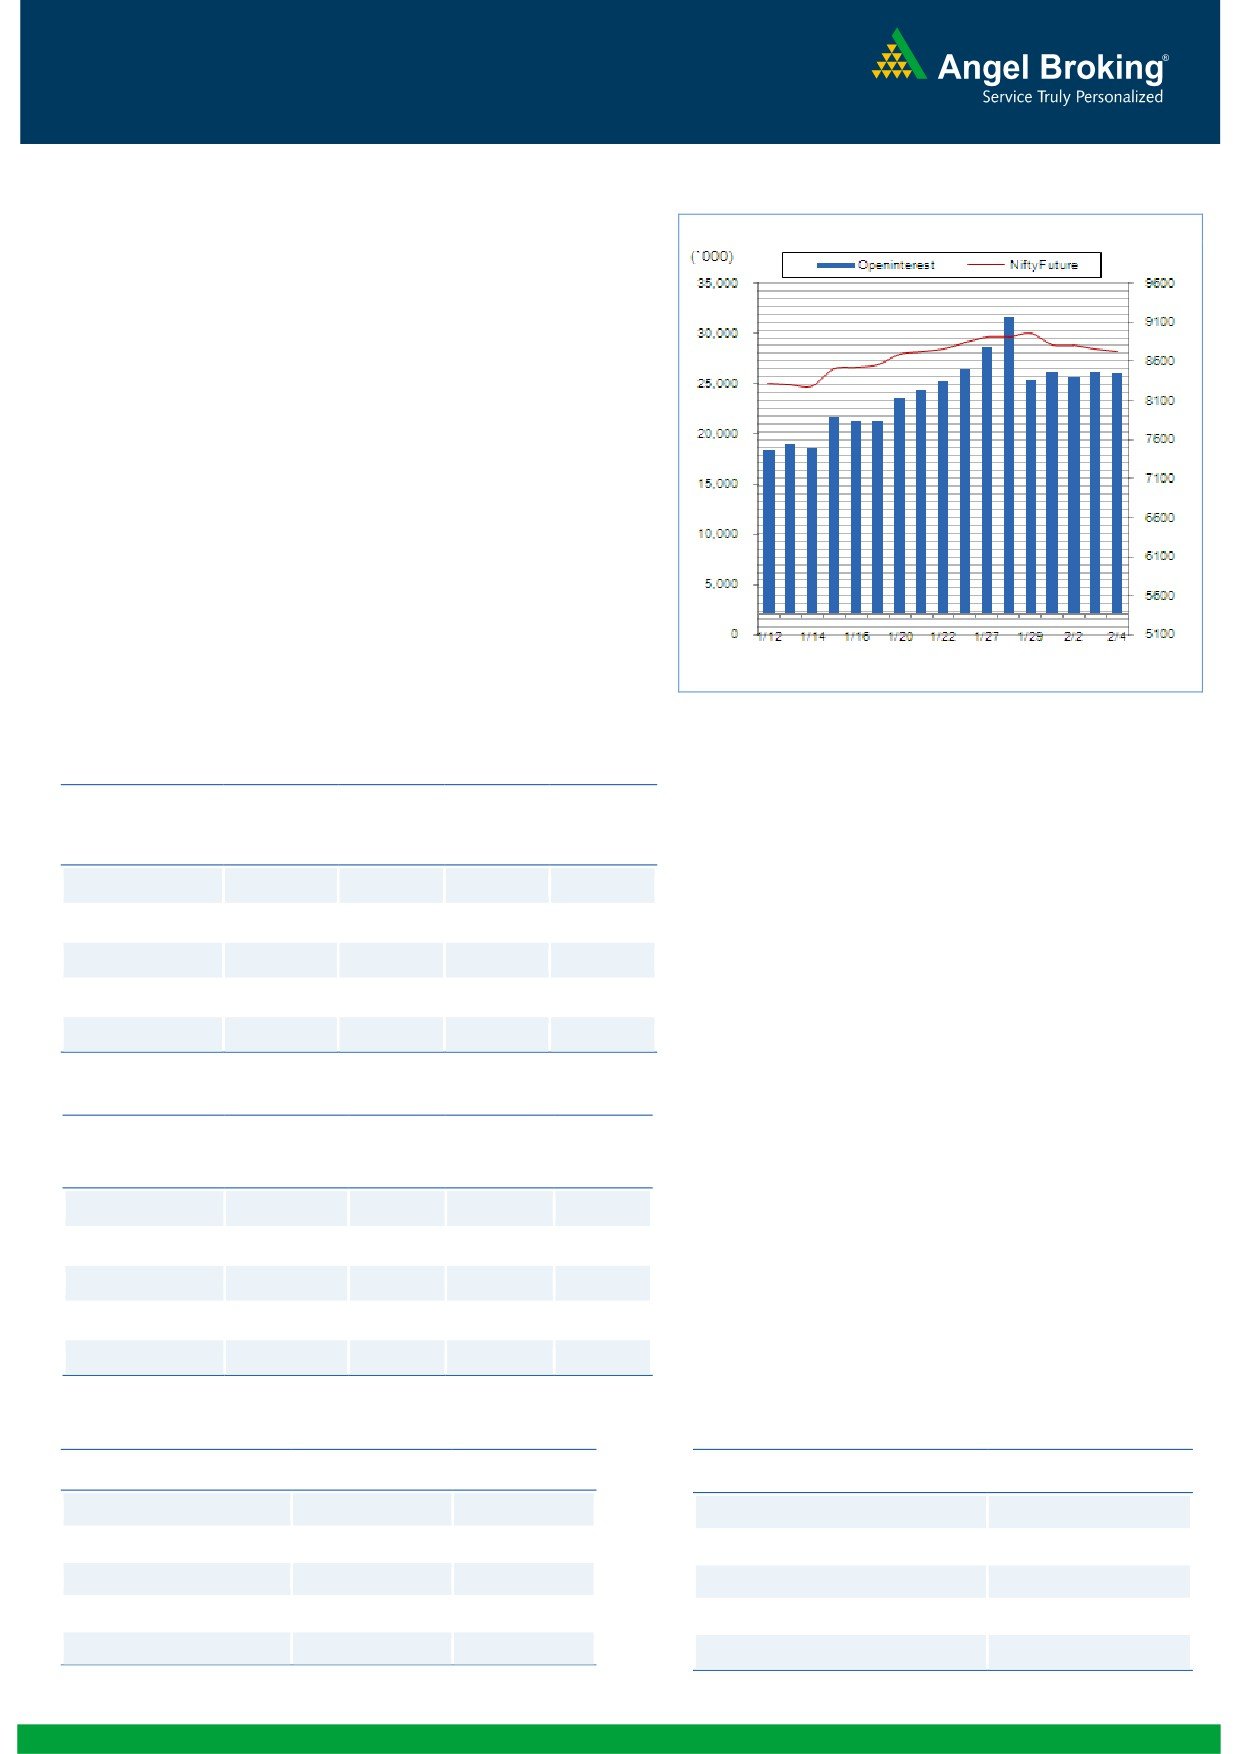
Nifty Vs OI
Comments
The Nifty futures open interest decreased by 0.41% levels
BankNifty futures open interest has decreased by 1.41%
as market closed at 8723.70 levels.
The Nifty February future closed at premium of 53.65
points against a premium of 53.35 points. The March
series closed at a premium of 112.90 points.
The Implied Volatility of at the money options has
decreased from 19.08% to 17.91%.
Nifty PCR-OI has increased from 0.85 to 0.86 levels.
The total OI of the market is Rs. 1,88,343/- cr. and the
stock futures OI is Rs. 67,792/- cr.
Few of the liquid counters where we have seen high cost
of carry are JPPOWER, HINDPETRO, OFSS, IGL and
IDFC.
View
OI Gainers
FIIs activity in cash market segment was subdued. In
OI
PRICE
Index Futures they bought of worth Rs. 220 crores
SCRIP
OI
CHANGE
PRICE
CHANGE
with fall in open interest suggesting covering of short
(%)
(%)
positions formed earlier, while they continue forming
short positions in Stock Futures.
CANBK
7420000
16.12
453.10
3.53
CROMPGREAV
18635000
15.43
167.95
-5.89
There was some buying in Index Options with rise in
open interest indicating fresh long formation. PCR-OI
IGL
599000
12.81
468.35
1.12
increased mainly due to open interest addition in put
BPCL
2902500
11.25
721.00
-0.89
options, while implied volatility decreased on the
closing basis which indicates selling in put options.
BANKINDIA
13101000
9.33
257.05
-1.48
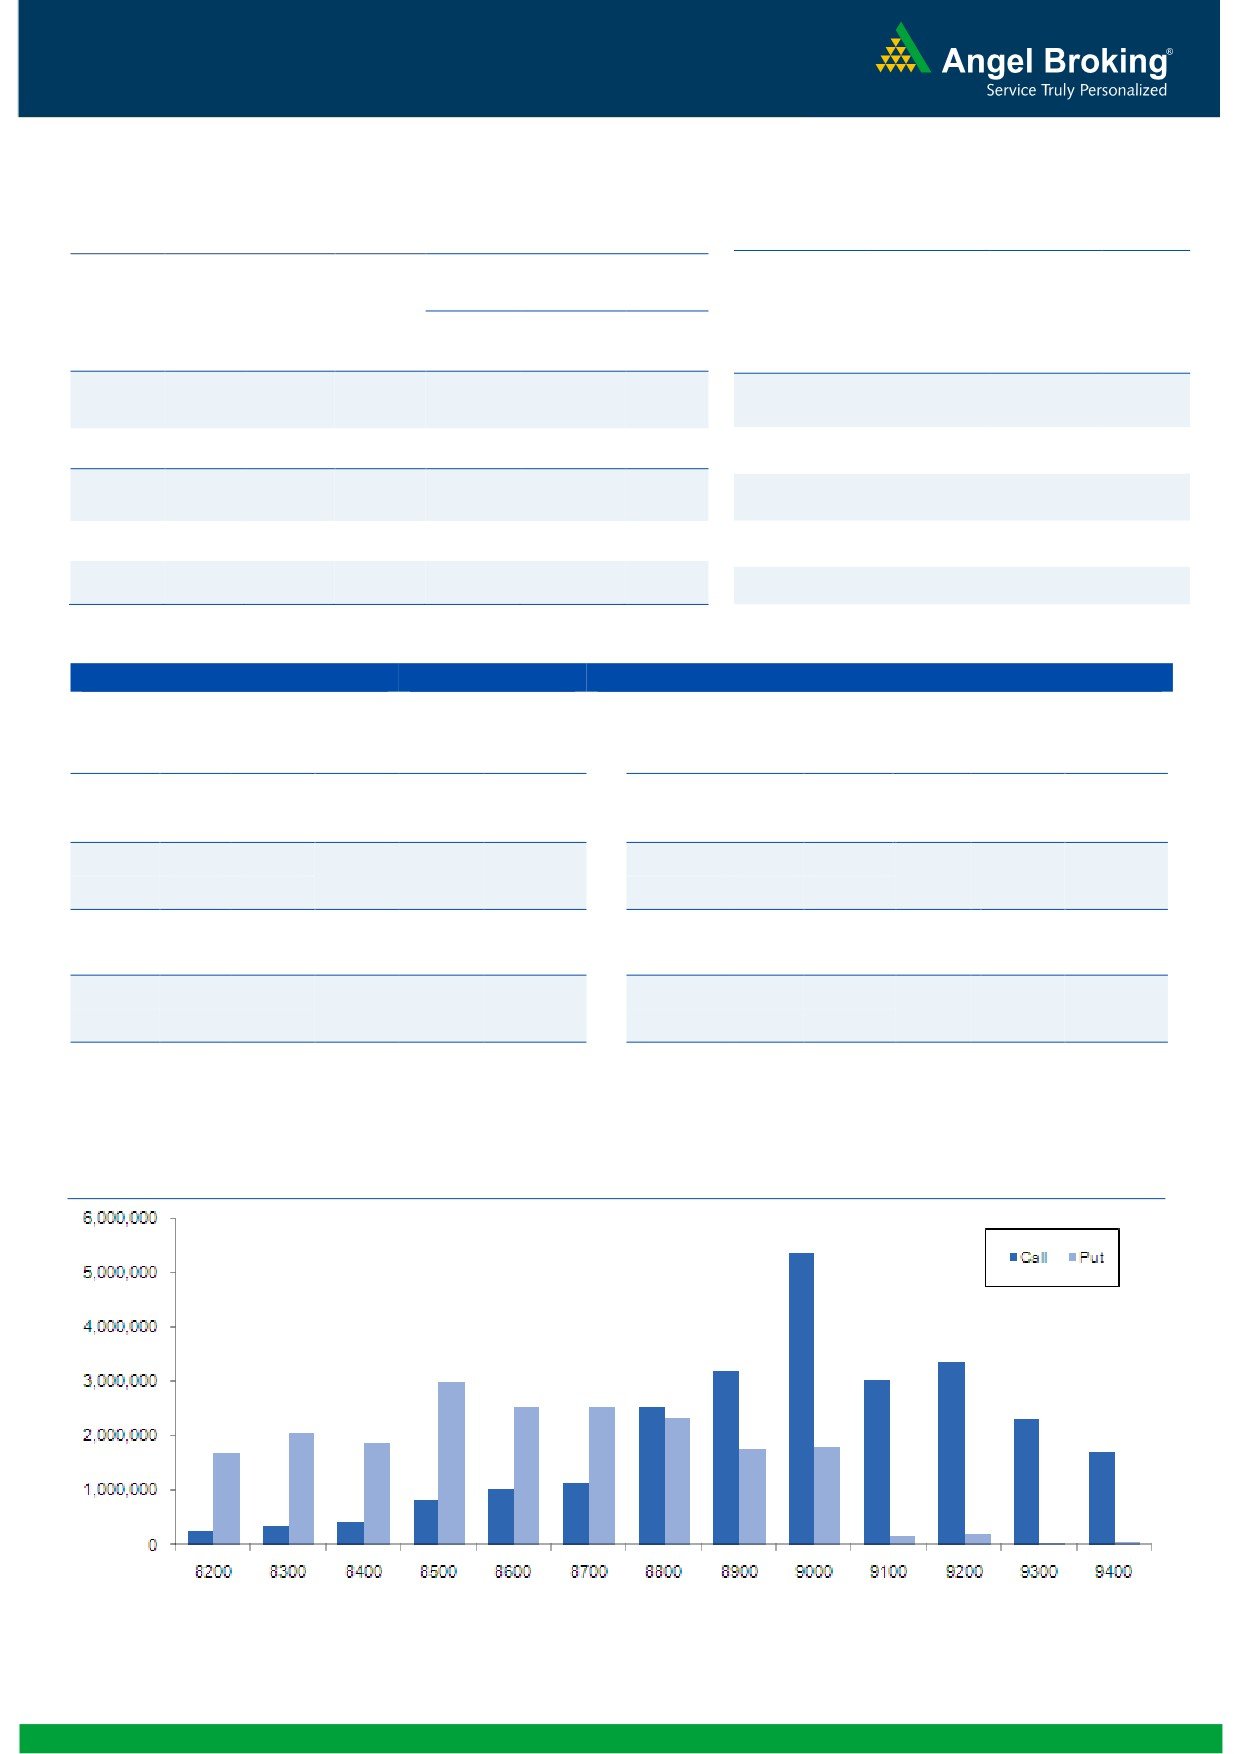
We witness decent open interest addition in the range
of 8800 & 8900 call options, which may be long
OI Losers
formation. On the other hand in put options decent
amount of open interest addition was seen in 8300 &
OI
PRICE
8700 strike prices which is mix of long & short
SCRIP
OI
CHANGE
PRICE
CHANGE
(%)
(%)
positions.
CAIRN
12693000
-13.74
253.85
3.01
Despite seeing pressure in market we are hardly
relevant profit booking or selling by FIIs in Index
MINDTREE
361250
-8.37
1320.20
1.66
Futures, they continue to buy higher call options from
M&MFIN
10932000
-7.87
261.35
1.67
last few days. Seeing the overall data we don’t see
this fall to last for long.
SSLT
24233000
-7.72
216.60
2.40
TVSMOTOR
5119000
-7.47
294.40
3.31
Put-Call Ratio
Historical Volatility
SCRIP
PCR-OI
PCR-VOL
SCRIP
HV
NIFTY
0.86
0.86
CROMPGREAV
46.64
BANKNIFTY
0.61
0.45
GODREJIND
39.03
BANKBARODA
0.31
0.31
CENTURYTEX
44.37
RELIANCE
0.49
0.44
BHEL
40.56
SBIN
0.45
0.50
GLENMARK
33.30
1
Derivative Report
Feb 05, 2015
Strategy Date
Symbol
Strategy
Status
02-02-2015
NIFTY
Ratio Bull Call Spread
Open
Research Team Tel: 022 - 39357800
DISCLAIMER
This document is solely for the personal information of the recipient, and must not be singularly used as the basis of any investment
decision. Nothing in this document should be construed as investment or financial advice. Each recipient of this document should
make such investigations as they deem necessary to arrive at an independent evaluation of an investment in the securities of the
companies referred to in this document (including the merits and risks involved), and should consult their own advisors to determine
the merits and risks of such an investment.
Angel Broking Pvt. Limited, its affiliates, directors, its proprietary trading and investment businesses may, from time to time, make
investment decisions that are inconsistent with or contradictory to the recommendations expressed herein. The views contained in
this document are those of the analyst, and the company may or may not subscribe to all the views expressed within.
Reports based on technical and derivative analysis center on studying charts of a stock's price movement, outstanding positions and
trading volume, as opposed to focusing on a company's fundamentals and, as such, may not match with a report on a company's
fundamentals.
The information in this document has been printed on the basis of publicly available information, internal data and other reliable
sources believed to be true, but we do not represent that it is accurate or complete and it should not be relied on as such, as this
document is for general guidance only. Angel Broking Pvt. Limited or any of its affiliates/ group companies shall not be in any way
responsible for any loss or damage that may arise to any person from any inadvertent error in the information contained in this
report. Angel Broking Pvt. Limited has not independently verified all the information contained within this document. Accordingly, we
cannot testify, nor make any representation or warranty, express or implied, to the accuracy, contents or data contained within this
document. While Angel Broking Pvt. Limited endeavours to update on a reasonable basis the information discussed in this material,
there may be regulatory, compliance, or other reasons that prevent us from doing so.
This document is being supplied to you solely for your information, and its contents, information or data may not be reproduced,
redistributed or passed on, directly or indirectly.
Angel Broking Pvt. Limited and its affiliates may seek to provide or have engaged in providing corporate finance, investment
banking or other advisory services in a merger or specific transaction to the companies referred to in this report, as on the date of
this report or in the past.
Neither Angel Broking Pvt. Limited, nor its directors, employees or affiliates shall be liable for any loss or damage that may arise
from or in connection with the use of this information.
Note: Please refer to the important `Stock Holding Disclosure' report on the Angel website (Research Section). Also, please refer to
the latest update on respective stocks for the disclosure status in respect of those stocks. Angel Broking Pvt. Limited and its affiliates
may have investment positions in the stocks recommended in this report.
Derivative Research Team
For Private Circulation Only
SEBI Registration No: INB 010996539
3