Technical Research | September 16, 2011
Daily Technical Report
Sensex (16877) / Nifty (5076)
Market opened marginally higher and traded with extreme
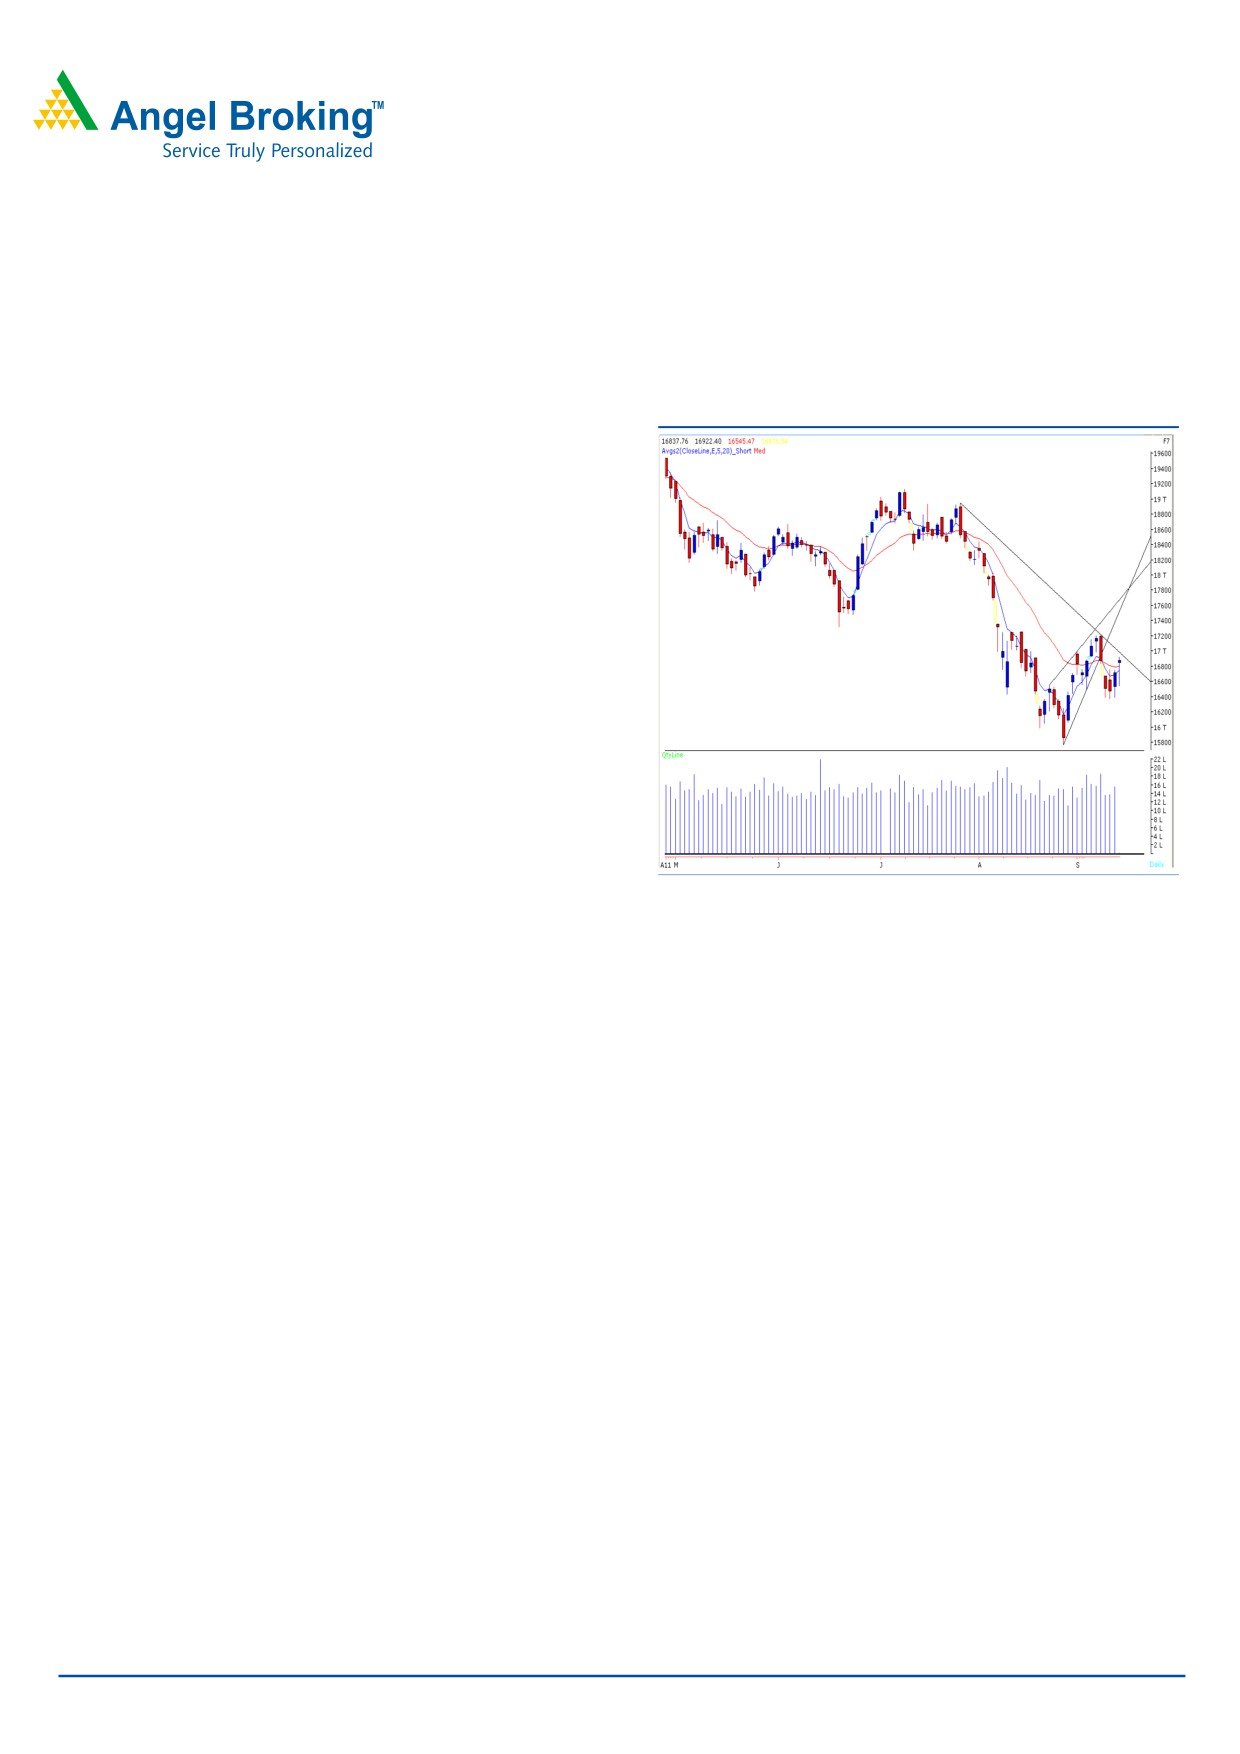
Exhibit 1: Sensex Daily Chart
choppiness throught out the trading session to close
marginally above the initial opening level. On the sector
front, Realty, IT, Teck and Banking counters were among
the major gainers whereas Capital Goods were among the
losers. The advance decline ratio was in favor of advancing
Formation
• We are observing a “Downward Sloping Trend Line” on
Daily chart.
Trading strategy:
Indices opened on an optimistic note but failed to sustain
Source: Falcon
during the initial part and corrected to test support level of
Note: As RBI monetary policy is going to be announced
16550 / 4960 level. However, we witnessed a strong surge
today, we advise traders to stay light on their positions
in the prices during the later part of the session which led
and trade with strict stoploss.
indices higher to register a high of 16922 / 5091. We are
now observing a “Downward Sloping Trend Line” joining
two highs of 18945 and 17212 / 5702 and 5169. The
trend line resistance level would come around 16930 /
5090 which also coincides with yesterday’s high. Therefore,
if indices manage to break and sustain above yesterday’s
high then there is likelihood that we may witness a break
out from this mentioned trend line. In this case, indices may
rally towards 17212 / 5169 level. On the other hand,
yesterday’s high also coincides with
61.8% Fibonacci
retracement level of the fall from 17212 to 16374 / 5169
to 4911 levels which may act as strong resistance. In such
scenario, indices may test support levels of 16766 - 16545
/ 5030 - 4967.
For Private Circulation Only |
1
T
Technical Report
RESEARCH TEAM
Shardul Kulkarni
Head - Technicals
Sameet Chavan
Technical Analyst
Sacchitanand Uttekar
Technical Analyst
Mehul Kothari
Technical Analyst
Ankur Lakhotia
Technical Analyst
Research Team: 022-3935 7600
DISCLAIMER: This document is not for public distribution and has been furnished to you solely for your information
and must not be reproduced or redistributed to any other person. Persons into whose possession this document may
come are required to observe these restrictions.
Opinion expressed is our current opinion as of the date appearing on this material only. While we endeavor to update
on a reasonable basis the information discussed in this material, there may be regulatory, compliance, or other reasons
that prevent us from doing so. Prospective investors and others are cautioned that any forward-looking statements are
not predictions and may be subject to change without notice. Our proprietary trading and investment businesses may
make investment decisions that are inconsistent with the recommendations expressed herein.
The information in this document has been printed on the basis of publicly available information, internal data and
other reliable sources believed to be true and are for general guidance only. While every effort is made to ensure the
accuracy and completeness of information contained, the company takes no guarantee and assumes no liability for any
errors or omissions of the information. No one can use the information as the basis for any claim, demand or cause of
action.
Recipients of this material should rely on their own investigations and take their own professional advice. Each recipient
of this document should make such investigations as it deems necessary to arrive at an independent evaluation of an
investment in the securities of companies referred to in this document (including the merits and risks involved), and
should consult their own advisors to determine the merits and risks of such an investment. Price and value of the
investments referred to in this material may go up or down. Past performance is not a guide for future performance.
Certain transactions - futures, options and other derivatives as well as non-investment grade securities - involve
substantial risks and are not suitable for all investors. Reports based on technical analysis centers on studying charts of a
stock's price movement and trading volume, as opposed to focusing on a company's fundamentals and as such, may
not match with a report on a company's fundamentals.
We do not undertake to advise you as to any change of our views expressed in this document. While we would
endeavor to update the information herein on a reasonable basis, Angel Broking, its subsidiaries and associated
companies, their directors and employees are under no obligation to update or keep the information current. Also there
may be regulatory, compliance, or other reasons that may prevent Angel Broking and affiliates from doing so.
Prospective investors and others are cautioned that any forward-looking statements are not predictions and may be
subject to change without notice.
Angel Broking Limited and affiliates, including the analyst who has issued this report, may, on the date of this report,
and from time to time, have long or short positions in, and buy or sell the securities of the companies mentioned herein
or engage in any other transaction involving such securities and earn brokerage or compensation or act as advisor or
have other potential conflict of interest with respect to company/ies mentioned herein or inconsistent with any
recommendation and related information and opinions.
Angel Broking Limited and affiliates may seek to provide or have engaged in providing corporate finance, investment
banking or other advisory services in a merger or specific transaction to the companies referred to in this report, as on
the date of this report or in the past.
Sebi Registration No : INB 010996539
For Private Circulation Only |