Technical Research | September 07, 2011
Daily Technical Report
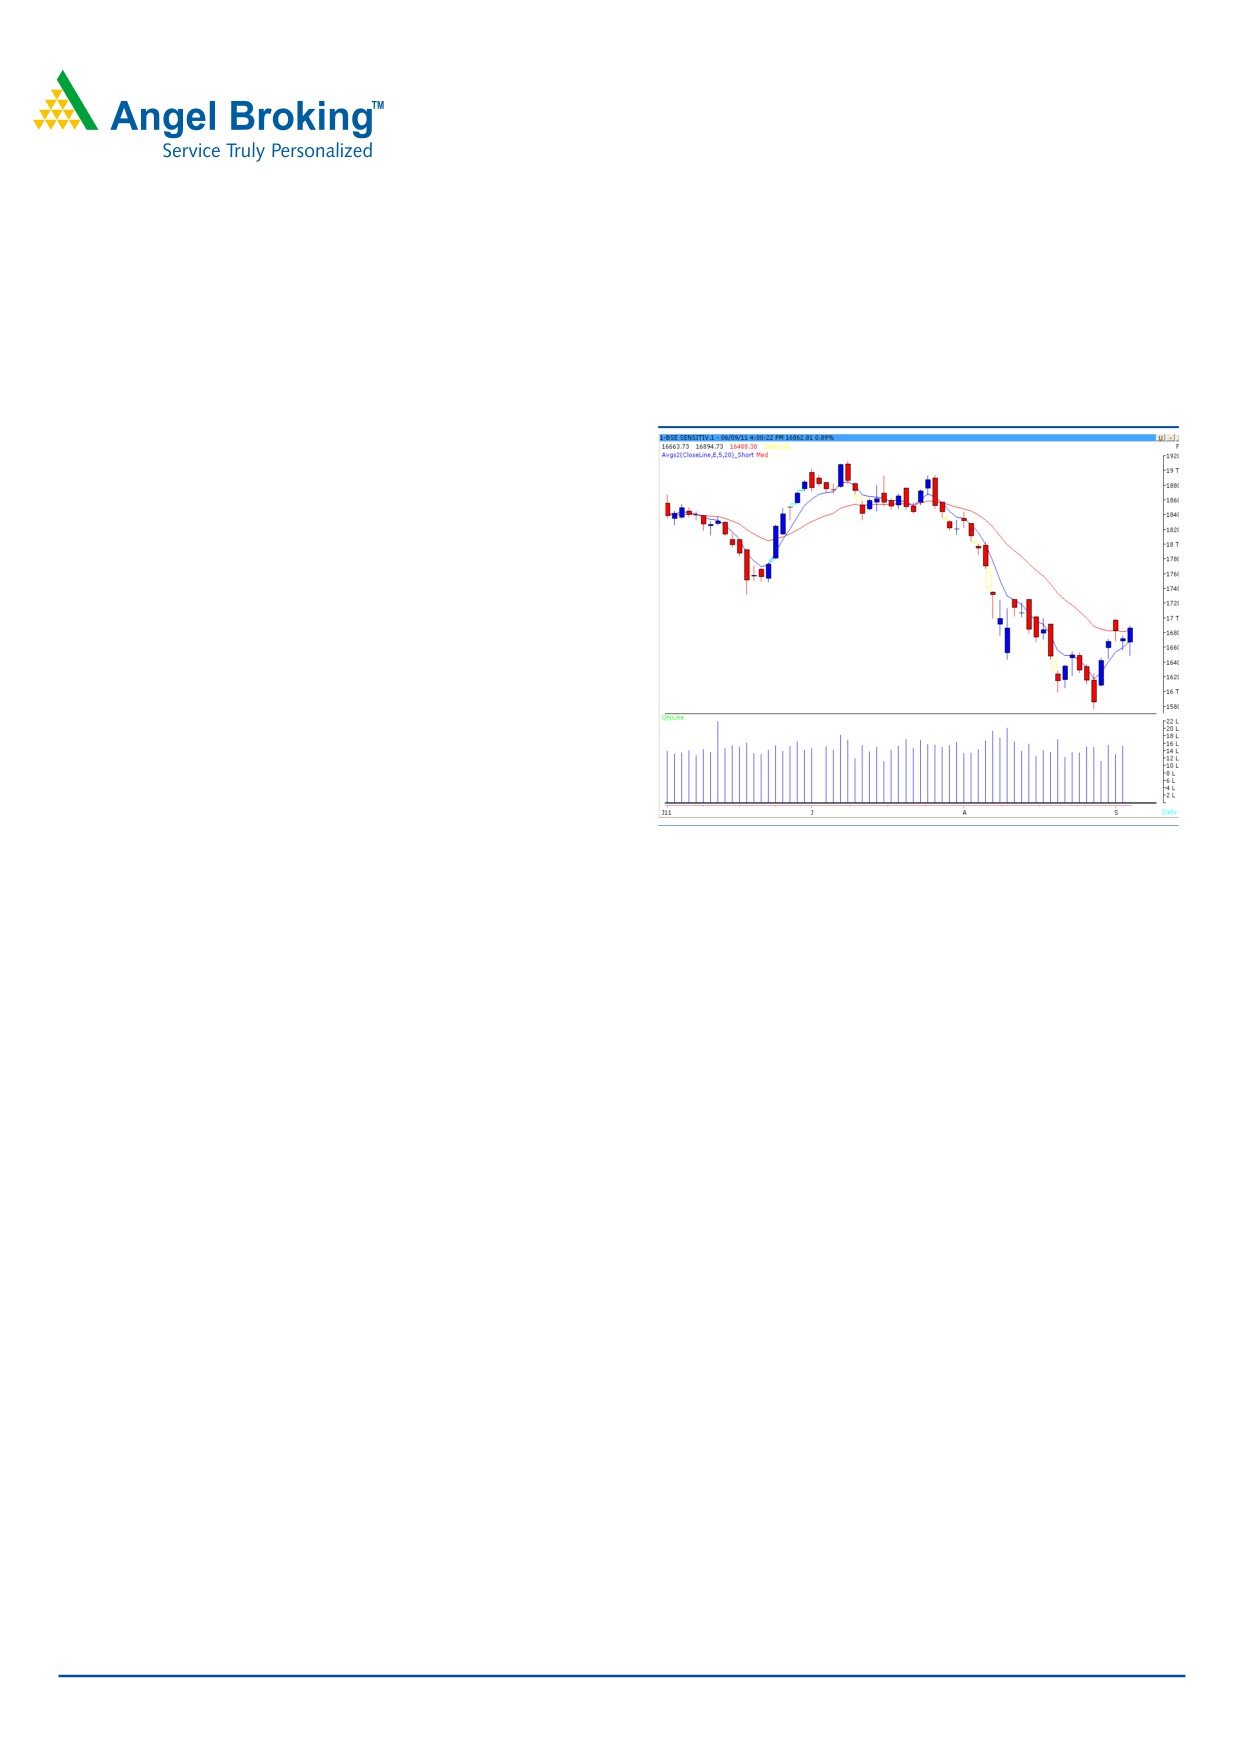
Sensex (16863) / Nifty (5064)
Markets opened on a flat note and traded in a wide range
Exhibit 1: Sensex Daily Chart
throughout the day to close marginally above 20 Days
EMA. On the sector front, Oil & Gas, IT and Capital Goods
counters were among the major gainers whereas Realty
counters ended with a loss. The advance decline ratio was
in favor of advancing counters (A=1633 D=1169). (Source
Formation
• Indices have closed marginally above “20 EMA” on the
Daily chart. EMA is placed at 16815 / 5048 level.
Trading strategy:
Source: Falcon
Our benchmark indices opened on a quite note, but buying
emerged at lower levels and indices closed marginally
above 20 days EMA at 16815 / 5048.Going forward, if
indices manage to sustain above yesterday’s high of 16895
/ 5073 then they are likely to rally towards 16990 - 17100
/ 5114 - 5150 levels. On the downside, 16700 - 16488 /
5000 - 4942 levels may provide decent support for the
indices. Any violation of these levels can attract some
selling pressure which may drag indices lower to test 16377
- 16230 / 4916 - 4870 levels.
For Private Circulation Only |
1
T
Technical Report
RESEARCH TEAM
Shardul Kulkarni
Head - Technicals
Sameet Chavan
Technical Analyst
Sacchitanand Uttekar
Technical Analyst
Mehul Kothari
Technical Analyst
Ankur Lakhotia
Technical Analyst
Research Team: 022-3935 7600
DISCLAIMER: This document is not for public distribution and has been furnished to you solely for your information
and must not be reproduced or redistributed to any other person. Persons into whose possession this document may
come are required to observe these restrictions.
Opinion expressed is our current opinion as of the date appearing on this material only. While we endeavor to update
on a reasonable basis the information discussed in this material, there may be regulatory, compliance, or other reasons
that prevent us from doing so. Prospective investors and others are cautioned that any forward-looking statements are
not predictions and may be subject to change without notice. Our proprietary trading and investment businesses may
make investment decisions that are inconsistent with the recommendations expressed herein.
The information in this document has been printed on the basis of publicly available information, internal data and
other reliable sources believed to be true and are for general guidance only. While every effort is made to ensure the
accuracy and completeness of information contained, the company takes no guarantee and assumes no liability for any
errors or omissions of the information. No one can use the information as the basis for any claim, demand or cause of
action.
Recipients of this material should rely on their own investigations and take their own professional advice. Each recipient
of this document should make such investigations as it deems necessary to arrive at an independent evaluation of an
investment in the securities of companies referred to in this document (including the merits and risks involved), and
should consult their own advisors to determine the merits and risks of such an investment. Price and value of the
investments referred to in this material may go up or down. Past performance is not a guide for future performance.
Certain transactions - futures, options and other derivatives as well as non-investment grade securities - involve
substantial risks and are not suitable for all investors. Reports based on technical analysis centers on studying charts of a
stock's price movement and trading volume, as opposed to focusing on a company's fundamentals and as such, may
not match with a report on a company's fundamentals.
We do not undertake to advise you as to any change of our views expressed in this document. While we would
endeavor to update the information herein on a reasonable basis, Angel Broking, its subsidiaries and associated
companies, their directors and employees are under no obligation to update or keep the information current. Also there
may be regulatory, compliance, or other reasons that may prevent Angel Broking and affiliates from doing so.
Prospective investors and others are cautioned that any forward-looking statements are not predictions and may be
subject to change without notice.
Angel Broking Limited and affiliates, including the analyst who has issued this report, may, on the date of this report,
and from time to time, have long or short positions in, and buy or sell the securities of the companies mentioned herein
or engage in any other transaction involving such securities and earn brokerage or compensation or act as advisor or
have other potential conflict of interest with respect to company/ies mentioned herein or inconsistent with any
recommendation and related information and opinions.
Angel Broking Limited and affiliates may seek to provide or have engaged in providing corporate finance, investment
banking or other advisory services in a merger or specific transaction to the companies referred to in this report, as on
the date of this report or in the past.
Sebi Registration No : INB 010996539
For Private Circulation Only |