Daily Technical Report
August 31, 2012
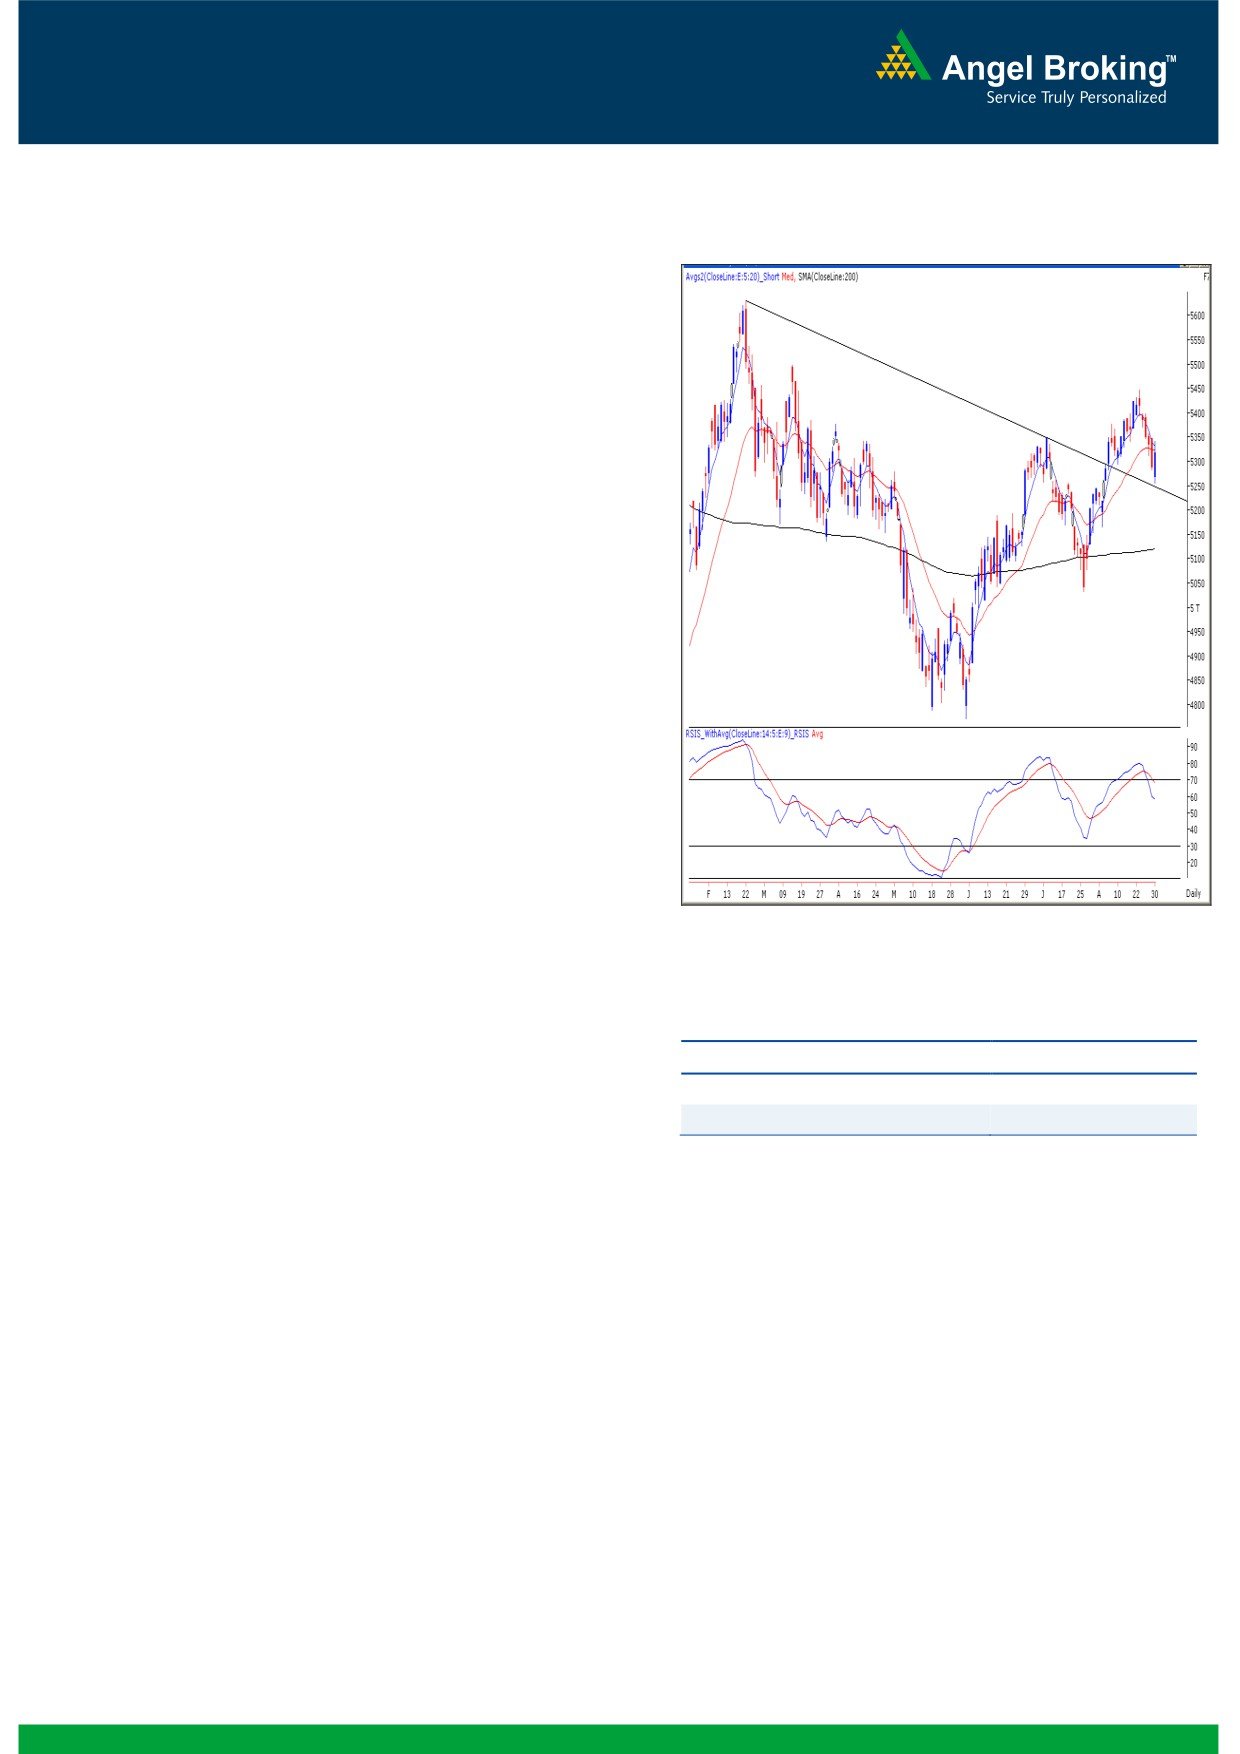
Exhibit 1: Nifty Daily Chart
Sensex (17542) / NIFTY (5315)
Yesterday, markets opened with a marginal downside
gap and Indices then consolidated sideways for the
major part of the day. However, we witnessed
immense volatility during the last hour on account of
the August month Derivative expiry. As a result,
indices bounced back sharply and managed to close
marginally above
5300 mark. During yesterday’s
session, Health Care, IT and Realty stocks closed in
the positive territory; whereas Metal, Oil & Gas and
Auto counters continued to trade with a negative bias.
The advance to decline ratio was marginally in favor
of advancing counters (A=1401 D=1329) (Source -
Formation
On the weekly chart, the indices have closed
above the “Downward Sloping Trend Line”
resistance around
17650/
5370 formed by
joining the highs of 21109 / 6339 (November 5,
2010) - 18524 / 5630 (February 24, 2012).
The ’20-day EMA’ and the ’200-day SMA’ are
placed at 17572 / 5327 and 16900 / 5110
Source: Falcon
levels, respectively.
Actionable points:
Looking at the “Line Chart” it is clear that indices
have now confirmed the ‘Higher Top - Higher
Bottom’ formation on the weekly chart after
View
Neutral
August 28, 2009.
Resistance Levels
5343 - 5371
Support Levels
5255
The weekly chart candle resembles a ‘Shooting
Star’ pattern.
The daily chart candle resembles a "Piercing line"
Going forward, if indices manage to sustain above
candlestick pattern.
yesterday’s high of 17605 / 5343, then indices are
Trading strategy:
likely to bounce towards 17798 - 17820 / 5371 -
5400 levels. On the downside, yesterday’s low of
Finally, after four consecutive bearish sessions, our
17367 / 5255 would act as a key support in coming
markets managed to bounce and close in the positive
trading session. A close below the low would negate
territory. Extreme oversold condition of momentum
the candlestick reversal pattern and result in a further
oscillators and the derivative expiry helped the
fall.
markets to show some strength in the near term. We
are now observing that indices have closed
marginally below ’20-day EMA’. Also the "Piercing
line" candlestick pattern on the daily chart indicates
that the fall may get arrested at least for a couple of
sessions.
1
Daily Technical Report
August 31, 2012
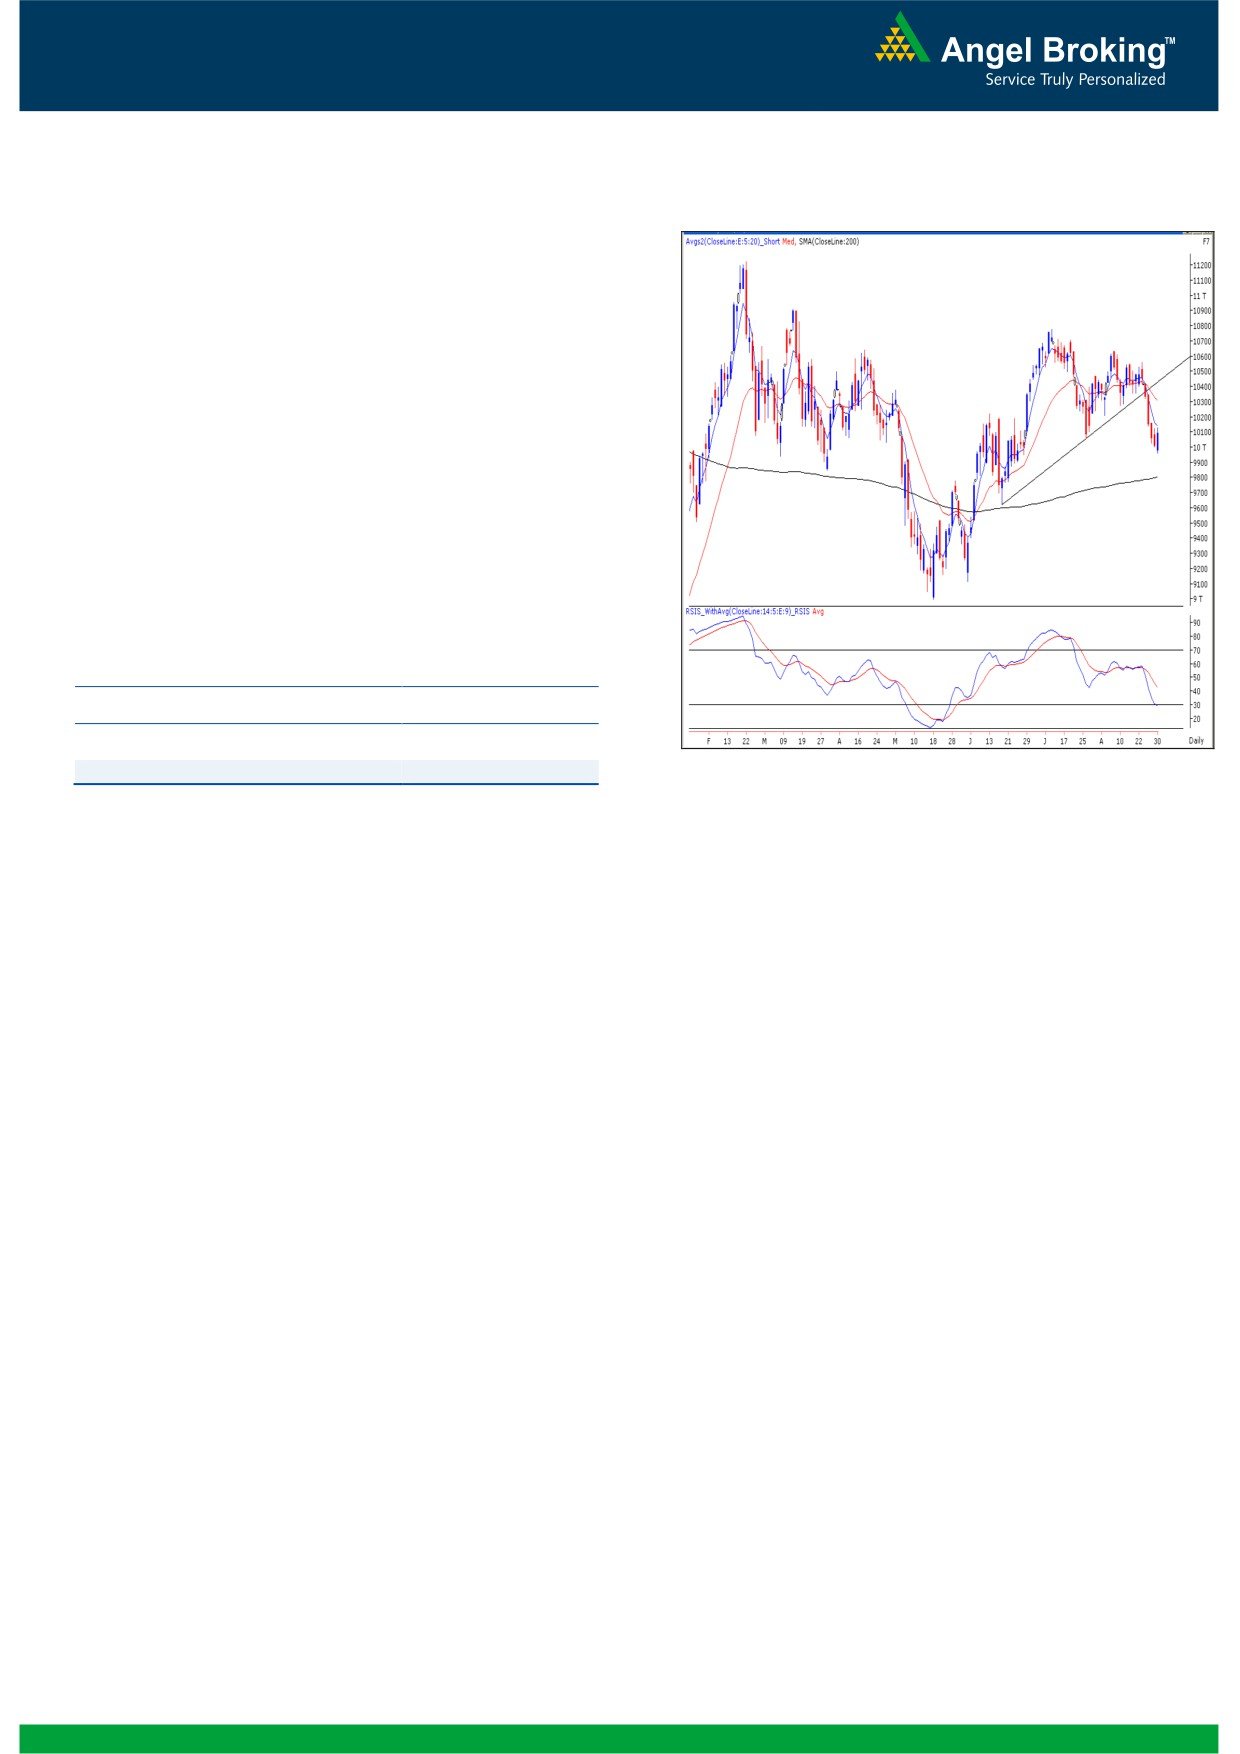
Exhibit 2: Bank Nifty Daily Chart
Bank Nifty Outlook - (10085)
Yesterday, Bank Nifty also opened gap down and
traded in a narrow range almost throughout the day.
In line with our benchmark indices, Bank Nifty
bounced sharply during the last hour of the session.
Going forward, a sustainable move above yesterday’s
high of
10131 may attract some buying interest
among participants. As a result, it may bounce higher
to test next resistance levels of 10230 - 10318 in
coming trading session. Conversely, yesterday’s low
of 9959 would act as a crucial support level for the
coming trading session.
Actionable points:
View
Neutral
Resistance Levels
10131 - 10230 - 10318
Support Levels
9959
Source: Falcon
2
Daily Technical Report
August 31, 2012
Daily Pivot Levels for Nifty 50 Stocks
SCRIPS
S2
S1
PIVOT
R1
R2
SENSEX
17,267
17,404
17,505
17,642
17,743
NIFTY
5,217
5,266
5,304
5,354
5,392
BANKNIFTY
9,887
9,986
10,058
10,158
10,230
ACC
1,302
1,314
1,326
1,339
1,351
AMBUJACEM
181
185
189
193
197
ASIANPAINT
3,561
3,629
3,718
3,785
3,874
AXISBANK
992
1,002
1,015
1,026
1,038
BAJAJ-AUTO
1,589
1,610
1,630
1,651
1,671
BANKBARODA
600
618
629
647
658
BHARTIARTL
236
240
242
245
247
BHEL
209
214
219
224
228
BPCL
339
343
350
355
362
CAIRN
333
338
341
346
350
CIPLA
362
367
371
376
380
COALINDIA
352
357
361
365
370
DLF
184
191
196
203
207
DRREDDY
1,653
1,674
1,688
1,710
1,724
GAIL
348
352
358
363
369
GRASIM
2,908
2,942
2,981
3,015
3,054
HCLTECH
533
540
547
554
561
HDFC
683
705
721
743
759
HDFCBANK
579
587
595
603
611
HEROMOTOCO
1,749
1,786
1,831
1,868
1,912
HINDALCO
100
103
105
108
110
HINDUNILVR
501
515
533
547
565
ICICIBANK
885
902
923
940
960
IDFC
131
135
137
141
144
INFY
2,354
2,373
2,390
2,409
2,426
ITC
263
267
270
274
277
JINDALSTEL
343
348
354
359
365
JPASSOCIAT
59
62
64
68
70
KOTAKBANK
565
579
589
603
614
LT
1,301
1,328
1,351
1,378
1,402
M&M
755
763
773
782
791
MARUTI
1,116
1,130
1,147
1,161
1,178
NTPC
167
169
171
173
175
ONGC
270
273
276
279
282
PNB
650
665
674
689
698
POWERGRID
116
119
121
124
126
RANBAXY
542
546
550
554
558
RELIANCE
758
771
781
794
805
RELINFRA
443
447
451
455
460
SAIL
75
76
78
80
81
SBIN
1,802
1,821
1,834
1,853
1,866
SESAGOA
165
169
172
176
179
SIEMENS
657
671
680
693
703
STER
95
97
98
100
102
SUNPHARMA
664
668
674
678
684
TATAMOTORS
226
231
235
241
245
TATAPOWER
96
98
100
101
103
TATASTEEL
359
362
368
372
377
TCS
1,294
1,331
1,360
1,396
1,425
WIPRO
359
364
367
372
375
3
Daily Technical Report
August 31, 2012
Research Team Tel: 022 - 39357800
DISCLAIMER
This document is solely for the personal information of the recipient, and must not be singularly used as the basis of any investment
decision. Nothing in this document should be construed as investment or financial advice. Each recipient of this document should make
such investigations as they deem necessary to arrive at an independent evaluation of an investment in the securities of the companies
referred to in this document (including the merits and risks involved), and should consult their own advisors to determine the merits and
risks of such an investment.
Angel Broking Limited, its affiliates, directors, its proprietary trading and investment businesses may, from time to time, make
investment decisions that are inconsistent with or contradictory to the recommendations expressed herein. The views contained in this
document are those of the analyst, and the company may or may not subscribe to all the views expressed within.
Reports based on technical and derivative analysis center on studying charts of a stock's price movement, outstanding positions and
trading volume, as opposed to focusing on a company's fundamentals and, as such, may not match with a report on a company's
fundamentals.
The information in this document has been printed on the basis of publicly available information, internal data and other reliable
sources believed to be true, but we do not represent that it is accurate or complete and it should not be relied on as such, as this
document is for general guidance only. Angel Broking Limited or any of its affiliates/ group companies shall not be in any way
responsible for any loss or damage that may arise to any person from any inadvertent error in the information contained in this report.
Angel Broking Limited has not independently verified all the information contained within this document. Accordingly, we cannot testify,
nor make any representation or warranty, express or implied, to the accuracy, contents or data contained within this document. While
Angel Broking Limited endeavours to update on a reasonable basis the information discussed in this material, there may be regulatory,
compliance, or other reasons that prevent us from doing so.
This document is being supplied to you solely for your information, and its contents, information or data may not be reproduced,
redistributed or passed on, directly or indirectly.
Angel Broking Limited and its affiliates may seek to provide or have engaged in providing corporate finance, investment banking or
other advisory services in a merger or specific transaction to the companies referred to in this report, as on the date of this report or in
the past.
Neither Angel Broking Limited, nor its directors, employees or affiliates shall be liable for any loss or damage that may arise from or in
connection with the use of this information.
Note: Please refer to the important `Stock Holding Disclosure' report on the Angel website (Research Section). Also, please refer to the
latest update on respective stocks for the disclosure status in respect of those stocks. Angel Broking Limited and its affiliates may have
investment positions in the stocks recommended in this report.
Research Team
Shardul Kulkarni
-
Head - Technicals
Sameet Chavan
-
Technical Analyst
Sacchitanand Uttekar
-
Technical Analyst
Mehul Kothari
-
Technical Analyst
Ankur Lakhotia
-
Technical Analyst
Angel Broking Pvt. Ltd.
Registered Office: G-1, Ackruti Trade Centre, Rd. No. 7, MIDC, Andheri (E), Mumbai - 400 093.
Corporate Office: 6th Floor, Ackruti Star, MIDC, Andheri (E), Mumbai - 400 093. Tel: (022) 3952 6600
Sebi Registration No: INB 010996539
4