Daily Technical Report
July 31, 2012
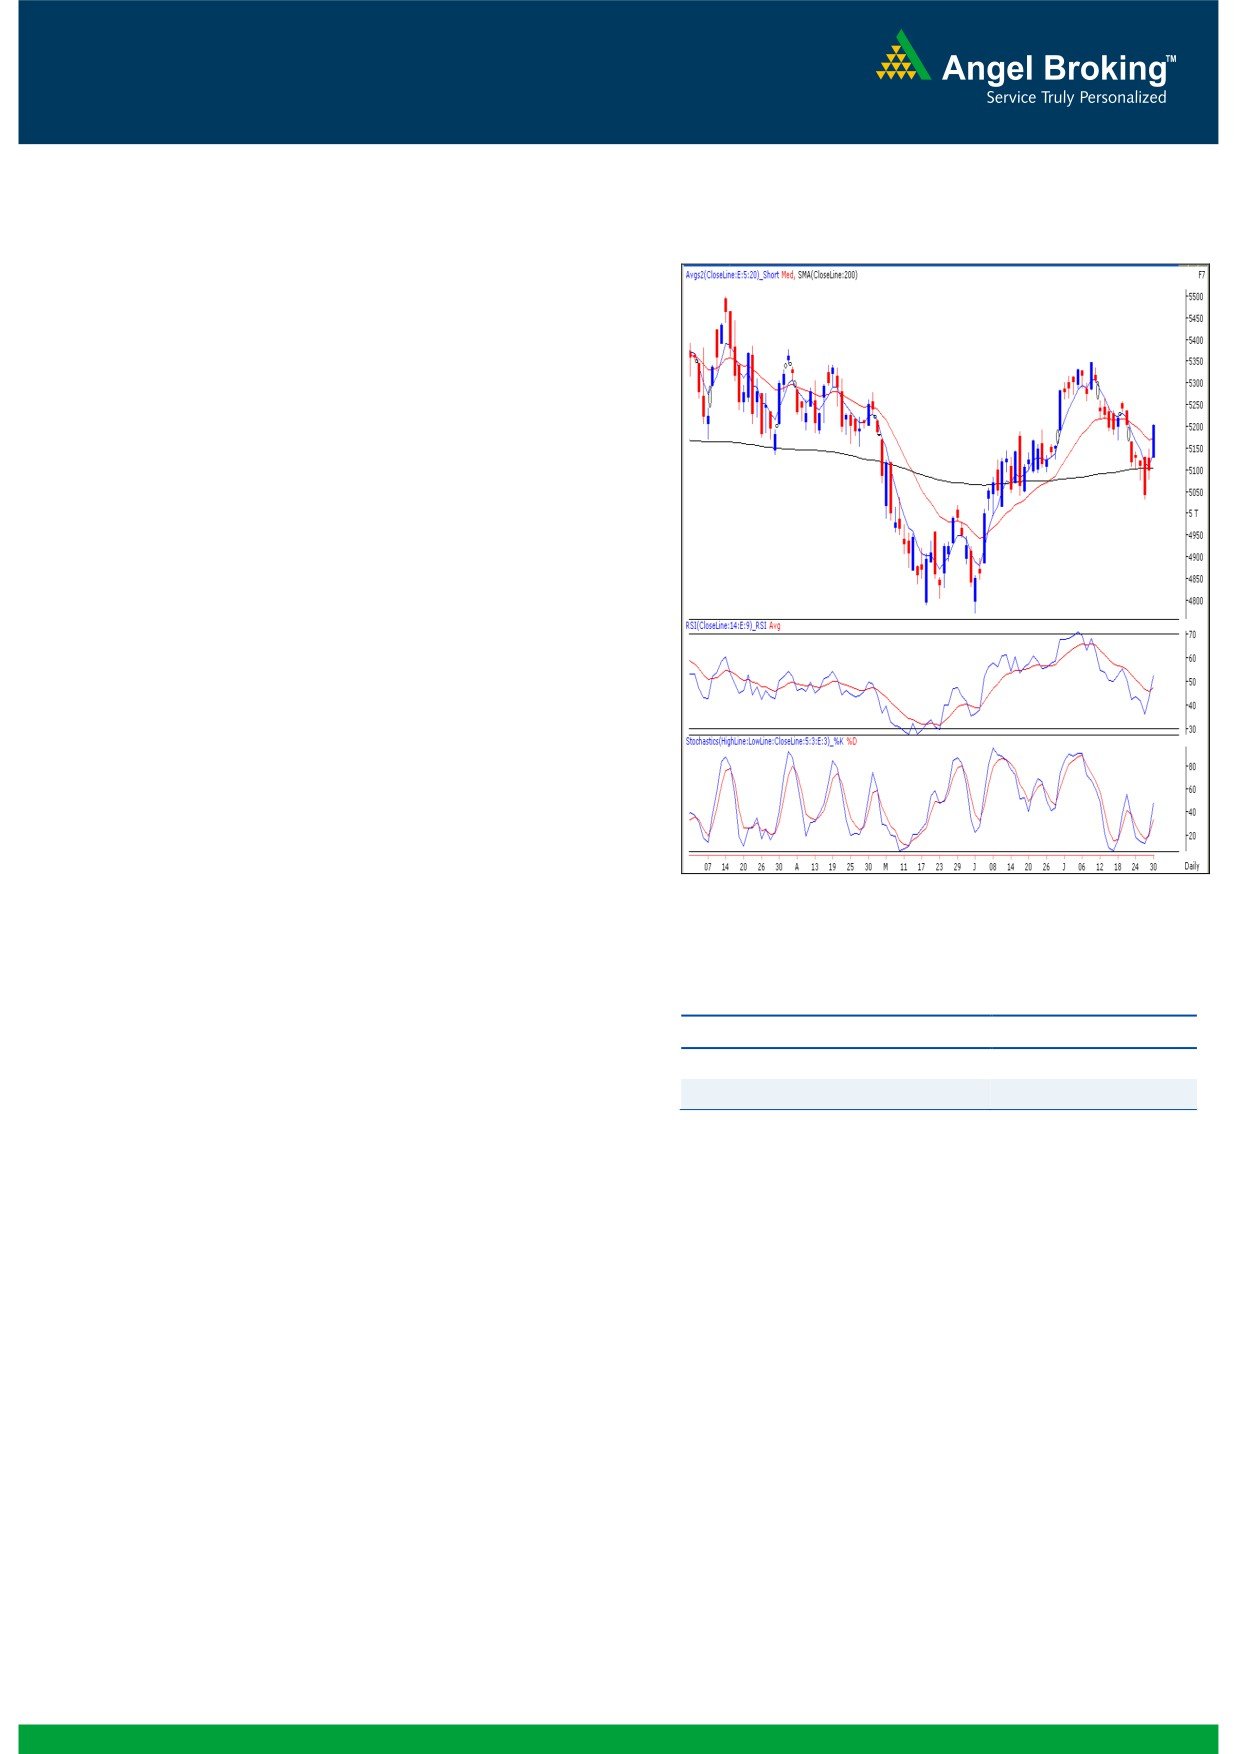
Exhibit 1: Nifty Daily Chart
Sensex (17144) / NIFTY (5200)
This week has begun on a cheerful note on the back
of strong closing of European and US markets on
Friday’s session. After a minor consolidation during
the first half, indices crossed the intraday resistance
zone and surged significantly higher to close precisely
at 5200 mark. All the sectors ended in the positive
territory, out of which, Power, Realty, Capital Goods
and Banking were the major gainers. The advance to
decline ratio was strongly in favor of advancing
counters
(A=1616 D=1143) (Source
-
Formation
The weekly
50% and
61.8% Fibonacci
retracement levels of the rise from 15748 /
4770 (June 08, 2012) to 17631 / 5349 (July 13,
2012) are seen at 16690 / 5059 and 16467 /
4991 levels, respectively.
On the weekly chart, we are witnessing a
“Downward Sloping Trend Line” resistance near
Source: Falcon
17500 / 5325 formed by joining the highs of
21109 / 6339 (November 5, 2010) - 18524 /
5630 (February 24, 2012).
Actionable points:
The ’20-day EMA’ and
’200-day SMA’ are
placed at 17042 / 5169 and 16879 / 5100
View
Bullish Above 5207
levels, respectively.
Expected Targets
5257 - 5300
The daily ‘Stochastic’ and ‘RSI’ oscillators have
Support Level
5129 - 5100
signaled a positive crossover.
The coming trading session is expected to be volatile
Trading strategy:
on account of RBI Monetary policy announcement.
Thus, we advise traders to remain light on positions
Yesterday, indices maintained their positive
and maintain strict stop losses to safeguard their
momentum throughout the session and surged
profits.
significantly higher to close almost at the highest point
of the day. Indices have now tested the mentioned
intraday resistance level of 17130 / 5198. We are
now observing a positive crossover in 'Stochastic' as
well as 'RSI' oscillator. This indicates strength in this up
move and possibility of further upside. Hence, we are
of the opinion that if indices manage to sustain above
yesterday's high of 17164 / 5207, then they are likely
to rally higher to test 17318 - 17466 / 5257 - 5300
levels. On the downside, 16919 - 16879 / 5129 -
5100 levels may provide decent support for the
markets.
1
Daily Technical Report
July 31, 2012
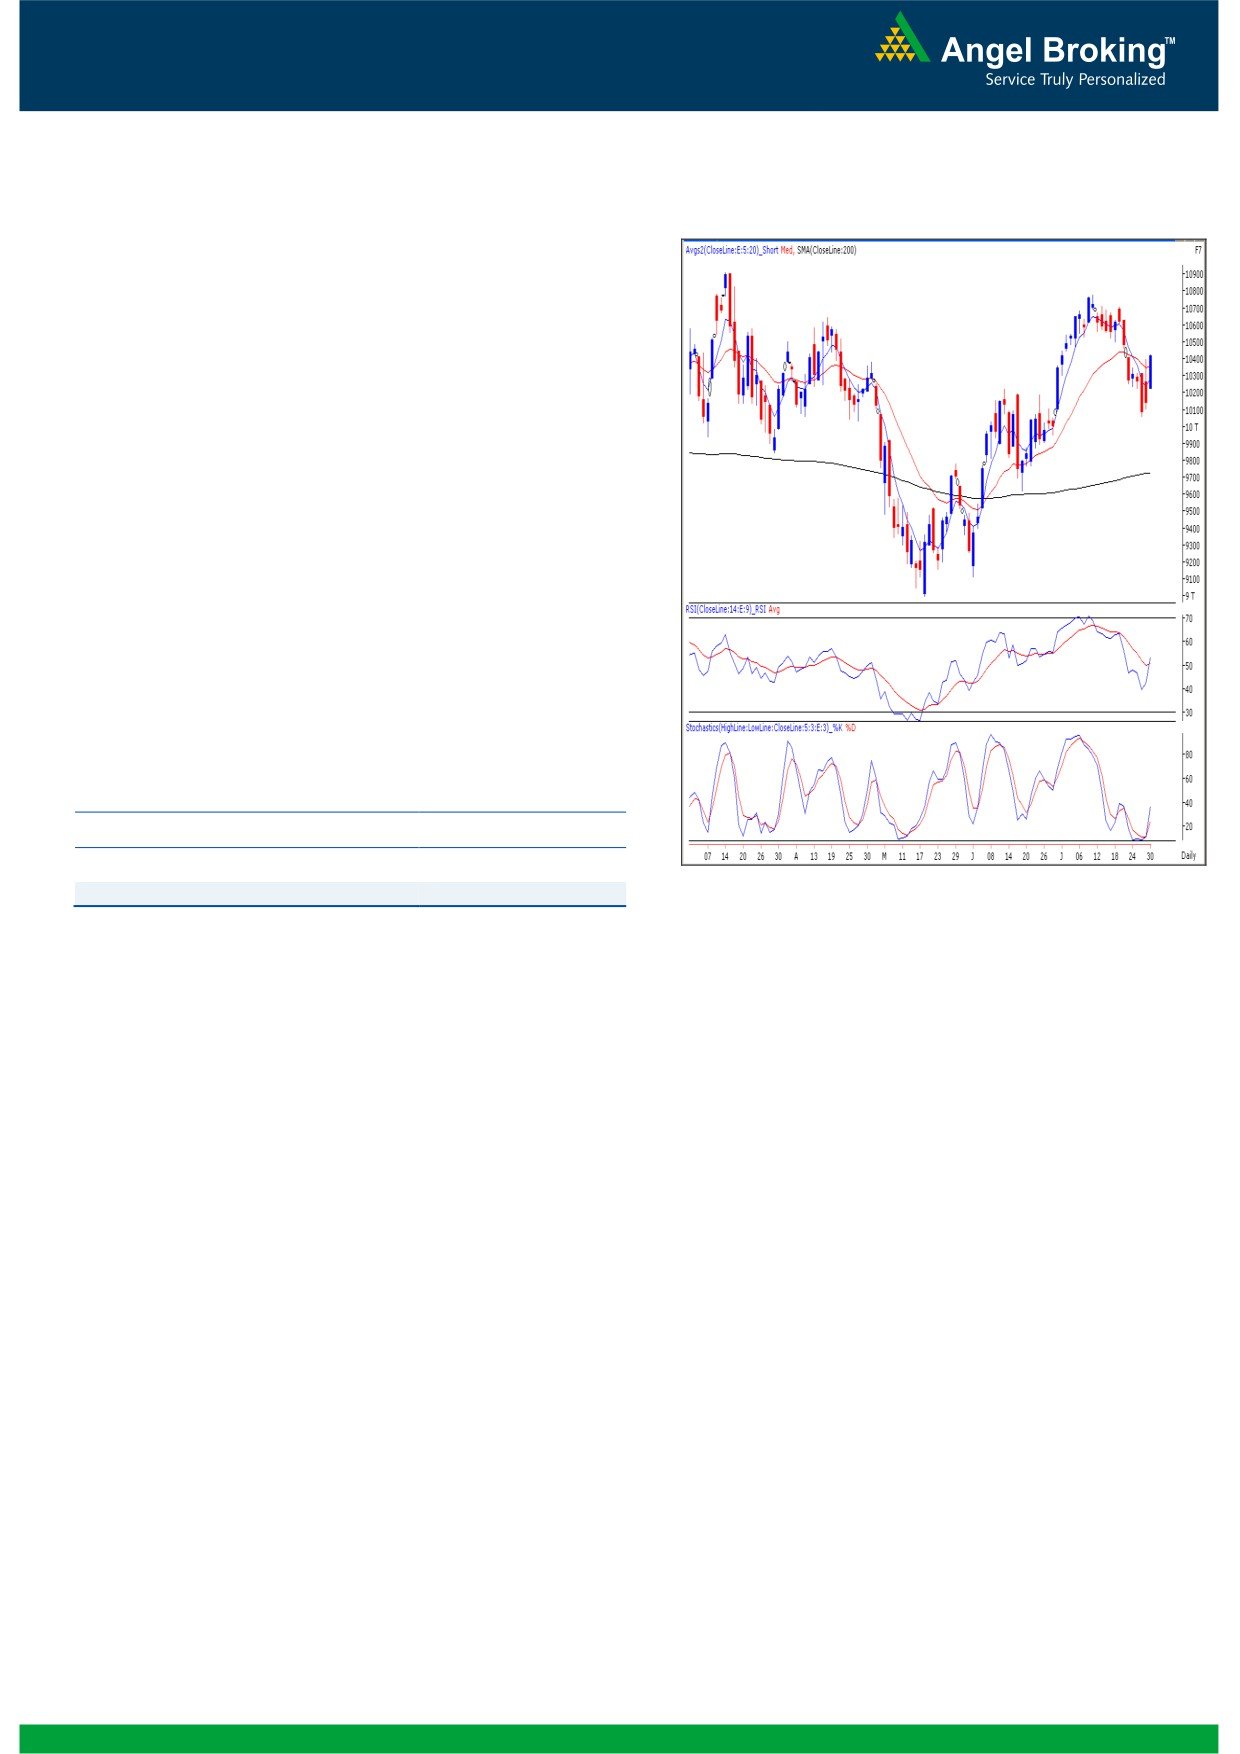
Exhibit 2: Bank Nifty Daily Chart
Bank Nifty Outlook - (10412)
Yesterday Bank Nifty witnessed a sharp rally in line
with the broader market where the index closed with
more than 2.5% gains. The rally was mainly lead by
the banking heavyweights like SBI & ICICI bank.
Market
participants
expect
some positive
announcement from the RBI Monetary policy. The
Bank Nifty has managed to close above the 20 day
EMA placed at 10353 level, and is a sign of strength.
Also, similar to our benchmark Indices, we are
witnessing positive crossover in ‘RSI’ and ‘Stochastic’
momentum oscillators which indicates further upside
once the index moves above yesterday’s high of
10427. In this scenario, index is likely to test 10460 -
10538 levels. On the downside, 10350 - 10223 are
important support levels for the day.
Actionable points:
View
Bullish Above 10427
Expected targets
10460 - 10538
Source: Falcon
Support Level
10350 - 10223
2
Daily Technical Report
July 31, 2012
Daily Pivot Levels for Nifty 50 Stocks
SCRIPS
S2
S1
PIVOT
R1
R2
SENSEX
16,831
16,987
17,076
17,232
17,320
NIFTY
5,102
5,151
5,179
5,228
5,256
BANKNIFTY
10,149
10,281
10,354
10,485
10,558
ACC
1,279
1,288
1,298
1,308
1,318
AMBUJACEM
176
178
180
182
184
ASIANPAINT
3,476
3,526
3,560
3,611
3,645
AXISBANK
991
1,016
1,031
1,056
1,071
BAJAJ-AUTO
1,566
1,585
1,599
1,618
1,631
BANKBARODA
620
646
662
688
704
BHARTIARTL
305
307
310
313
316
BHEL
206
211
214
219
222
BPCL
344
355
363
374
381
CAIRN
314
323
328
337
342
CIPLA
326
330
333
336
339
COALINDIA
349
352
356
359
363
DLF
191
196
200
205
208
DRREDDY
1,596
1,611
1,625
1,639
1,654
GAIL
331
344
351
363
371
GRASIM
2,667
2,718
2,753
2,804
2,839
HCLTECH
511
514
517
520
524
HDFC
671
675
677
681
683
HDFCBANK
580
584
588
591
596
HEROMOTOCO
1,993
2,012
2,025
2,044
2,056
HINDALCO
115
117
118
120
121
HINDUNILVR
458
462
465
469
473
ICICIBANK
932
948
959
975
986
IDFC
126
130
132
136
138
INFY
2,137
2,173
2,194
2,231
2,252
ITC
253
256
257
260
261
JINDALSTEL
389
396
401
409
414
JPASSOCIAT
69
71
73
75
77
KOTAKBANK
519
528
534
542
548
LT
1,312
1,339
1,355
1,382
1,397
M&M
681
694
701
714
722
MARUTI
1,067
1,094
1,109
1,135
1,151
NTPC
152
155
157
160
162
ONGC
271
274
277
280
283
PNB
703
717
724
738
746
POWERGRID
112
115
117
120
121
RANBAXY
481
488
492
500
504
RELIANCE
718
724
728
734
738
RELINFRA
469
485
494
509
518
SAIL
83
84
85
87
88
SBIN
1,905
1,969
2,004
2,068
2,103
SESAGOA
182
185
186
189
191
SIEMENS
646
661
670
684
694
STER
101
102
103
105
106
SUNPHARMA
616
631
640
655
664
TATAMOTORS
213
217
220
225
227
TATAPOWER
93
96
98
100
102
TATASTEEL
399
405
408
414
417
TCS
1,201
1,216
1,229
1,244
1,258
WIPRO
319
326
332
339
345
3
Daily Technical Report
July 31, 2012
Research Team Tel: 022 - 39357800
DISCLAIMER
This document is solely for the personal information of the recipient, and must not be singularly used as the basis of any investment
decision. Nothing in this document should be construed as investment or financial advice. Each recipient of this document should make
such investigations as they deem necessary to arrive at an independent evaluation of an investment in the securities of the companies
referred to in this document (including the merits and risks involved), and should consult their own advisors to determine the merits and
risks of such an investment.
Angel Broking Limited, its affiliates, directors, its proprietary trading and investment businesses may, from time to time, make
investment decisions that are inconsistent with or contradictory to the recommendations expressed herein. The views contained in this
document are those of the analyst, and the company may or may not subscribe to all the views expressed within.
Reports based on technical and derivative analysis center on studying charts of a stock's price movement, outstanding positions and
trading volume, as opposed to focusing on a company's fundamentals and, as such, may not match with a report on a company's
fundamentals.
The information in this document has been printed on the basis of publicly available information, internal data and other reliable
sources believed to be true, but we do not represent that it is accurate or complete and it should not be relied on as such, as this
document is for general guidance only. Angel Broking Limited or any of its affiliates/ group companies shall not be in any way
responsible for any loss or damage that may arise to any person from any inadvertent error in the information contained in this report.
Angel Broking Limited has not independently verified all the information contained within this document. Accordingly, we cannot testify,
nor make any representation or warranty, express or implied, to the accuracy, contents or data contained within this document. While
Angel Broking Limited endeavours to update on a reasonable basis the information discussed in this material, there may be regulatory,
compliance, or other reasons that prevent us from doing so.
This document is being supplied to you solely for your information, and its contents, information or data may not be reproduced,
redistributed or passed on, directly or indirectly.
Angel Broking Limited and its affiliates may seek to provide or have engaged in providing corporate finance, investment banking or
other advisory services in a merger or specific transaction to the companies referred to in this report, as on the date of this report or in
the past.
Neither Angel Broking Limited, nor its directors, employees or affiliates shall be liable for any loss or damage that may arise from or in
connection with the use of this information.
Note: Please refer to the important `Stock Holding Disclosure' report on the Angel website (Research Section). Also, please refer to the
latest update on respective stocks for the disclosure status in respect of those stocks. Angel Broking Limited and its affiliates may have
investment positions in the stocks recommended in this report.
Research Team
Shardul Kulkarni
-
Head - Technicals
Sameet Chavan
-
Technical Analyst
Sacchitanand Uttekar
-
Technical Analyst
Mehul Kothari
-
Technical Analyst
Ankur Lakhotia
-
Technical Analyst
Angel Broking Pvt. Ltd.
Registered Office: G-1, Ackruti Trade Centre, Rd. No. 7, MIDC, Andheri (E), Mumbai - 400 093.
Corporate Office: 6th Floor, Ackruti Star, MIDC, Andheri (E), Mumbai - 400 093. Tel: (022) 3952 6600
Sebi Registration No: INB 010996539
4