Technical Research | January 31, 2012
Daily Technical Report
Sensex (16863) / NIFTY (5087)
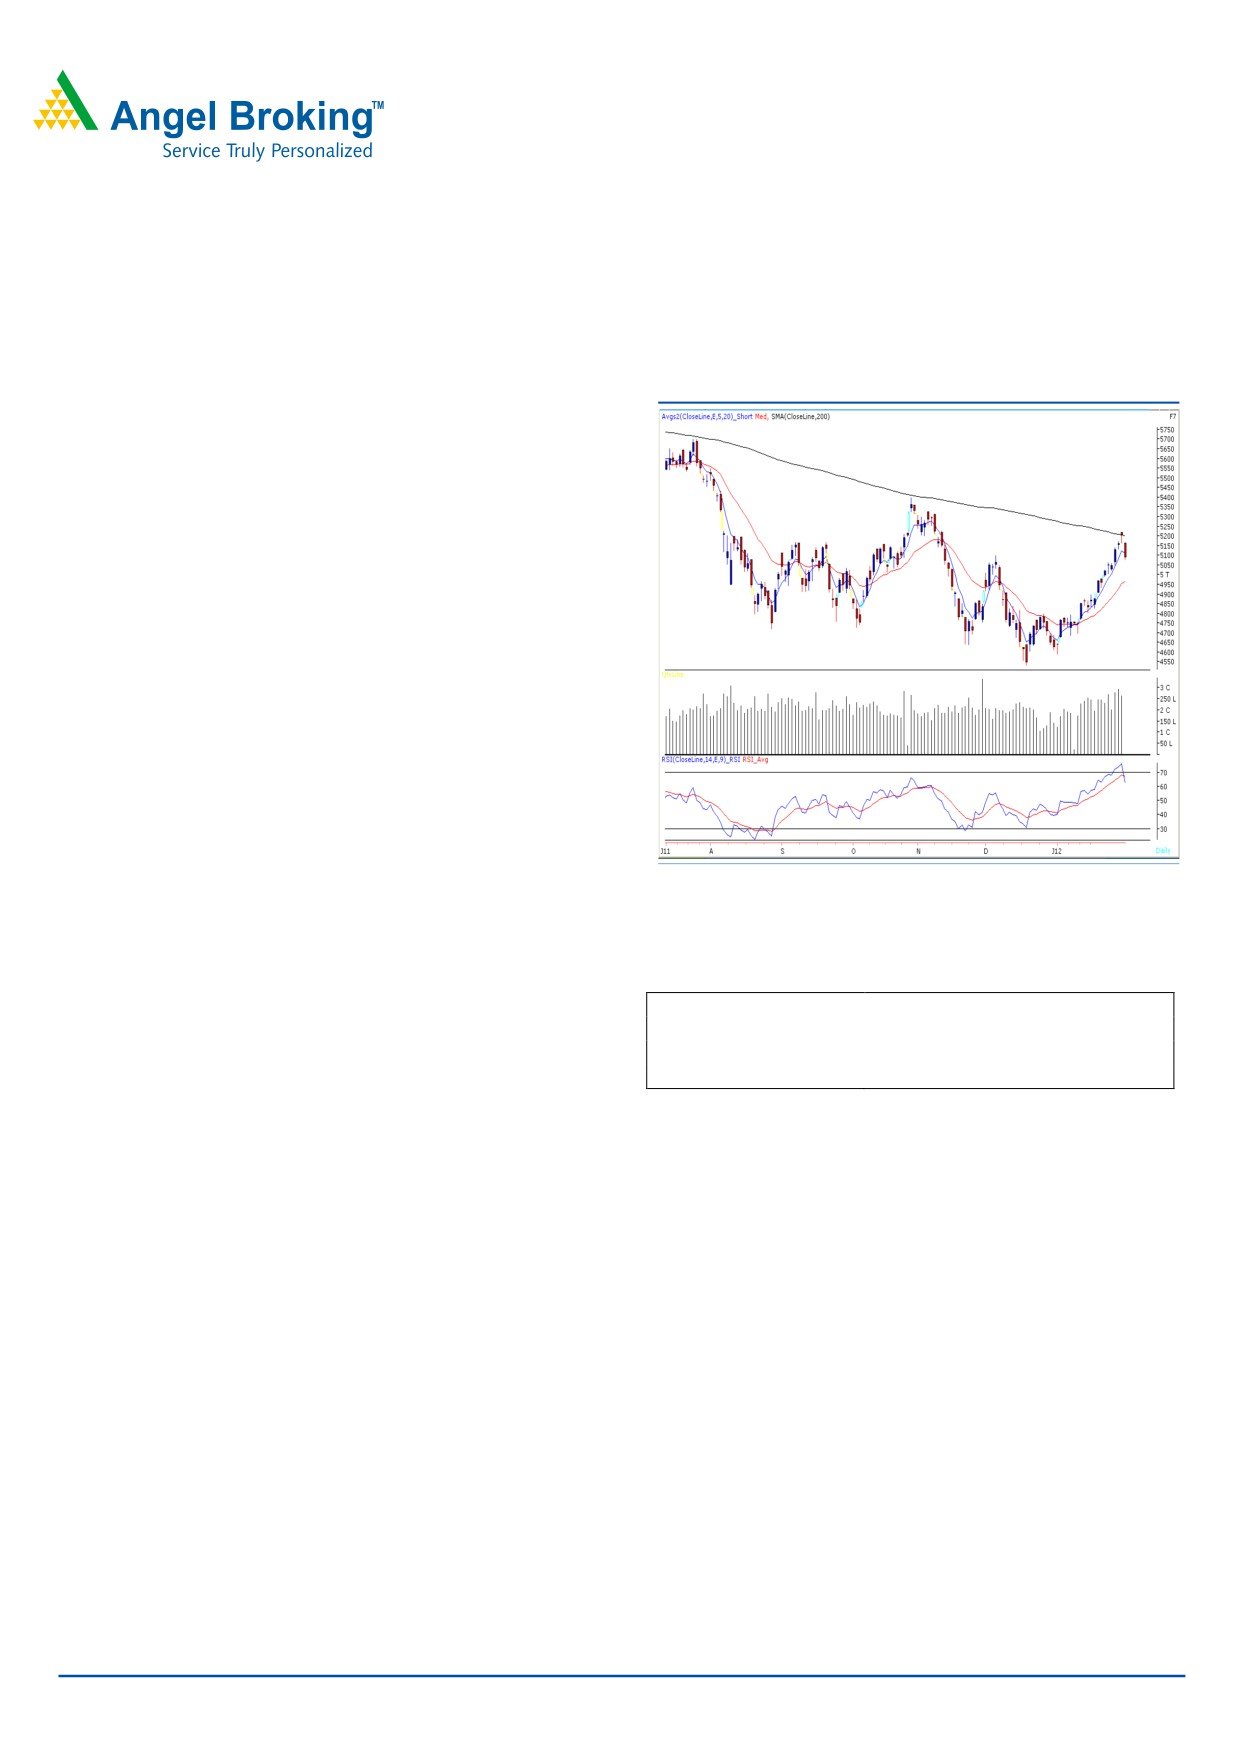
Exhibit 1: Nifty Daily Chart
The week has begun on a pessimistic note and markets
remained under huge selling pressure throughout
yesterday’s session. Indices closed almost at the lowest point
of the day. On the sectoral front, Capital Goods, Power and
Realty counters corrected sharply and there was no sector in
the positive territory. The advance to decline ratio was
strongly in favor of declining counters. (A=996 D=1819)
Formation:
• The 200-day SMA is placed at 17332 / 5202 level.
• The “Hanging Man” formation mentioned in our
previous report is now confirmed.
• We are witnessing a negative crossover in “RSI”
momentum oscillator.
Source: Falcon
• The “20-day EMA” is placed around 16493 / 4964.
Actionable points:
Trading strategy:
View
Bearish
Markets opened with significant downside gap and traded
Sell Only below
5076
Expected target
5055 - 4955
with a strong negative bias after breaking Friday’s low of
Resistance level
5135 - 5166
17106 / 5162. A close below this level has now confirmed
the bearish candlestick pattern called as “Hanging Man”.
The negative impact of this pattern was seen throughout the
day as indices corrected near the mentioned level of 16757
/ 5055. Further, we are witnessing a negative crossover in
daily “RSI” oscillator which indicates possibility of a further
corrective down move if indices sustain below yesterday’s
low of 16828 / 5076. In this case, indices are likely to drift
towards 16757 - 16447 / 5055 - 4955 levels. Conversely,
17015 - 17138 / 5135 - 5166 levels are likely to act as
resistance in coming trading sessions.
For Private Circulation Only |
1
Technical Research | January 31, 2012
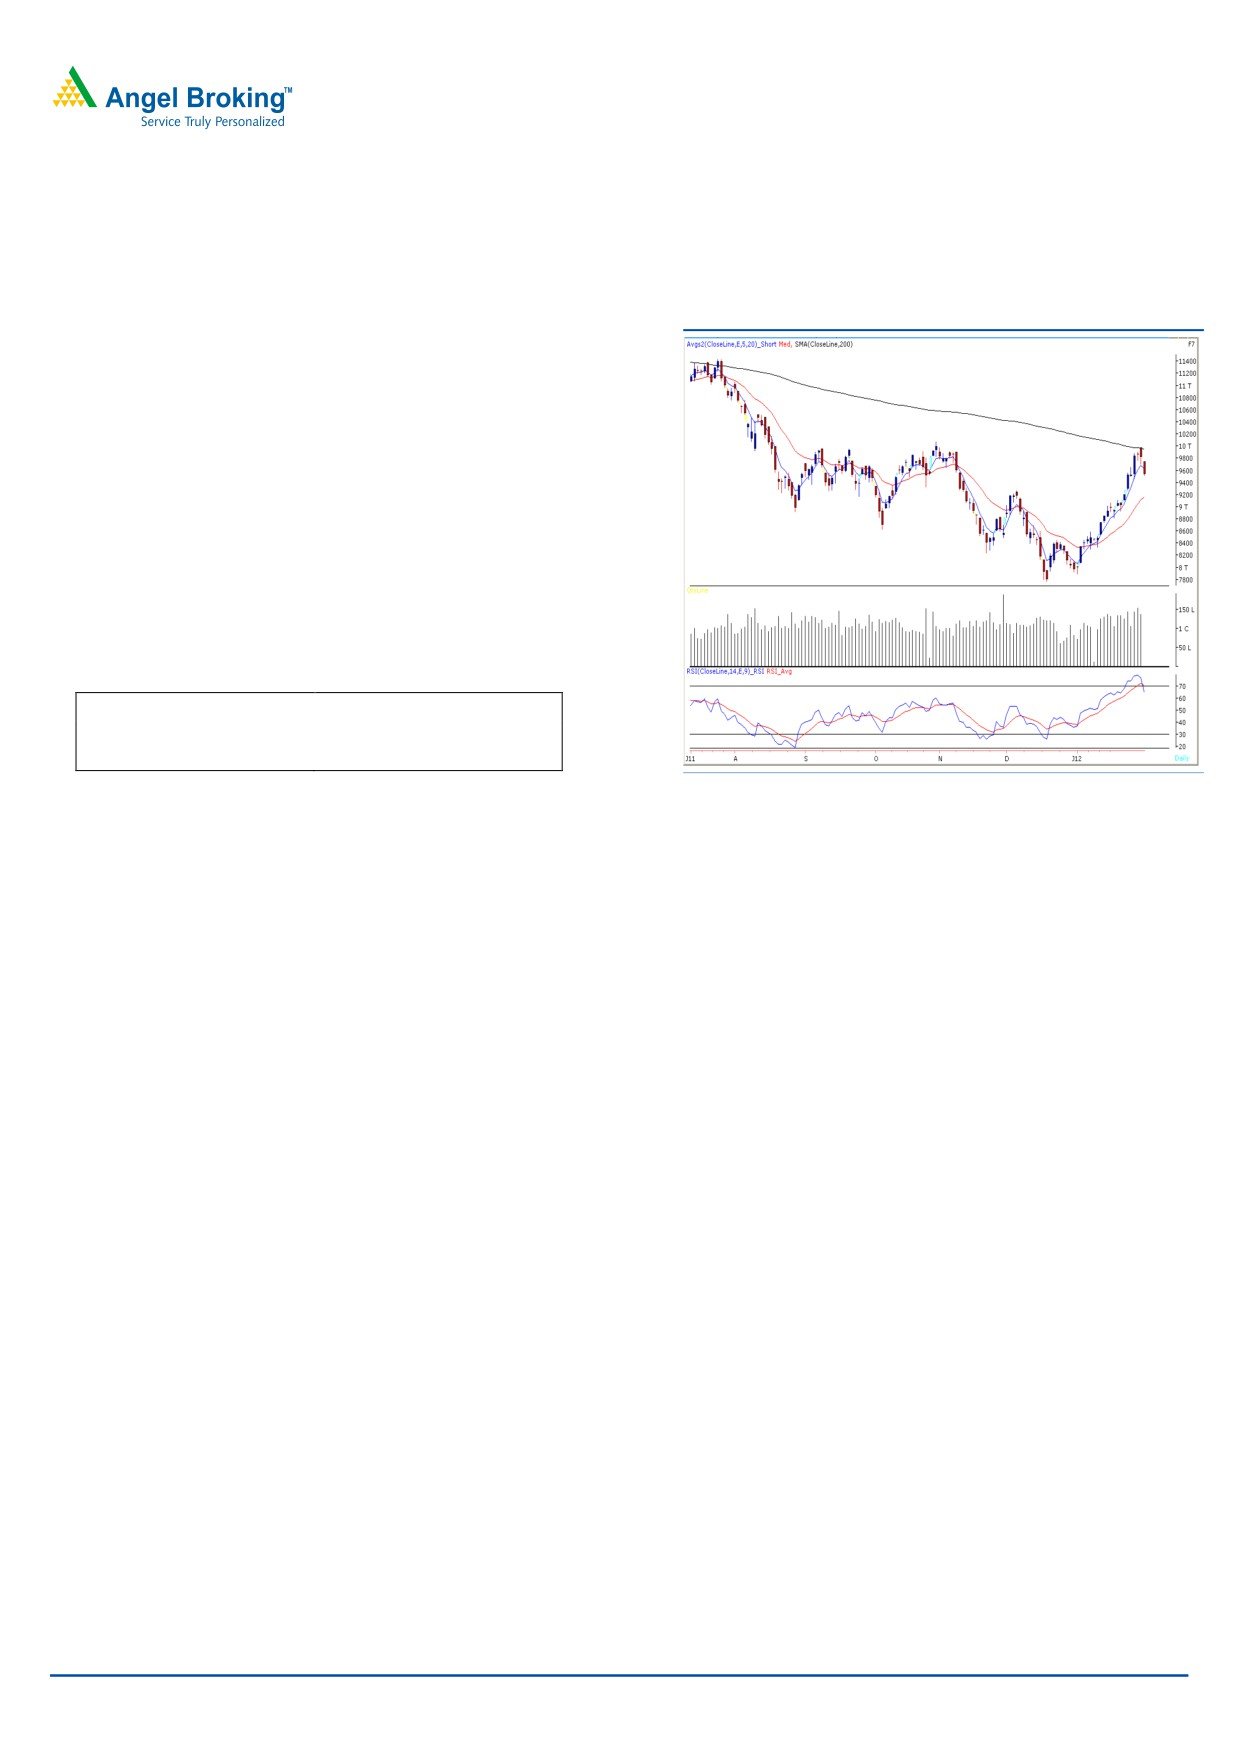
Bank Nifty Outlook - (9537)
Exhibit 2: Bank Nifty Daily Chart
In yesterday’s session, Bank Nifty opened on a pessimistic
note and selling pressure was witnessed throughout the
session. This led the index to test the mentioned support
level of 9530. The negative crossover in momentum
oscillator “RSI and Stochastic” is still intact. Going
forward, selling pressure is likely to increase if the index
sustains below yesterday’s low of
9509. In such a
scenario, the Bank nifty is likely to find support at 9390 -
9300 levels. On the upside 9664 - 9742 levels may act
as resistance in coming trading session.
Actionable points:
View
Negative Below 9509
Expected Target
9390 - 9300
Resistance Levels
9664 - 9742
Source: Falcon
For Private Circulation Only |
2
Technical Report
RESEARCH TEAM
Shardul Kulkarni
Head - Technicals
Sameet Chavan
Technical Analyst
Sacchitanand Uttekar
Technical Analyst
Mehul Kothari
Technical Analyst
Ankur Lakhotia
Technical Analyst
Research Team: 022-3952 6600
DISCLAIMER: This document is not for public distribution and has been furnished to you solely for your information and must not
be reproduced or redistributed to any other person. Persons into whose possession this document may come are required to observe
these restrictions.
Opinion expressed is our current opinion as of the date appearing on this material only. While we endeavor to update on a
reasonable basis the information discussed in this material, there may be regulatory, compliance, or other reasons that prevent us
from doing so. Prospective investors and others are cautioned that any forward-looking statements are not predictions and may be
subject to change without notice. Our proprietary trading and investment businesses may make investment decisions that are
inconsistent with the recommendations expressed herein.
The information in this document has been printed on the basis of publicly available information, internal data and other reliable
sources believed to be true and are for general guidance only. While every effort is made to ensure the accuracy and completeness of
information contained, the company takes no guarantee and assumes no liability for any errors or omissions of the information. No
one can use the information as the basis for any claim, demand or cause of action.
Recipients of this material should rely on their own investigations and take their own professional advice. Each recipient of this
document should make such investigations as it deems necessary to arrive at an independent evaluation of an investment in the
securities of companies referred to in this document (including the merits and risks involved), and should consult their own advisors to
determine the merits and risks of such an investment. Price and value of the investments referred to in this material may go up or
down. Past performance is not a guide for future performance. Certain transactions - futures, options and other derivatives as well as
non-investment grade securities - involve substantial risks and are not suitable for all investors. Reports based on technical analysis
centers on studying charts of a stock's price movement and trading volume, as opposed to focusing on a company's fundamentals
and as such, may not match with a report on a company's fundamentals.
We do not undertake to advise you as to any change of our views expressed in this document. While we would endeavor to update
the information herein on a reasonable basis, Angel Broking, its subsidiaries and associated companies, their directors and
employees are under no obligation to update or keep the information current. Also there may be regulatory, compliance, or other
reasons that may prevent Angel Broking and affiliates from doing so. Prospective investors and others are cautioned that any
forward-looking statements are not predictions and may be subject to change without notice.
Angel Broking Limited and affiliates, including the analyst who has issued this report, may, on the date of this report, and from time
to time, have long or short positions in, and buy or sell the securities of the companies mentioned herein or engage in any other
transaction involving such securities and earn brokerage or compensation or act as advisor or have other potential conflict of interest
with respect to company/ies mentioned herein or inconsistent with any recommendation and related information and opinions.
Angel Broking Limited and affiliates may seek to provide or have engaged in providing corporate finance, investment banking or
other advisory services in a merger or specific transaction to the companies referred to in this report, as on the date of this report or
in the past.
Sebi Registration No : INB 010996539
For Private Circulation Only |