Technical Research | December 30, 2011
Daily Technical Report
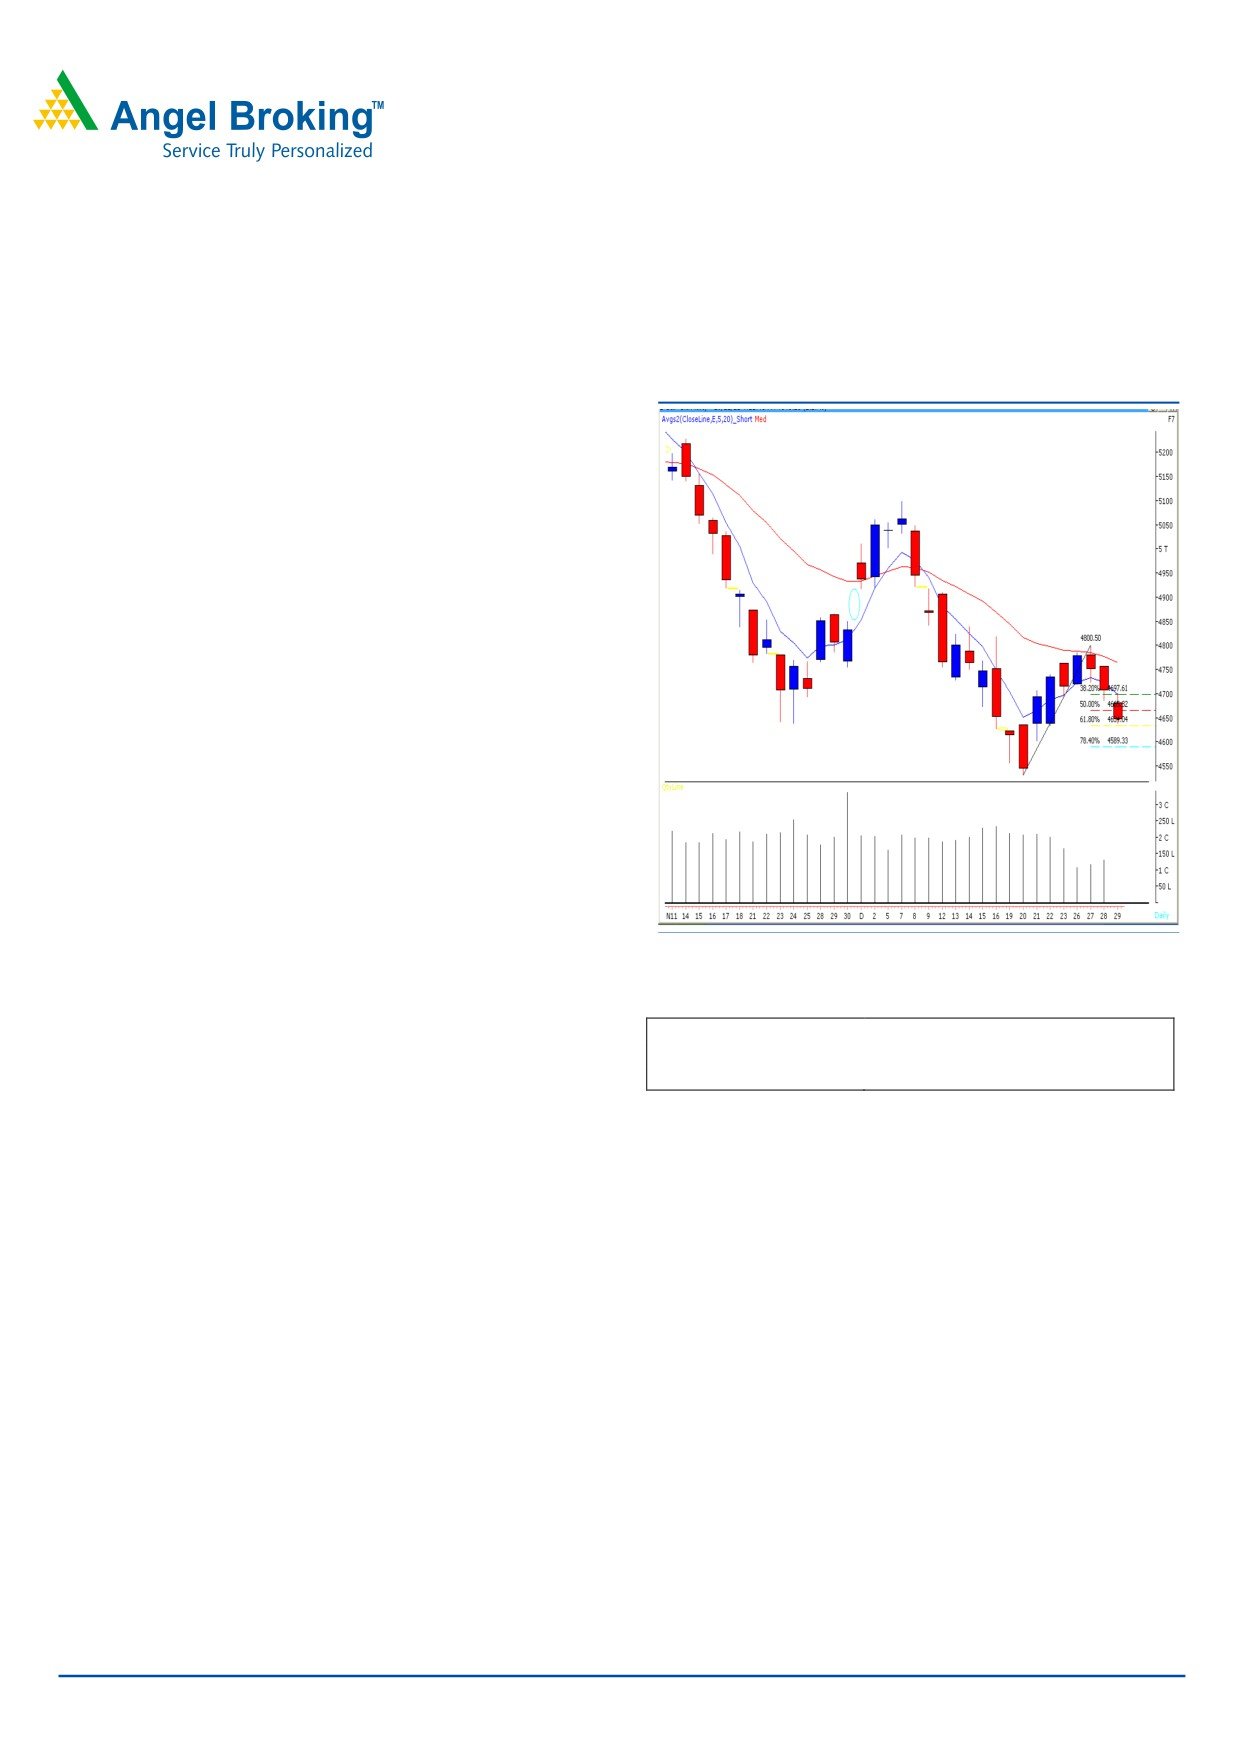
Sensex (15544) / NIFTY (4646)
Exhibit 1: Nifty Daily Chart
Markets opened on a pessimistic note in-line with global
cues, traded with extreme volatility during the first half and
drifted lower during the last hour of the trade to close well
in the negative territory. On the sectoral front, Oil & Gas,
Capital Goods and Realty sectors were among the major
losers, whereas Metal and Health Care counters ended with
a nominal gain. The advance to decline ratio was strongly
in favor of declining counters. (A=1154 D=1525). (Source
Formation
• The 20 EMA on the daily chart is placed at 16020 /
4800 level.
• Markets have closed near 61.8% Fibonacci Retracement
level of the rise from 15135 to 16049 / 4531 to 4801
levels.
Source: Falcon
Actionable points:
Trading strategy:
View
Neutral
Yesterday, markets opened lower and traded with immense
Resistance levels
4702 - 4756
volatility mainly due to the expiry of derivative contracts for
Support levels
4632 - 4590 - 4531
the month of December. A sharp down move towards the
end of the session dragged indices lower to test mentioned
support level of 15472 / 4632. This level nearly coincides
with the 61.8% Fibonacci Retracement level of the rise from
15135 to 16049 / 4531 to 4801 levels. Considering the
optimism in Global markets, it is likely that our markets too
may open on a positive note. On the upside, yesterday’s
high of 15725 / 4702 is likely to act as a resistance in
coming trading session. A sustainable move above this
mark may push indices higher to test 15887 - 16020 /
4756 - 4800 levels. However, if indices manage to sustain
below the above mentioned Fibonacci retracement support
level then they are likely to fall further towards 15333 -
15135 / 4590 - 4531 levels.
For Private Circulation Only |
1
Technical Research | December 30, 2011
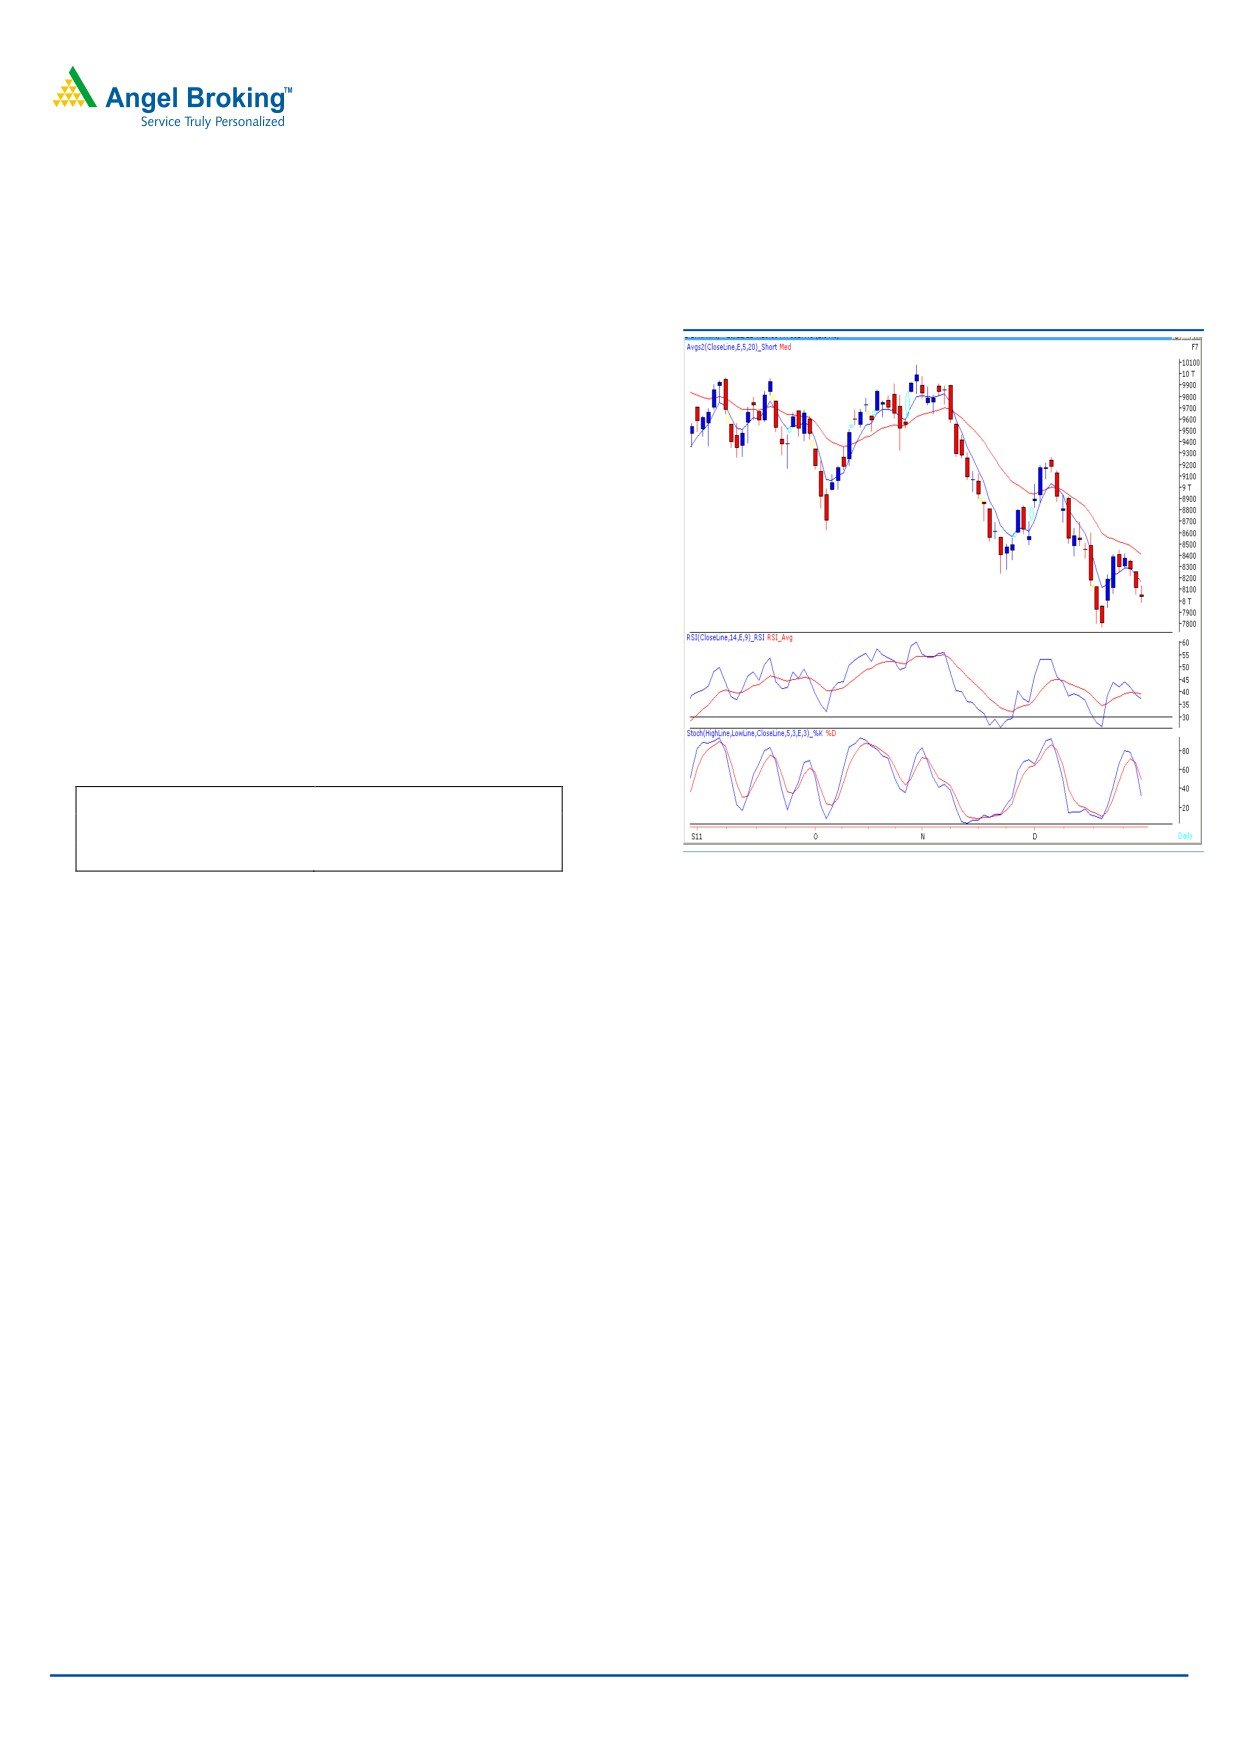
Bank Nifty Outlook - (8027)
Exhibit 2: Bank Nifty Daily Chart
Yesterday, we witnessed a volatile trading session in Bank
Nifty where the index tested both, the mentioned support
(8028) as well as resistance (8150) levels in the initial
hour of trade. However, selling pressure intensified
during the final hour of trade and Bank Nifty made a
fresh low of 7986. On the upside, Bank Nifty is now likely
to face resistance near 8090 - 8150 levels. Once above
these resistance levels, it may shoot up higher to the 8220
mark. On the flip side, the negative crossover in
“Stochastic” and “RSI” momentum oscillator on the daily
chart is still intact. Thus a fall below yesterday’s low of
7986 would increase momentum on the downside and
the index may fall further towards 7936.
Actionable points:
View
Neutral
Resistance Level
8090 - 8150 - 8220
Support Level
7986 - 7936
Source: Falcon
For Private Circulation Only |
2
Technical Research | December 30, 2011
Positive Bias:
Expected
Stock Name
CMP
5 Day EMA
20 Day EMA
Remarks
Target
Polaris
121
118.5
121.6
127
View will change below 117.5
Jsw Steel
524.8
517
539
550
View will change below 503
Negative Bias:
Expected
Stock Name
CMP
5 Day EMA
20 Day EMA
Remarks
Target
Cipla
321.5
324
324.8
310
View will change above 332
India Cem
67
68.7
70.1
62
View will change above 71
For Private Circulation Only |
3
Technical Research | December 30, 2011
Daily Pivot Levels for Nifty 50 Stocks
SCRIPS
S2
S1
PIVOT
R1
R2
SENSEX
15,385
15,465
15,595
15,674
15,804
NIFTY
4,600
4,623
4,662
4,686
4,725
BANKNIFTY
7,900
7,964
8,051
8,114
8,201
ACC
1,134
1,143
1,154
1,163
1,174
AMBUJACEM
153
155
158
161
164
AXISBANK
791
803
820
833
850
BAJAJ-AUTO
1,585
1,594
1,603
1,612
1,621
BHARTIARTL
328
335
343
349
357
BHEL
223
230
239
245
254
BPCL
459
469
485
495
511
CAIRN
293
299
307
312
320
CIPLA
317
319
322
324
327
DLF
180
183
189
192
197
DRREDDY
1,550
1,560
1,571
1,581
1,593
GAIL
366
374
385
393
404
HCLTECH
373
380
390
397
407
HDFC
649
653
658
662
668
HDFCBANK
417
423
433
439
449
HEROMOTOCO
1,879
1,892
1,906
1,918
1,932
HINDALCO
113
115
117
119
121
HINDUNILVR
403
409
413
418
422
ICICIBANK
664
675
688
699
712
IDFC
92
94
95
96
98
INFY
2,706
2,724
2,749
2,768
2,793
ITC
198
199
201
203
205
JINDALSTEL
425
444
455
474
485
JPASSOCIAT
52
53
54
54
55
KOTAKBANK
434
440
448
454
461
LT
973
986
1,007
1,020
1,041
M&M
667
677
687
696
706
MARUTI
888
905
932
949
976
NTPC
157
159
160
162
163
ONGC
252
255
259
262
266
PNB
739
760
774
795
809
POWERGRID
99
99
100
101
101
RANBAXY
391
398
403
410
415
RCOM
65
66
69
71
73
RELCAPITAL
231
234
240
244
249
RELIANCE
688
700
719
732
751
RELINFRA
331
337
349
356
367
RPOWER
70
71
72
73
74
SAIL
77
79
80
82
83
SBIN
1,572
1,600
1,619
1,647
1,666
SESAGOA
155
157
160
163
165
SIEMENS
619
629
642
652
666
STER
87
89
90
92
94
SUNPHARMA
488
492
497
501
505
SUZLON
17
17
18
19
20
TATAMOTORS
176
177
180
182
184
TATAPOWER
85
87
90
91
94
TATASTEEL
336
339
344
347
352
TCS
1,149
1,157
1,168
1,176
1,186
WIPRO
392
395
398
401
404
Technical Research Team
For Private Circulation Only |
4
Technical Report
RESEARCH TEAM
Shardul Kulkarni
Head - Technicals
Sameet Chavan
Technical Analyst
Sacchitanand Uttekar
Technical Analyst
Mehul Kothari
Technical Analyst
Ankur Lakhotia
Technical Analyst
Research Team: 022-3952 6600
DISCLAIMER: This document is not for public distribution and has been furnished to you solely for your information and must not
be reproduced or redistributed to any other person. Persons into whose possession this document may come are required to observe
these restrictions.
Opinion expressed is our current opinion as of the date appearing on this material only. While we endeavor to update on a
reasonable basis the information discussed in this material, there may be regulatory, compliance, or other reasons that prevent us
from doing so. Prospective investors and others are cautioned that any forward-looking statements are not predictions and may be
subject to change without notice. Our proprietary trading and investment businesses may make investment decisions that are
inconsistent with the recommendations expressed herein.
The information in this document has been printed on the basis of publicly available information, internal data and other reliable
sources believed to be true and are for general guidance only. While every effort is made to ensure the accuracy and completeness of
information contained, the company takes no guarantee and assumes no liability for any errors or omissions of the information. No
one can use the information as the basis for any claim, demand or cause of action.
Recipients of this material should rely on their own investigations and take their own professional advice. Each recipient of this
document should make such investigations as it deems necessary to arrive at an independent evaluation of an investment in the
securities of companies referred to in this document (including the merits and risks involved), and should consult their own advisors to
determine the merits and risks of such an investment. Price and value of the investments referred to in this material may go up or
down. Past performance is not a guide for future performance. Certain transactions - futures, options and other derivatives as well as
non-investment grade securities - involve substantial risks and are not suitable for all investors. Reports based on technical analysis
centers on studying charts of a stock's price movement and trading volume, as opposed to focusing on a company's fundamentals
and as such, may not match with a report on a company's fundamentals.
We do not undertake to advise you as to any change of our views expressed in this document. While we would endeavor to update
the information herein on a reasonable basis, Angel Broking, its subsidiaries and associated companies, their directors and
employees are under no obligation to update or keep the information current. Also there may be regulatory, compliance, or other
reasons that may prevent Angel Broking and affiliates from doing so. Prospective investors and others are cautioned that any
forward-looking statements are not predictions and may be subject to change without notice.
Angel Broking Limited and affiliates, including the analyst who has issued this report, may, on the date of this report, and from time
to time, have long or short positions in, and buy or sell the securities of the companies mentioned herein or engage in any other
transaction involving such securities and earn brokerage or compensation or act as advisor or have other potential conflict of interest
with respect to company/ies mentioned herein or inconsistent with any recommendation and related information and opinions.
Angel Broking Limited and affiliates may seek to provide or have engaged in providing corporate finance, investment banking or
other advisory services in a merger or specific transaction to the companies referred to in this report, as on the date of this report or
in the past.
Sebi Registration No : INB 010996539
For Private Circulation Only |