Technical Research | November 30, 2011
Daily Technical Report
Sensex (16008) / NIFTY (4805)
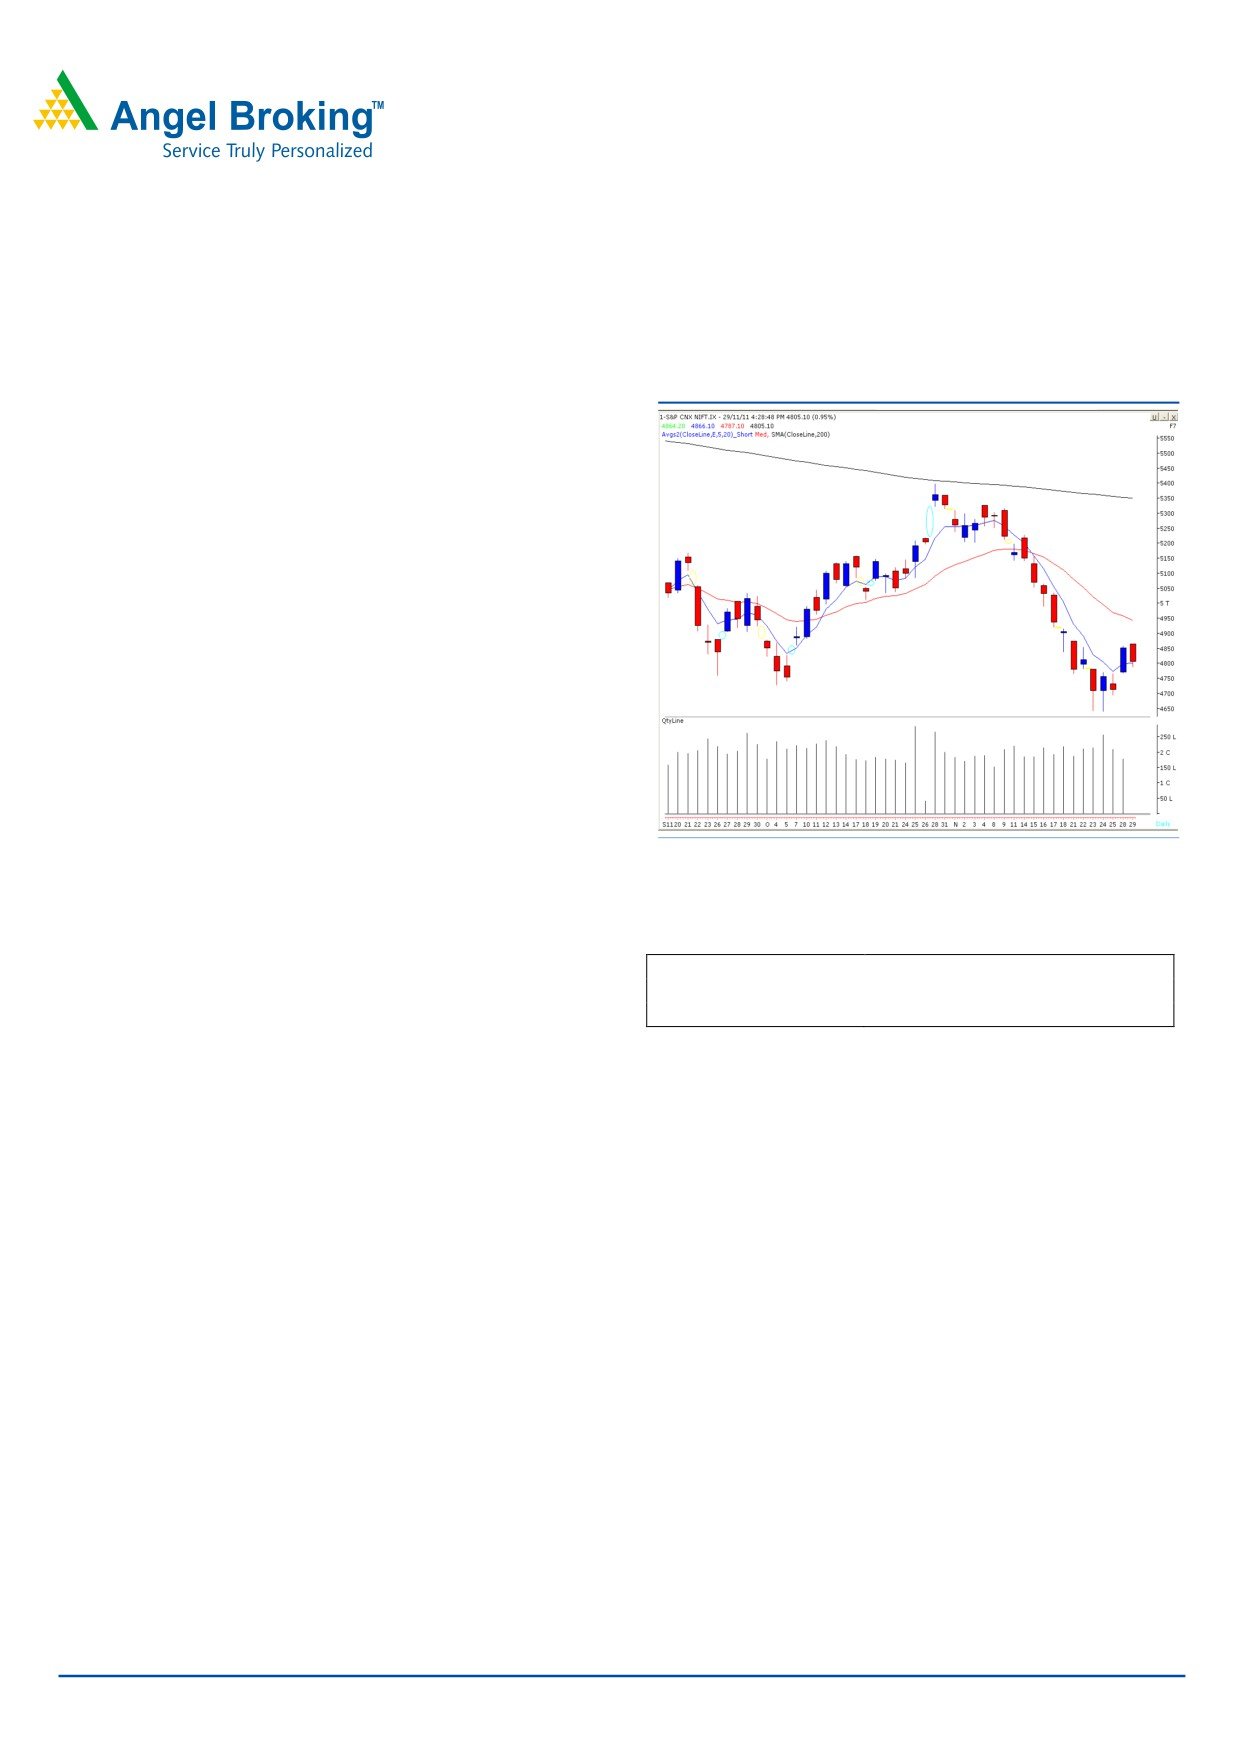
Exhibit 1: Nifty Daily Chart
Yesterday, our indices opened marginally above Monday’s
high of 16187 / 4859, but failed to sustain at higher levels
and selling pressure lead indices to close just above 4800
mark. On the sectoral front, Realty, Oil & Gas and Banking
counters were among the major losers whereas FMCG
ended with marginal gains. The advance decline ratio was
in favour of declining counters (A=1226 D=1515). (Source
Formation
• The Daily chart depicts a Japanese Candle Stick pattern
known as “Dark Cloud Cover”.
• The “20 Days EMA” is placed at 16463 / 4943.
Source: Falcon
Actionable points:
Trading strategy:
Indices opened marginally above the previous resistance
View
Neutral
level of 16187 / 4859 and selling pressure dragged the
Resistance levels
4844 - 4866
indices to test 38.2% Fibonacci retracement level of the
Support level
4787 - 4693
current rally from 15479 - 16210 / 4639 - 4866. On the
Daily chart, we are witnessing a Japanese Candle Stick
pattern which resembles “Dark Cloud Cover”. This pattern
needs conformation in the form of a close below 15953 /
4787. Going forward, if indices trades convincingly below
yesterday’s low of 15953 / 4787, then markets may test
15888 - 15645 / 4766 - 4693 levels. On the upside
16135 - 16210 / 4844 - 4866 levels may act as resistance
for the day. The said reversal pattern will be negated only if
indices close above yesterday’s high of 16210 / 4866.
For Private Circulation Only |
1
Technical Research | November 30, 2011
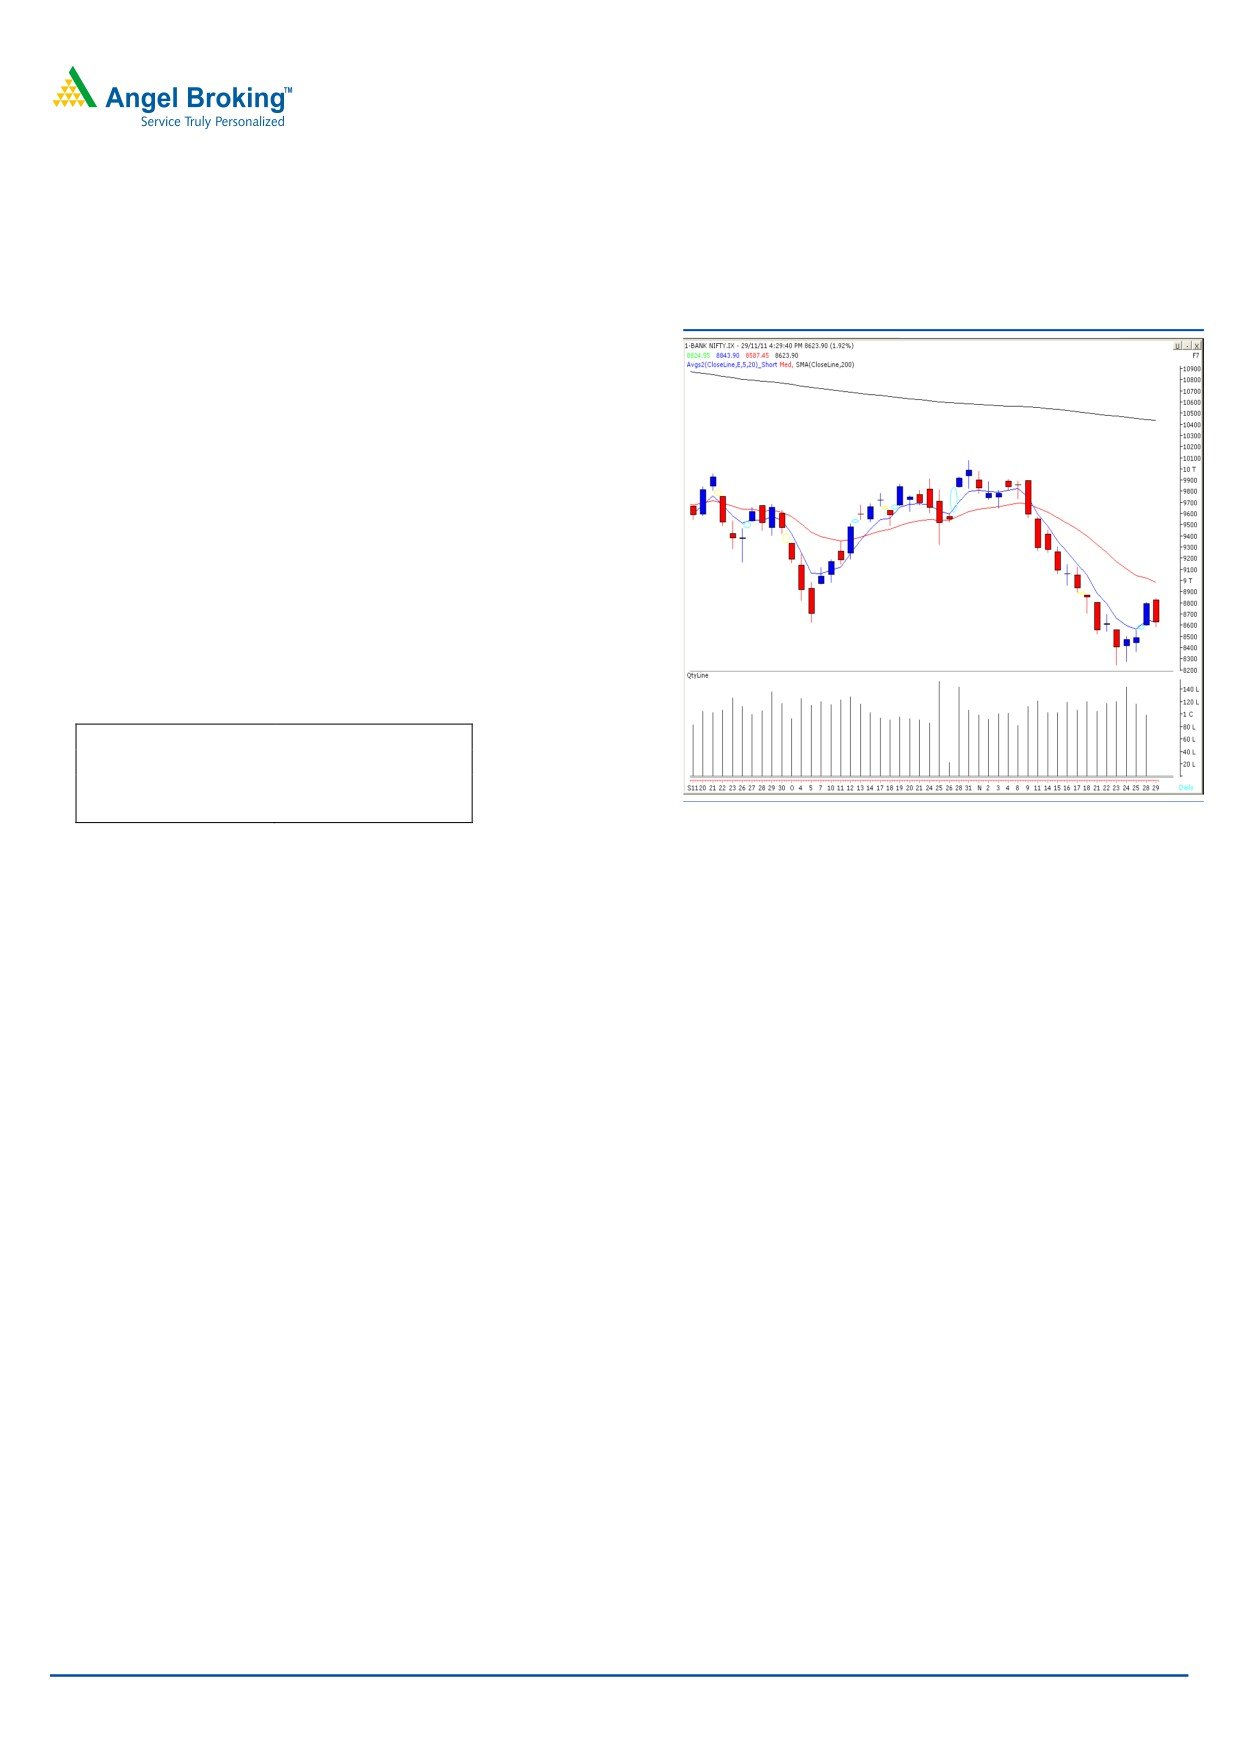
Bank Nifty Outlook - (8624)
Exhibit 2: Bank Nifty Daily Chart
Bank nifty opened on a flat note and traded in a narrow
range during first half of the session. However, during the
second half, selling pressure dominated near the
mentioned resistance level of 8880 which led the index to
close in the negative territory. We are now observing a
negative cross over in momentum oscillator “RSI-
Smoothened” on the hourly chart, which indicates
bearishness. Therefore, if Bank Nifty sustains below
yesterday’s low of 8587, then it is likely to test 8470 -
8369 levels. On the Upside, 8685 - 8745 levels may act
as resistance levels for the day.
Actionable points:
View
Bearish
Negative below
8587
Expected target
8470 - 8369
Resistance levels
8685 - 8745
Source: Falcon
For Private Circulation Only |
2
Technical Research | November 30, 2011
Positive Bias:
Stock Name
5 Day EMA
20 Day EMA
Expected Target
Remarks
M & M
718.5
756.7
745
View will change below 708
PTC
47.8
55.7
54
View will change below 46.5
Negative Bias:
Stock Name
5 Day EMA
20 Day EMA
Expected Target
Remarks
Educomp
200.85
214.3
189
View will change above 219
Ambuja Cement
149.2
152.7
140
View will change above 153
For Private Circulation Only |
3
Technical Research | November 30, 2011
Daily Pivot Levels for Nifty 50 Stocks
SCRIPS
S2
S1
PIVOT
R1
R2
SENSEX
15,799
15,904
16,057
16,162
16,315
NIFTY
4,740
4,773
4,819
4,852
4,898
BANKNIFTY
8,429
8,526
8,685
8,783
8,942
ACC
1,123
1,142
1,167
1,186
1,211
AMBUJACEM
141
144
148
151
155
AXISBANK
944
960
981
997
1,017
BAJAJ-AUTO
1,585
1,617
1,637
1,669
1,688
BHARTIARTL
354
364
378
388
402
BHEL
274
278
283
288
293
BPCL
516
522
531
537
546
CAIRN
293
298
303
308
312
CIPLA
323
325
327
329
332
DLF
195
199
205
209
215
DRREDDY
1,532
1,563
1,584
1,615
1,635
GAIL
381
385
389
394
398
HCLTECH
380
386
390
395
400
HDFC
622
629
639
645
655
HDFCBANK
424
430
438
443
451
HEROMOTOCO
1,955
2,008
2,044
2,096
2,132
HINDALCO
119
121
123
124
126
HINDUNILVR
379
384
387
391
395
ICICIBANK
704
719
738
752
771
IDFC
106
108
112
114
118
INFY
2,556
2,577
2,602
2,624
2,649
ITC
194
196
197
199
200
JINDALSTEL
466
479
497
509
527
JPASSOCIAT
61
62
64
65
67
KOTAKBANK
439
447
460
468
481
LT
1,244
1,260
1,275
1,292
1,306
M&M
700
713
721
734
743
MARUTI
936
947
964
976
992
NTPC
156
157
159
160
162
ONGC
252
255
259
263
267
PNB
855
873
900
918
944
POWERGRID
93
94
96
97
99
RANBAXY
440
446
455
461
470
RCOM
70
71
73
74
75
RELCAPITAL
275
281
288
294
302
RELIANCE
746
755
769
778
792
RELINFRA
400
405
410
415
420
RPOWER
84
85
87
88
90
SAIL
80
82
84
86
88
SBIN
1,719
1,740
1,768
1,790
1,818
SESAGOA
174
177
180
184
187
SIEMENS
679
688
700
709
721
STER
99
101
103
105
107
SUNPHARMA
500
505
511
516
522
SUZLON
22
23
24
24
25
TATAMOTORS
172
175
178
181
184
TATAPOWER
90
91
93
94
96
TATASTEEL
376
382
390
395
404
TCS
1,075
1,084
1,095
1,104
1,115
WIPRO
368
371
373
376
379
Technical Research Team
For Private Circulation Only |
4
Technical Report
RESEARCH TEAM
Shardul Kulkarni
Head - Technicals
Sameet Chavan
Technical Analyst
Sacchitanand Uttekar
Technical Analyst
Mehul Kothari
Technical Analyst
Ankur Lakhotia
Technical Analyst
Research Team: 022-3952 6600
DISCLAIMER: This document is not for public distribution and has been furnished to you solely for your information and must not
be reproduced or redistributed to any other person. Persons into whose possession this document may come are required to observe
these restrictions.
Opinion expressed is our current opinion as of the date appearing on this material only. While we endeavor to update on a
reasonable basis the information discussed in this material, there may be regulatory, compliance, or other reasons that prevent us
from doing so. Prospective investors and others are cautioned that any forward-looking statements are not predictions and may be
subject to change without notice. Our proprietary trading and investment businesses may make investment decisions that are
inconsistent with the recommendations expressed herein.
The information in this document has been printed on the basis of publicly available information, internal data and other reliable
sources believed to be true and are for general guidance only. While every effort is made to ensure the accuracy and completeness of
information contained, the company takes no guarantee and assumes no liability for any errors or omissions of the information. No
one can use the information as the basis for any claim, demand or cause of action.
Recipients of this material should rely on their own investigations and take their own professional advice. Each recipient of this
document should make such investigations as it deems necessary to arrive at an independent evaluation of an investment in the
securities of companies referred to in this document (including the merits and risks involved), and should consult their own advisors to
determine the merits and risks of such an investment. Price and value of the investments referred to in this material may go up or
down. Past performance is not a guide for future performance. Certain transactions - futures, options and other derivatives as well as
non-investment grade securities - involve substantial risks and are not suitable for all investors. Reports based on technical analysis
centers on studying charts of a stock's price movement and trading volume, as opposed to focusing on a company's fundamentals
and as such, may not match with a report on a company's fundamentals.
We do not undertake to advise you as to any change of our views expressed in this document. While we would endeavor to update
the information herein on a reasonable basis, Angel Broking, its subsidiaries and associated companies, their directors and
employees are under no obligation to update or keep the information current. Also there may be regulatory, compliance, or other
reasons that may prevent Angel Broking and affiliates from doing so. Prospective investors and others are cautioned that any
forward-looking statements are not predictions and may be subject to change without notice.
Angel Broking Limited and affiliates, including the analyst who has issued this report, may, on the date of this report, and from time
to time, have long or short positions in, and buy or sell the securities of the companies mentioned herein or engage in any other
transaction involving such securities and earn brokerage or compensation or act as advisor or have other potential conflict of interest
with respect to company/ies mentioned herein or inconsistent with any recommendation and related information and opinions.
Angel Broking Limited and affiliates may seek to provide or have engaged in providing corporate finance, investment banking or
other advisory services in a merger or specific transaction to the companies referred to in this report, as on the date of this report or
in the past.
Sebi Registration No: INB 010996539
For Private Circulation Only |