Daily Technical Report
July 30, 2012
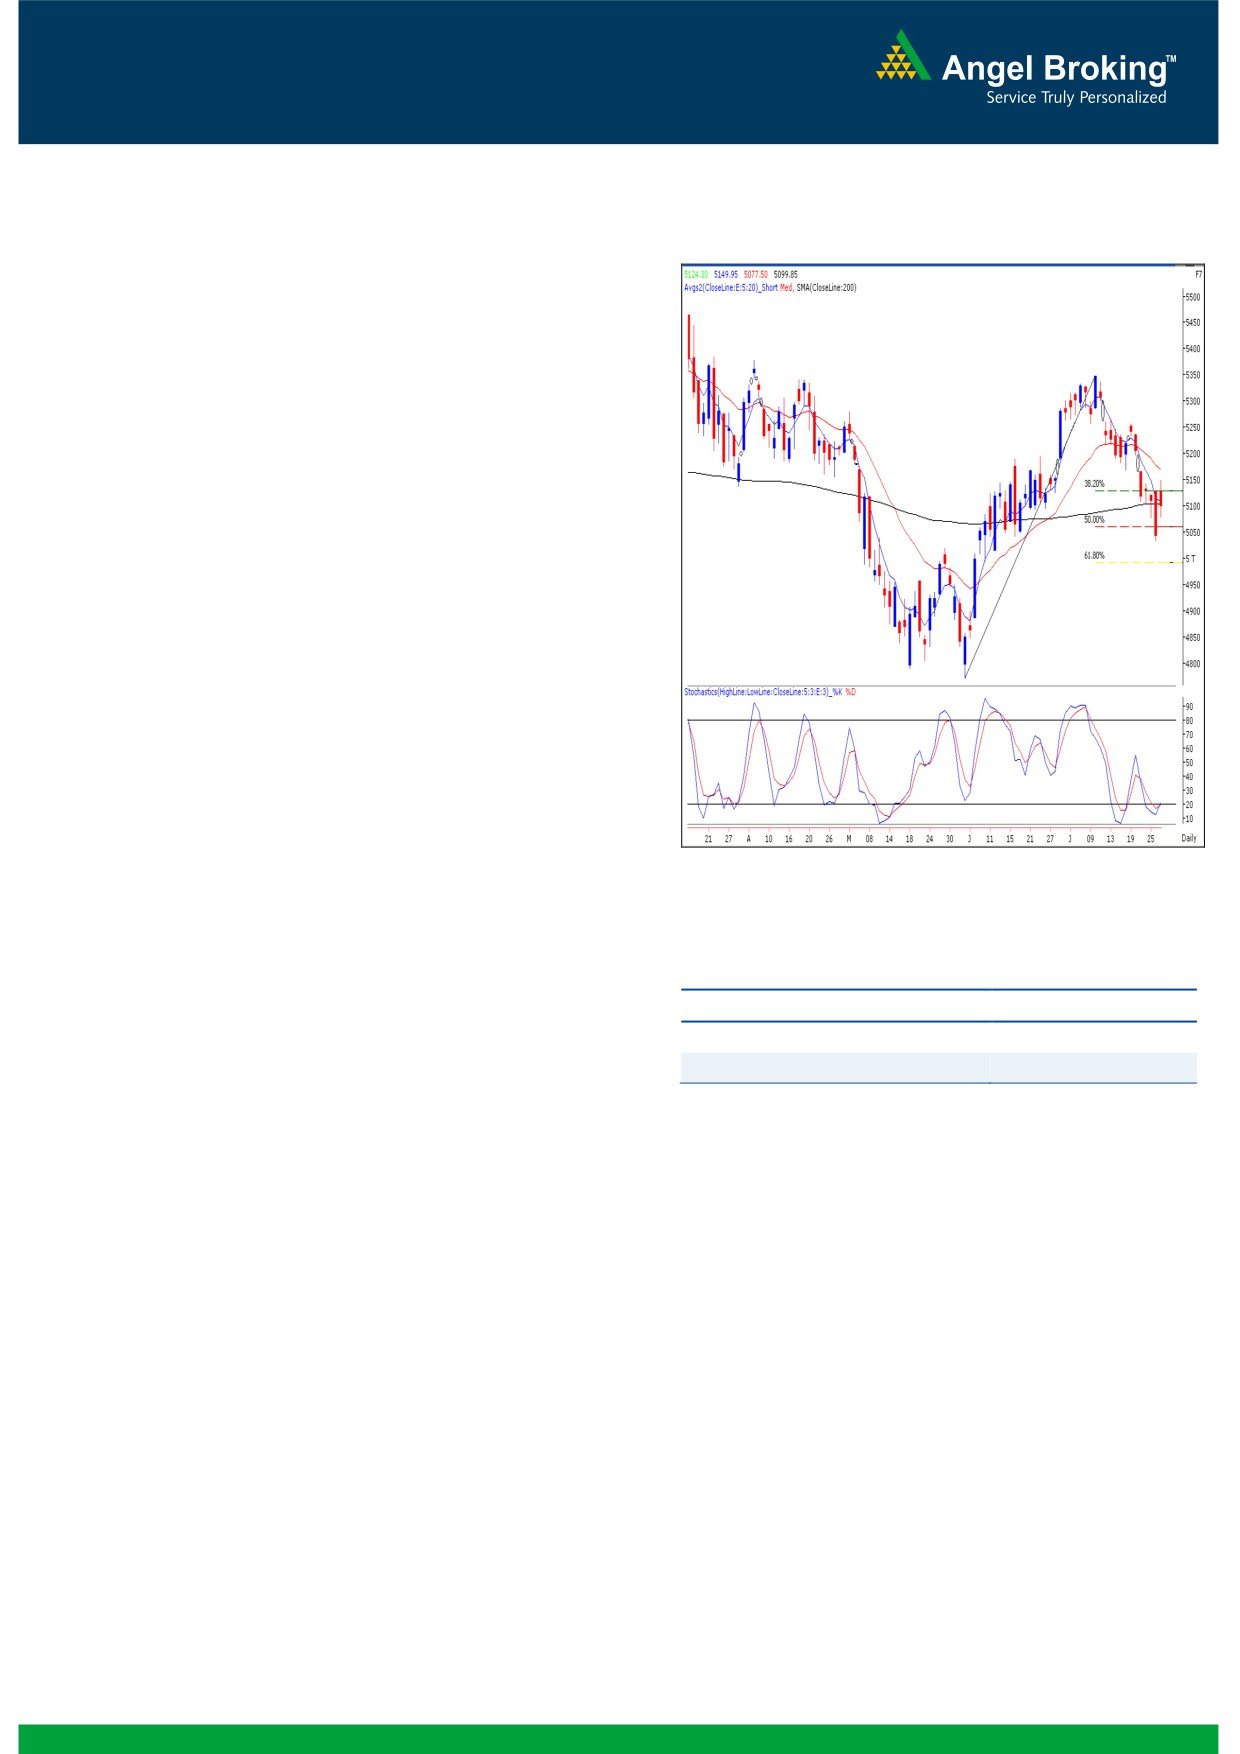
Exhibit 1: Nifty Daily Chart
Sensex (16839) / NIFTY (5100)
On Friday, our benchmark indices opened on an
optimistic note and rallied nearly 2% in early trade on
the back of positive global cues. However, profit
booking at higher levels trimmed gains and Indices
closed at the 5100 mark. On the sectoral front, Metal,
FMCG and IT counters contributed heavily in Friday’s
rally whereas; Realty, Consumer Goods and PSU
sectors remained under pressure. The advance to
decline ratio was strongly in favor of declining
counters
(A=1060 D=1703) (Source
-
Formation
The weekly
50% and
61.8% Fibonacci
retracement levels of the rise from 15748 /
4770 (June 08, 2012) to 17631 / 5349 (July 13,
2012) are seen at 16690 / 5059 and 16467 /
4991 levels, respectively.
On the weekly chart, we are witnessing a
“Downward Sloping Trend Line” resistance near
Source: Falcon
17500 / 5325 formed by joining the highs of
21109 / 6339 (November 5, 2010) - 18524 /
Actionable points:
5630 (February 24, 2012).
The ’20-day EMA’ and
’200-day SMA’ are
View
Neutral
placed at 17042 / 5169 and 16879 / 5100
Resistance Levels
5150 - 5198
levels, respectively.
Support Level
5078 - 5032
The daily ‘Stochastic’ oscillator is signaling a
positive crossover.
The immediate resistance for the market is seen at
16975 / 5150 level. If indices manage to sustain
Trading strategy:
above this level, then the indices may rally further
towards 17318 - 17466 / 5257 - 5300 levels. On
Despite strong global cues, our benchmark indices
the downside, last week’s low of 16598 / 5032
faced immense selling pressure near day’s high on
would act as a strong support level for the markets. A
Friday’s session. The selling pressure was mainly seen
breach of this level would augment pessimism and
in PSU Banks and other midcap counters. Indices are
indices are likely to test 16467 - 16250 / 4991 -
now hovering around the strong support zone of
4950 levels The coming week is likely to be volatile
‘200-day SMA’ and 50% Fibonacci retracement level,
on account of RBI Monetary policy announcement on
which is around
16879
-
16598
/
5100
-
Tuesday’s session. Hence, we advise traders to stay
5032,respectively. We are also observing a positive
light on the positions and avoid taking undue risks
crossover in the daily ‘Stochastic’ oscillator. Hence,
prior to the policy announcement.
the possibility of a bounce back from current levels
cannot be ruled out.
1
Daily Technical Report
July 30, 2012
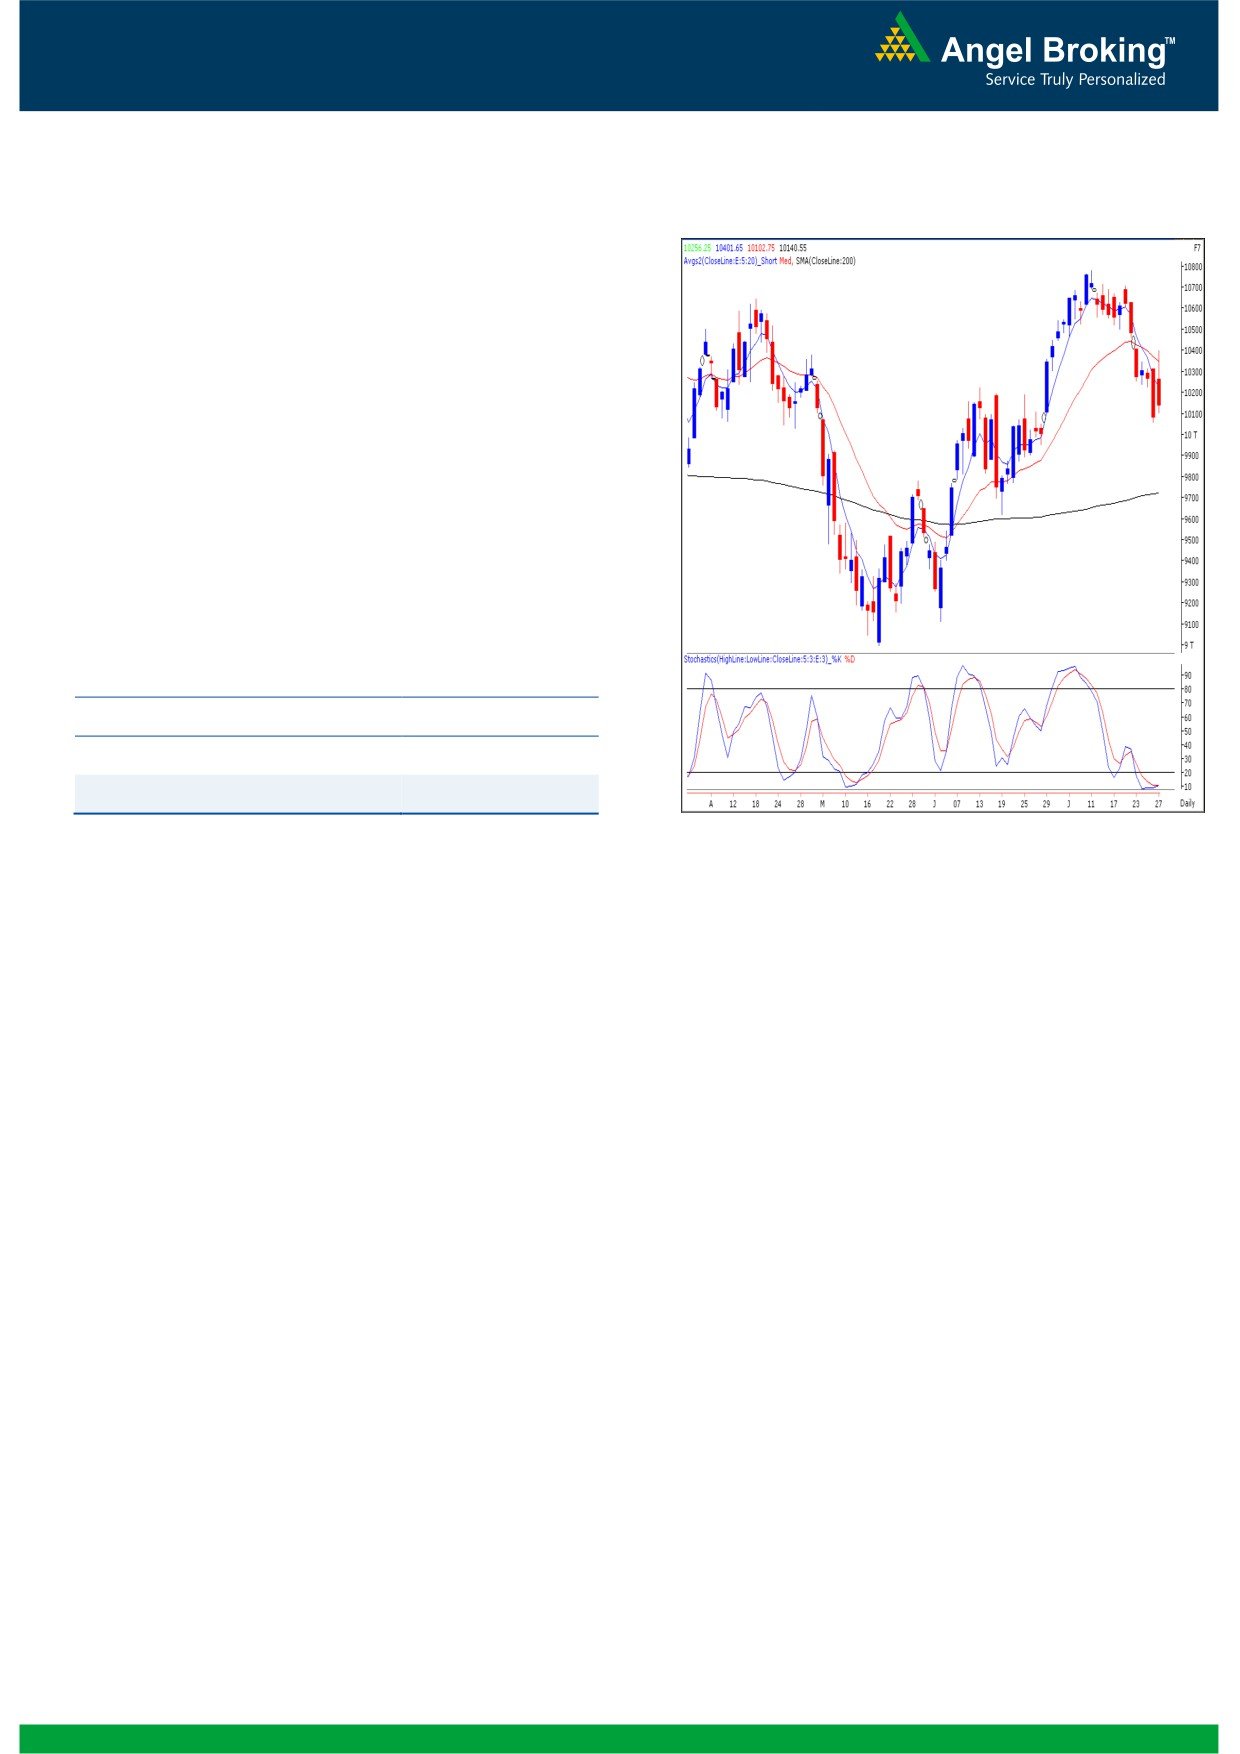
Bank Nifty Outlook - (10141)
Exhibit 2: Bank Nifty Daily Chart
On Friday, Bank Nifty opened on an optimistic note
and tested the gap formed on July 23, 2012 during
the first half of trade. However during the second half,
selling pressure near this gap dragged the index
lower. At this juncture the index is hovering around its
“20 Week EMA” at 10090. The momentum oscillator
“Stochastic” on the daily chart has given a fresh buy
signal. Considering the price pattern, momentum
oscillators and time retracements, we expect the index
to rally towards 10402 - 10460 in the coming week.
On the downside 10100 - 10050 are likely to act as
support levels.
Actionable points:
View
Neutral
Expected targets
10402 - 10460
Support Level
10100 - 10050
Source: Falcon
2
Daily Technical Report
July 30, 2012
Daily Pivot Levels for Nifty 50 Stocks
SCRIPS
S2
S1
PIVOT
R1
R2
SENSEX
16,644
16,742
16,858
16,956
17,073
NIFTY
5,037
5,068
5,109
5,141
5,182
BANKNIFTY
9,916
10,028
10,215
10,327
10,514
ACC
1,266
1,280
1,294
1,308
1,323
AMBUJACEM
178
180
182
184
186
ASIANPAINT
3,432
3,469
3,508
3,546
3,585
AXISBANK
963
980
1,009
1,026
1,055
BAJAJ-AUTO
1,551
1,567
1,587
1,603
1,622
BANKBARODA
624
637
659
671
693
BHARTIARTL
301
304
308
311
315
BHEL
201
204
210
214
220
BPCL
341
348
359
367
378
CAIRN
310
313
319
322
327
CIPLA
322
324
327
330
333
COALINDIA
348
351
353
356
357
DLF
186
190
197
200
207
DRREDDY
1,597
1,609
1,623
1,635
1,649
GAIL
334
340
347
352
359
GRASIM
2,644
2,672
2,696
2,724
2,748
HCLTECH
510
514
517
521
524
HDFC
666
670
675
679
685
HDFCBANK
555
570
579
594
603
HEROMOTOCO
1,932
1,971
2,018
2,057
2,104
HINDALCO
115
116
117
119
120
HINDUNILVR
460
462
465
468
471
ICICIBANK
906
917
933
944
960
IDFC
124
126
129
131
134
INFY
2,086
2,117
2,141
2,172
2,195
ITC
250
253
254
256
258
JINDALSTEL
382
388
397
403
411
JPASSOCIAT
66
68
71
73
76
KOTAKBANK
508
519
535
546
563
LT
1,283
1,301
1,326
1,345
1,370
M&M
674
681
688
695
702
MARUTI
1,096
1,104
1,115
1,123
1,134
NTPC
150
152
154
155
157
ONGC
269
273
278
282
287
PNB
664
689
734
759
804
POWERGRID
111
113
114
116
117
RANBAXY
475
479
485
489
495
RELIANCE
711
716
721
726
732
RELINFRA
452
463
479
490
505
SAIL
81
82
84
85
86
SBIN
1,844
1,893
1,980
2,028
2,116
SESAGOA
177
180
183
186
188
SIEMENS
639
646
659
666
678
STER
98
100
101
103
105
SUNPHARMA
611
622
628
639
645
TATAMOTORS
206
210
212
216
219
TATAPOWER
93
94
95
96
98
TATASTEEL
384
392
397
405
410
TCS
1,193
1,209
1,220
1,236
1,247
WIPRO
329
332
334
337
340
3
Daily Technical Report
July 30, 2012
Research Team Tel: 022 - 39357800
DISCLAIMER
This document is solely for the personal information of the recipient, and must not be singularly used as the basis of any investment
decision. Nothing in this document should be construed as investment or financial advice. Each recipient of this document should make
such investigations as they deem necessary to arrive at an independent evaluation of an investment in the securities of the companies
referred to in this document (including the merits and risks involved), and should consult their own advisors to determine the merits and
risks of such an investment.
Angel Broking Limited, its affiliates, directors, its proprietary trading and investment businesses may, from time to time, make
investment decisions that are inconsistent with or contradictory to the recommendations expressed herein. The views contained in this
document are those of the analyst, and the company may or may not subscribe to all the views expressed within.
Reports based on technical and derivative analysis center on studying charts of a stock's price movement, outstanding positions and
trading volume, as opposed to focusing on a company's fundamentals and, as such, may not match with a report on a company's
fundamentals.
The information in this document has been printed on the basis of publicly available information, internal data and other reliable
sources believed to be true, but we do not represent that it is accurate or complete and it should not be relied on as such, as this
document is for general guidance only. Angel Broking Limited or any of its affiliates/ group companies shall not be in any way
responsible for any loss or damage that may arise to any person from any inadvertent error in the information contained in this report.
Angel Broking Limited has not independently verified all the information contained within this document. Accordingly, we cannot testify,
nor make any representation or warranty, express or implied, to the accuracy, contents or data contained within this document. While
Angel Broking Limited endeavours to update on a reasonable basis the information discussed in this material, there may be regulatory,
compliance, or other reasons that prevent us from doing so.
This document is being supplied to you solely for your information, and its contents, information or data may not be reproduced,
redistributed or passed on, directly or indirectly.
Angel Broking Limited and its affiliates may seek to provide or have engaged in providing corporate finance, investment banking or
other advisory services in a merger or specific transaction to the companies referred to in this report, as on the date of this report or in
the past.
Neither Angel Broking Limited, nor its directors, employees or affiliates shall be liable for any loss or damage that may arise from or in
connection with the use of this information.
Note: Please refer to the important `Stock Holding Disclosure' report on the Angel website (Research Section). Also, please refer to the
latest update on respective stocks for the disclosure status in respect of those stocks. Angel Broking Limited and its affiliates may have
investment positions in the stocks recommended in this report.
Research Team
Shardul Kulkarni
-
Head - Technicals
Sameet Chavan
-
Technical Analyst
Sacchitanand Uttekar
-
Technical Analyst
Mehul Kothari
-
Technical Analyst
Ankur Lakhotia
-
Technical Analyst
Angel Broking Pvt. Ltd.
Registered Office: G-1, Ackruti Trade Centre, Rd. No. 7, MIDC, Andheri (E), Mumbai - 400 093.
Corporate Office: 6th Floor, Ackruti Star, MIDC, Andheri (E), Mumbai - 400 093. Tel: (022) 3952 6600
Sebi Registration No: INB 010996539
4