Technical Research | December 29, 2011
Daily Technical Report
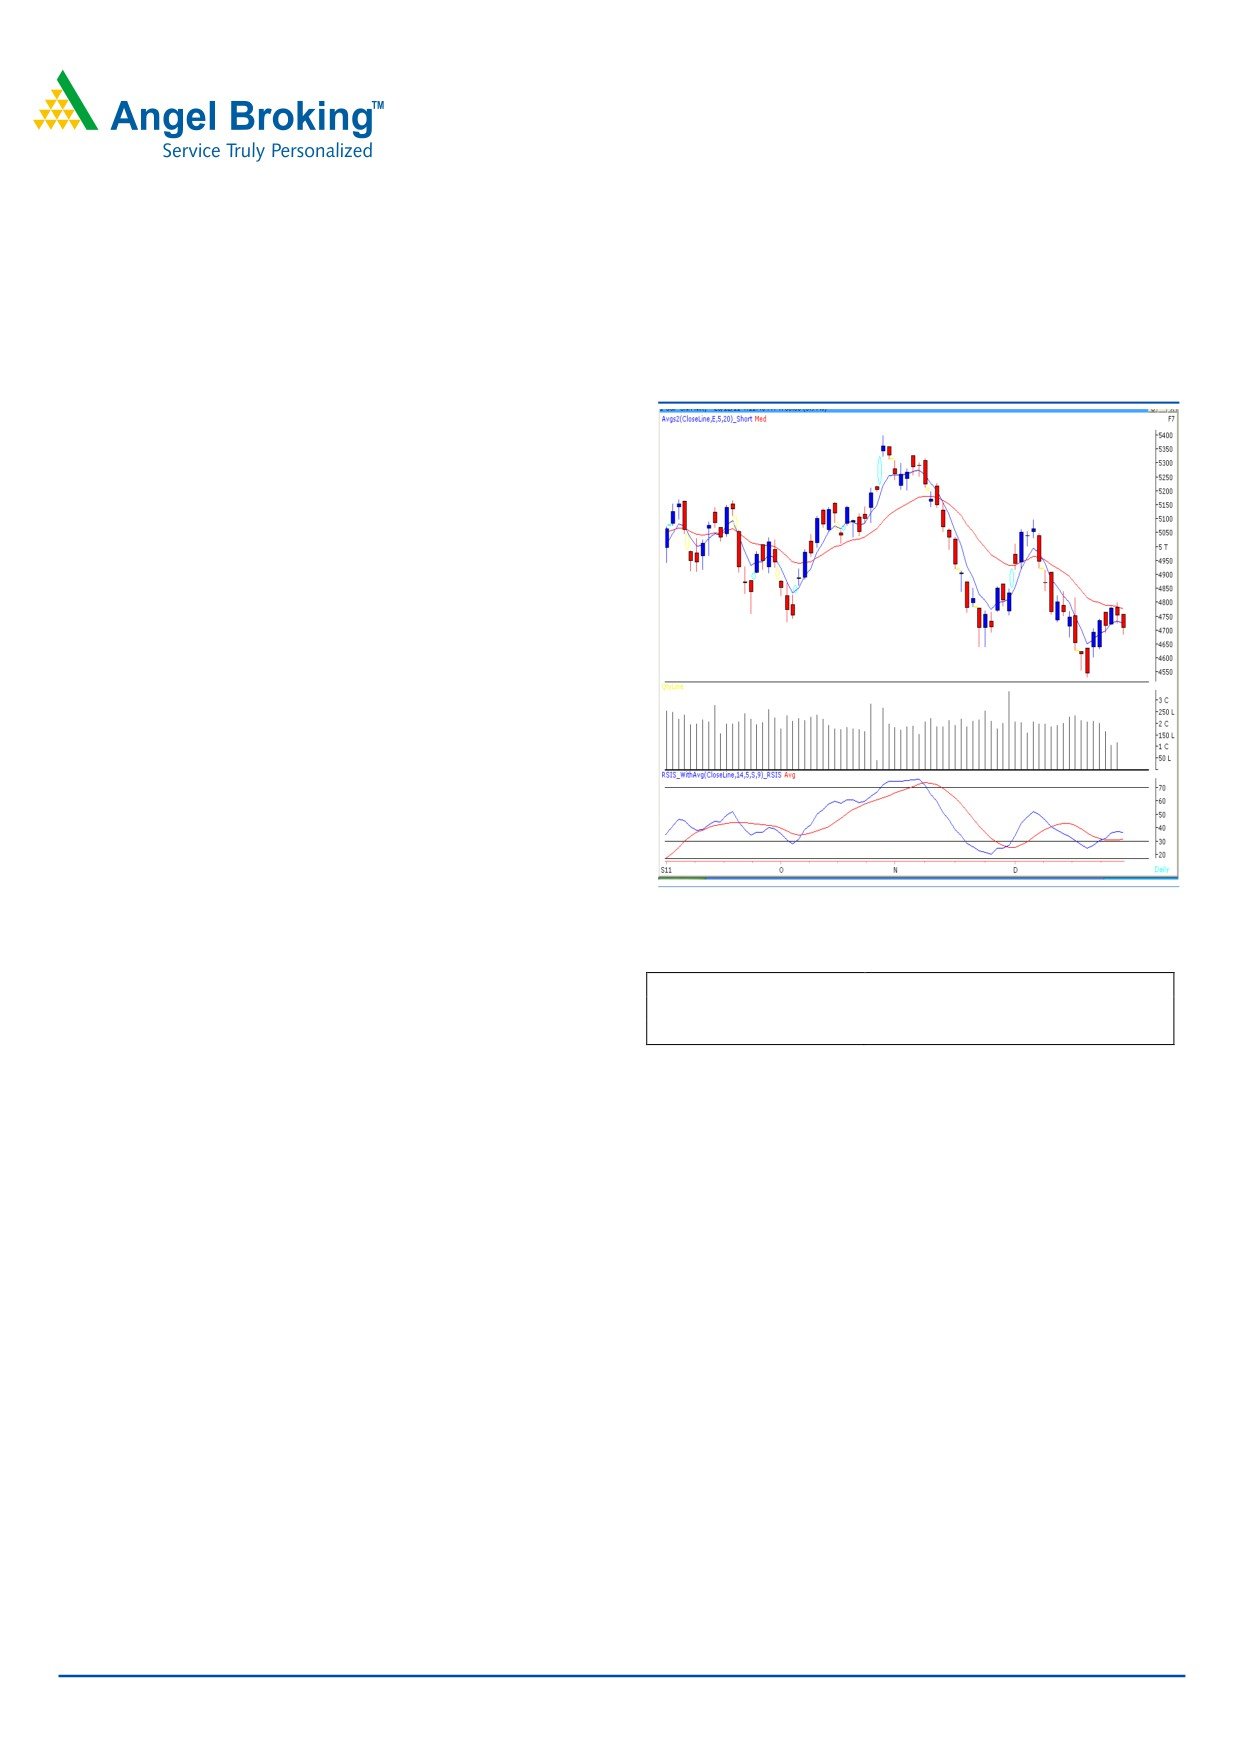
Sensex (15728) / NIFTY (4706)
Exhibit 1: Nifty Daily Chart
Once again indices opened on a flat note and traded with
negative bias almost throughtout the session. On the
sectoral front, Metal, Banking and Oil & Gas sectors were
among the major losers, whereas Power and Capital Goods
counters ended marginally on a losing side. The advance to
decline ratio was strongly in favor of declining counters.
Formation
• We are witnessing a positive crossover in “RSI
-
Smoothened” oscillator.
• The 20 EMA on the daily chart is placed at 16020 /
4800 level.
Source: Falcon
Trading strategy:
Actionable points:
We are witnessing that the
20 day EMA placed at
16020/4800 is proving to be a strong resistance for the
View
Neutral
Resistance levels
4800 - 4820
Indices. Yesterday, markets opened quietly and selling
Support levels
4685 - 4665 - 4632
pressure dragged indices lower to breach Tuesday’s low of
15799 / 4723. In line with expectations, indices then drifted
below 15800 / 4700 mark during the trading session but
finally managed to close around this level. Going forward,
if indices manage to sustain below yesterday’s low of
15666 / 4685, then they are likely to slide further towards
the next support levels of 15592 - 15472 / 4665 - 4632.
On the upside, we reiterate that the 20 Day EMA levels of
16020 - 16070 / 4800 - 4820 remains to be a strong
resistance zone for the markets.
Due to Derivatives expiry, the coming trading session is
likely to trade with high volatility and choppiness. Traders
are advised to stay light on positions and place strict stop
losses.
For Private Circulation Only |
1
Technical Research | December 29, 2011
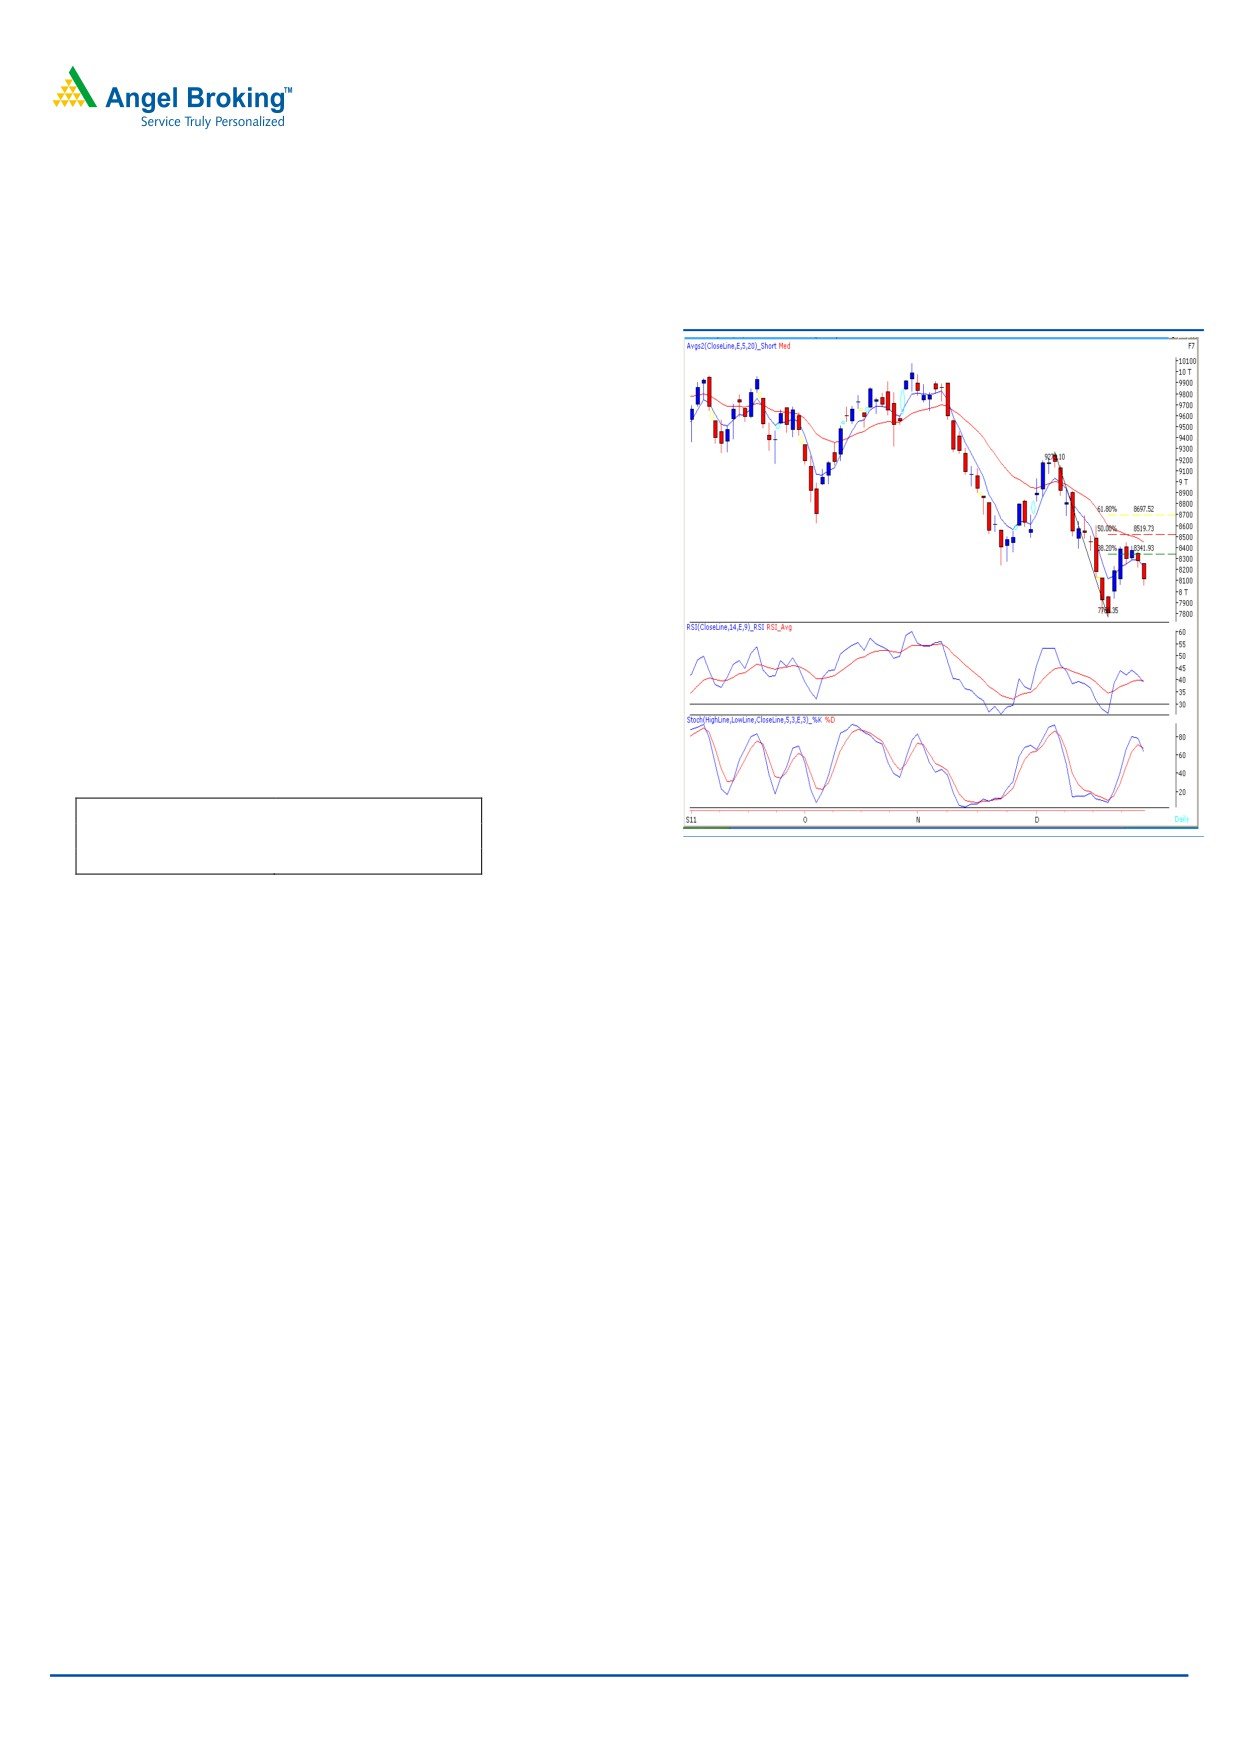
Bank Nifty Outlook - (8111)
Exhibit 2: Bank Nifty Daily Chart
Yesterday, Bank Nifty opened lower and tested the
mentioned support level of 8072. On the down side,
8028 is the 61.8% Fibonnaci retracement level of the rise
from 7766 - 8452. This retracement level is close to
yesterday’s low of 8053 and we expect the Bank Nifty to
take support near this level. However, on the Daily chart,
we are witnessing a negative crossover in “Stochastic”
and “RSI” momentum oscillators. Hence, in a scenario in
which the Bank Nifty sustains below 8028, it may slide
further to 7936 level. On the upside, 8150 - 8256 levels
may now act as resistance for the coming trading
sessions.
Actionable points:
View
Neutral
Resistance Level
8150 - 8256
Source: Falcon
Support Level
8053 - 8028
For Private Circulation Only |
2
Technical Research | December 29, 2011
Positive Bias:
Expected
Stock Name
CMP
5 Day EMA
20 Day EMA
Remarks
Target
Wel Corp
86.9
83.8
80.7
92
View will change below 81.6
Negative Bias:
Expected
Stock Name
CMP
5 Day EMA
20 Day EMA
Remarks
Target
Jindal Steel
455
478.6
500.6
441
View will change above 491
For Private Circulation Only |
3
Technical Research | December 29, 2011
Daily Pivot Levels for Nifty 50 Stocks
SCRIPS
S2
S1
PIVOT
R1
R2
SENSEX
15,539
15,634
15,761
15,855
15,982
NIFTY
4,645
4,676
4,716
4,746
4,786
BANKNIFTY
7,937
8,024
8,140
8,227
8,343
ACC
1,145
1,157
1,171
1,183
1,197
AMBUJACEM
159
161
163
164
166
AXISBANK
810
821
831
842
852
BAJAJ-AUTO
1,569
1,590
1,616
1,636
1,663
BHARTIARTL
337
340
343
347
349
BHEL
233
240
244
251
255
BPCL
485
490
497
502
509
CAIRN
305
310
317
322
330
CIPLA
311
317
321
326
330
DLF
183
188
191
196
200
DRREDDY
1,538
1,552
1,571
1,585
1,603
GAIL
385
390
394
399
403
HCLTECH
379
386
390
396
400
HDFC
647
654
665
672
682
HDFCBANK
429
434
439
444
449
HEROMOTOCO
1,873
1,892
1,906
1,925
1,939
HINDALCO
113
115
117
119
122
HINDUNILVR
406
409
413
416
421
ICICIBANK
678
688
704
714
731
IDFC
92
94
95
97
98
INFY
2,727
2,754
2,779
2,807
2,832
ITC
199
200
203
205
207
JINDALSTEL
418
436
464
482
510
JPASSOCIAT
51
53
53
55
55
KOTAKBANK
436
445
451
461
467
LT
996
1,013
1,024
1,040
1,051
M&M
668
678
693
702
718
MARUTI
939
949
961
971
983
NTPC
155
158
160
163
166
ONGC
258
259
261
263
265
PNB
746
760
785
799
824
POWERGRID
97
99
100
101
102
RANBAXY
397
401
407
411
416
RCOM
70
71
72
73
75
RELCAPITAL
240
244
248
251
255
RELIANCE
721
730
744
753
767
RELINFRA
349
354
362
366
374
RPOWER
71
71
72
73
74
SAIL
78
79
80
81
82
SBIN
1,583
1,597
1,616
1,629
1,648
SESAGOA
156
158
160
162
164
SIEMENS
642
649
662
670
683
STER
87
88
90
92
94
SUNPHARMA
491
495
499
503
507
SUZLON
18
19
19
20
20
TATAMOTORS
176
178
181
183
186
TATAPOWER
89
91
92
94
96
TATASTEEL
339
343
347
351
355
TCS
1,155
1,162
1,173
1,180
1,191
WIPRO
384
391
401
407
417
Technical Research Team
For Private Circulation Only |
4
Technical Report
RESEARCH TEAM
Shardul Kulkarni
Head - Technicals
Sameet Chavan
Technical Analyst
Sacchitanand Uttekar
Technical Analyst
Mehul Kothari
Technical Analyst
Ankur Lakhotia
Technical Analyst
Research Team: 022-3952 6600
DISCLAIMER: This document is not for public distribution and has been furnished to you solely for your information and must not
be reproduced or redistributed to any other person. Persons into whose possession this document may come are required to observe
these restrictions.
Opinion expressed is our current opinion as of the date appearing on this material only. While we endeavor to update on a
reasonable basis the information discussed in this material, there may be regulatory, compliance, or other reasons that prevent us
from doing so. Prospective investors and others are cautioned that any forward-looking statements are not predictions and may be
subject to change without notice. Our proprietary trading and investment businesses may make investment decisions that are
inconsistent with the recommendations expressed herein.
The information in this document has been printed on the basis of publicly available information, internal data and other reliable
sources believed to be true and are for general guidance only. While every effort is made to ensure the accuracy and completeness of
information contained, the company takes no guarantee and assumes no liability for any errors or omissions of the information. No
one can use the information as the basis for any claim, demand or cause of action.
Recipients of this material should rely on their own investigations and take their own professional advice. Each recipient of this
document should make such investigations as it deems necessary to arrive at an independent evaluation of an investment in the
securities of companies referred to in this document (including the merits and risks involved), and should consult their own advisors to
determine the merits and risks of such an investment. Price and value of the investments referred to in this material may go up or
down. Past performance is not a guide for future performance. Certain transactions - futures, options and other derivatives as well as
non-investment grade securities - involve substantial risks and are not suitable for all investors. Reports based on technical analysis
centers on studying charts of a stock's price movement and trading volume, as opposed to focusing on a company's fundamentals
and as such, may not match with a report on a company's fundamentals.
We do not undertake to advise you as to any change of our views expressed in this document. While we would endeavor to update
the information herein on a reasonable basis, Angel Broking, its subsidiaries and associated companies, their directors and
employees are under no obligation to update or keep the information current. Also there may be regulatory, compliance, or other
reasons that may prevent Angel Broking and affiliates from doing so. Prospective investors and others are cautioned that any
forward-looking statements are not predictions and may be subject to change without notice.
Angel Broking Limited and affiliates, including the analyst who has issued this report, may, on the date of this report, and from time
to time, have long or short positions in, and buy or sell the securities of the companies mentioned herein or engage in any other
transaction involving such securities and earn brokerage or compensation or act as advisor or have other potential conflict of interest
with respect to company/ies mentioned herein or inconsistent with any recommendation and related information and opinions.
Angel Broking Limited and affiliates may seek to provide or have engaged in providing corporate finance, investment banking or
other advisory services in a merger or specific transaction to the companies referred to in this report, as on the date of this report or
in the past.
Sebi Registration No : INB 010996539
For Private Circulation Only |