Daily Technical Report
August 29, 2012
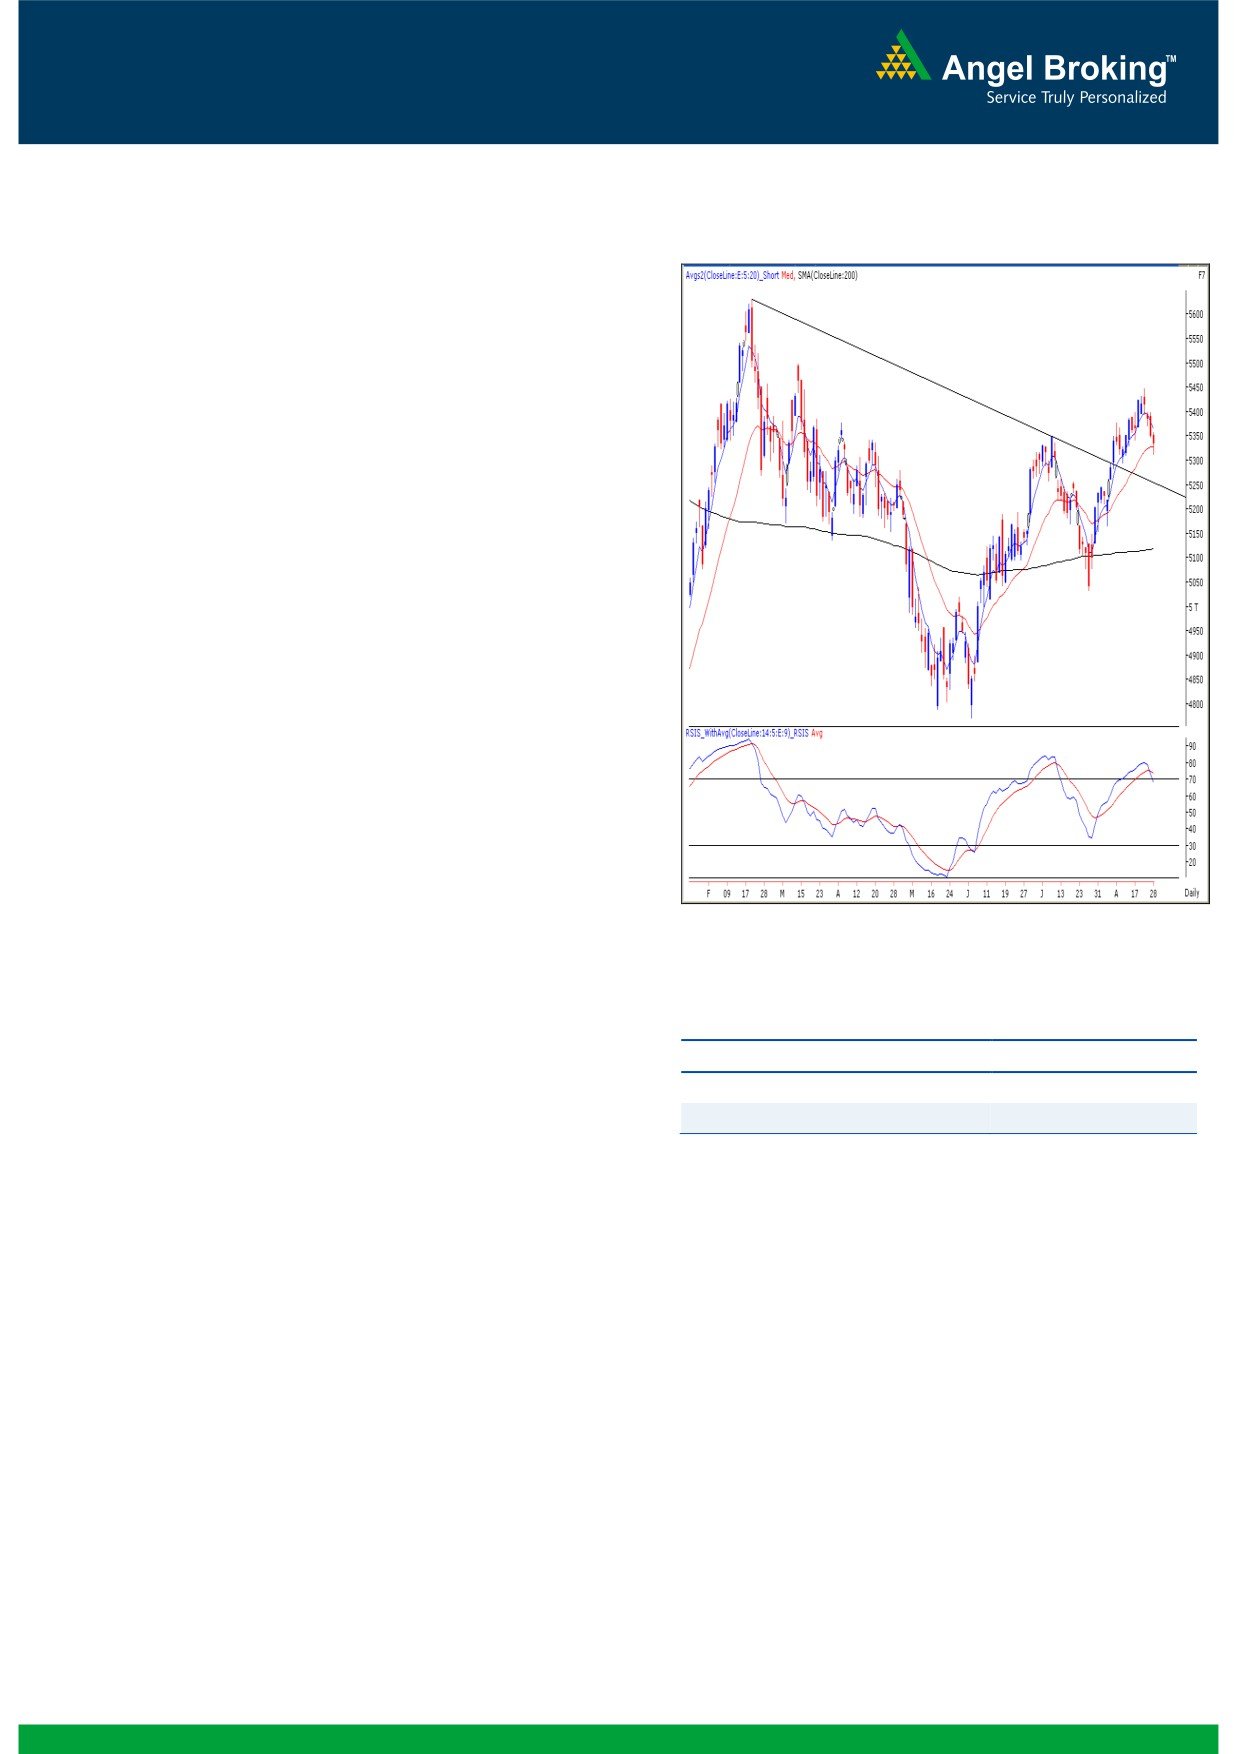
Exhibit 1: Nifty Daily Chart
Sensex (17632) / NIFTY (5335)
Yesterday, indices opened on a flat note in-line with
mixed global cues and registered a low of 17570 /
5312. Subsequently, a minor bounce towards the end
led indices to close marginally in the negative
territory. Once again the selling pressure was
observed mainly in Metal, Capital Goods and
Banking counters; whereas IT, FMCG and Teck
sectors were in the green during yesterday’s session.
The advance to decline ratio was strongly in favor of
declining counters (A=929 D=1889) (Source
-
Formation
On the weekly chart, the indices have closed
above the “Downward Sloping Trend Line”
resistance around
17650/
5370 formed by
joining the highs of 21109 / 6339 (November 5,
2010) - 18524 / 5630 (February 24, 2012).
The ’20-day EMA’ and the ’200-day SMA’ are
placed at 17572 / 5327 and 16900 / 5110
levels, respectively.
Source: Falcon
Looking at the “Line Chart” it is clear that indices
have now confirmed the ‘Higher Top - Higher
Actionable points:
Bottom’ formation on the weekly chart after
August 28, 2009.
View
Negative Below 5312
The daily momentum oscillator’s viz., the RSI and
Expected Targets
5290 - 5240
the Stochastic are signaling a negative crossover.
Resistance Levels
5359 - 5399
The weekly chart candle resembles a ‘Shooting
Star’ pattern.
Trading strategy:
Yesterday, after a quiet opening, immense selling
pressure resulted in a breach of Monday's low i.e.
5346 during the initial hour of trade. As expected, we
witnessed a sharp down move in the markets but the
'20-day EMA' level provided a decent support for the
day. Going forward, a breach of yesterday's low of
17570 / 5312 would reinforce selling pressure and in
this scenario, indices may slip towards 17450 - 17285 /
5290 - 5240 levels. Conversely, the resistance levels are
seen around 17676 - 17820 / 5359 - 5399.
1
Daily Technical Report
August 29, 2012
Exhibit 2: Bank Nifty Daily Chart
Bank Nifty Outlook - (10059)
Yesterday, Bank Nifty opened on a pessimistic note in
line with our benchmark indices and traded with
extreme volatility throughout the session. As
mentioned in our previous reports the momentum
oscillators on daily chart continue with their sell
signal. However, we are now witnessing “Positive
Divergence” in momentum oscillator “RSI” on the
hourly chart. Hence a minor pullback during the day
cannot be ruled out. In this scenario the index may
bounce towards
10151
-
10230 levels. On the
downside 9964 - 9914 levels are likely to act as
support in coming trading session.
Actionable points:
View
Neutral
Resistance Levels
10151 - 10230
Support Levels
9964 - 9914
Source: Falcon
2
Daily Technical Report
August 29, 2012
Research Team Tel: 022 - 39357800
DISCLAIMER
This document is solely for the personal information of the recipient, and must not be singularly used as the basis of any investment
decision. Nothing in this document should be construed as investment or financial advice. Each recipient of this document should make
such investigations as they deem necessary to arrive at an independent evaluation of an investment in the securities of the companies
referred to in this document (including the merits and risks involved), and should consult their own advisors to determine the merits and
risks of such an investment.
Angel Broking Limited, its affiliates, directors, its proprietary trading and investment businesses may, from time to time, make
investment decisions that are inconsistent with or contradictory to the recommendations expressed herein. The views contained in this
document are those of the analyst, and the company may or may not subscribe to all the views expressed within.
Reports based on technical and derivative analysis center on studying charts of a stock's price movement, outstanding positions and
trading volume, as opposed to focusing on a company's fundamentals and, as such, may not match with a report on a company's
fundamentals.
The information in this document has been printed on the basis of publicly available information, internal data and other reliable
sources believed to be true, but we do not represent that it is accurate or complete and it should not be relied on as such, as this
document is for general guidance only. Angel Broking Limited or any of its affiliates/ group companies shall not be in any way
responsible for any loss or damage that may arise to any person from any inadvertent error in the information contained in this report.
Angel Broking Limited has not independently verified all the information contained within this document. Accordingly, we cannot testify,
nor make any representation or warranty, express or implied, to the accuracy, contents or data contained within this document. While
Angel Broking Limited endeavours to update on a reasonable basis the information discussed in this material, there may be regulatory,
compliance, or other reasons that prevent us from doing so.
This document is being supplied to you solely for your information, and its contents, information or data may not be reproduced,
redistributed or passed on, directly or indirectly.
Angel Broking Limited and its affiliates may seek to provide or have engaged in providing corporate finance, investment banking or
other advisory services in a merger or specific transaction to the companies referred to in this report, as on the date of this report or in
the past.
Neither Angel Broking Limited, nor its directors, employees or affiliates shall be liable for any loss or damage that may arise from or in
connection with the use of this information.
Note: Please refer to the important `Stock Holding Disclosure' report on the Angel website (Research Section). Also, please refer to the
latest update on respective stocks for the disclosure status in respect of those stocks. Angel Broking Limited and its affiliates may have
investment positions in the stocks recommended in this report.
Research Team
Shardul Kulkarni
-
Head - Technicals
Sameet Chavan
-
Technical Analyst
Sacchitanand Uttekar
-
Technical Analyst
Mehul Kothari
-
Technical Analyst
Ankur Lakhotia
-
Technical Analyst
Angel Broking Pvt. Ltd.
Registered Office: G-1, Ackruti Trade Centre, Rd. No. 7, MIDC, Andheri (E), Mumbai - 400 093.
Corporate Office: 6th Floor, Ackruti Star, MIDC, Andheri (E), Mumbai - 400 093. Tel: (022) 3952 6600
Sebi Registration No: INB 010996539
4