Technical Research | February 29, 2012
Daily Technical Report
Sensex (17731) / NIFTY (5376)
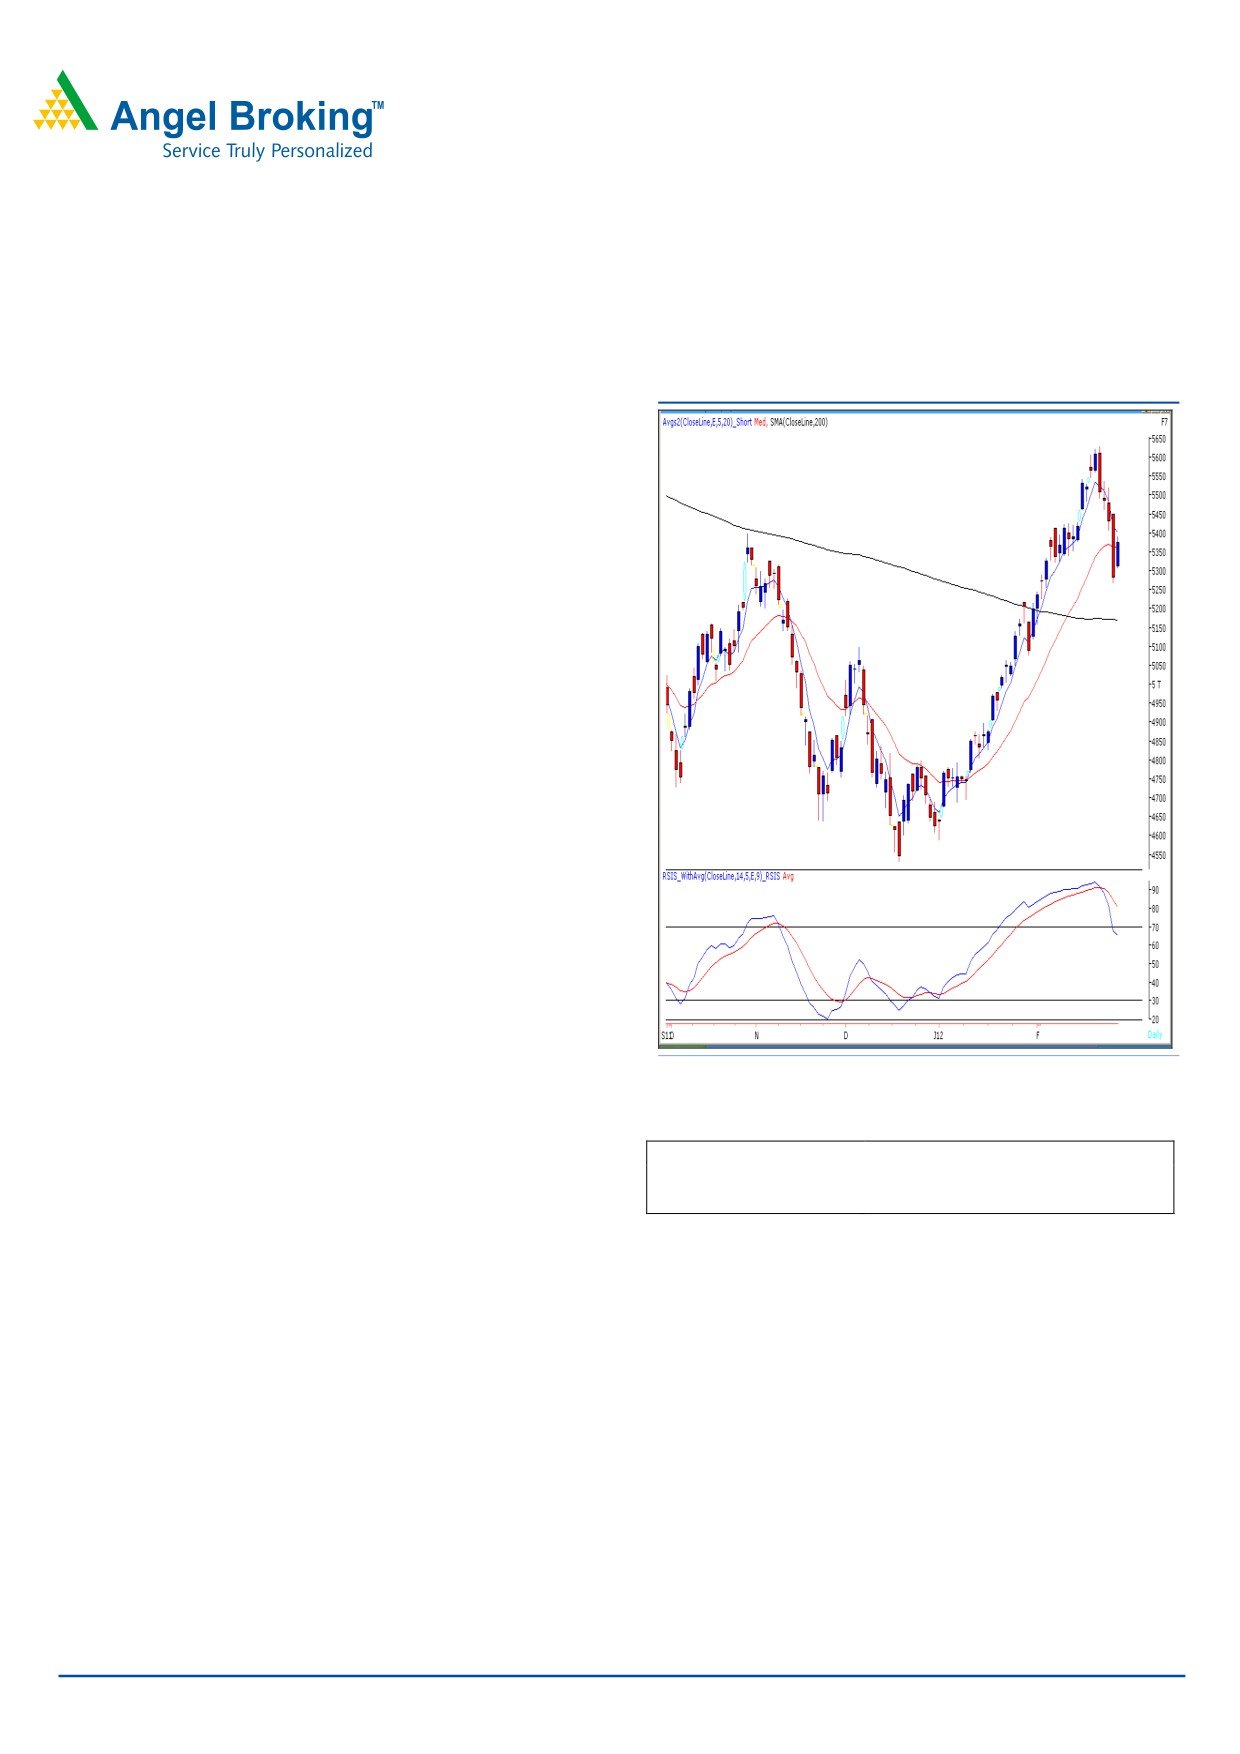
Exhibit 1: Nifty Daily Chart
Yesterday, markets opened with an upside gap and traded
with positive bias throughout the day to close near day’s
high. The rally led the indices to test the mentioned
resistance zone of 17720 - 17975 / 5370 - 5450 and
finally closed with 1.7% gains. On the sectoral front, Realty,
Consumer Goods and Banking counters contributed heavily
in yesterday’s rally, whereas FMCG and IT sector ended
with a nominal loss. The advance to decline ratio was
strongly in favor of advancing counters. (A=2139 D=765)
Formation:
• The 200-day SMA and 20-day EMA have now shifted to
17200 / 5170 and 17720 / 5370, respectively.
• The “RSI-Smoothened” oscillator and “3 & 8 EMA” on
the daily chart have given a negative crossover.
• The weekly “Stochastic” oscillator is negatively poised.
• The daily chart indicates the formation of a “Bullish
Harami” Candlestick pattern
Source: Falcon
Actionable points:
Trading strategy:
View
Neutral
Yesterday, we witnessed that our markets traded with
Resistance Level
5406 - 5450
positive momentum throughout the day to test and close
Support Level
5340 - 5306
near the mentioned resistance zone of 17720 - 17975 /
5370 - 5450. The daily chart now indicates the formation
Indicates that only a sustainable move beyond 17818 -
of a “Bullish Harami“pattern but this pattern requires
5406 may trigger positive momentum and indices may
confirmation in the form of a closing above days high at
test 17975 - 5450. On the downside yesterday’s low of
17776 - 5391. Since, the bearish technical evidences in
17530 / 5306 could now act as immediate support for the
“RSI-Smoothened” oscillator and “3 & 8 EMA” are still
markets. A fall below this support could trigger fresh selling
intact, we are of the opinion that markets may face
and indices can test 17382 / 5255, thus negating the
resistance near 17818 / 5406 levels. This level coincides
bullish implication of the “Harami” pattern.
with 38.2% Fibonacci retracement levels of the recent fall
from February
22,
2012 to February
27,
2012
respectively. Overall assessment of the market position
For Private Circulation Only |
1
Technical Research | February 29, 2012
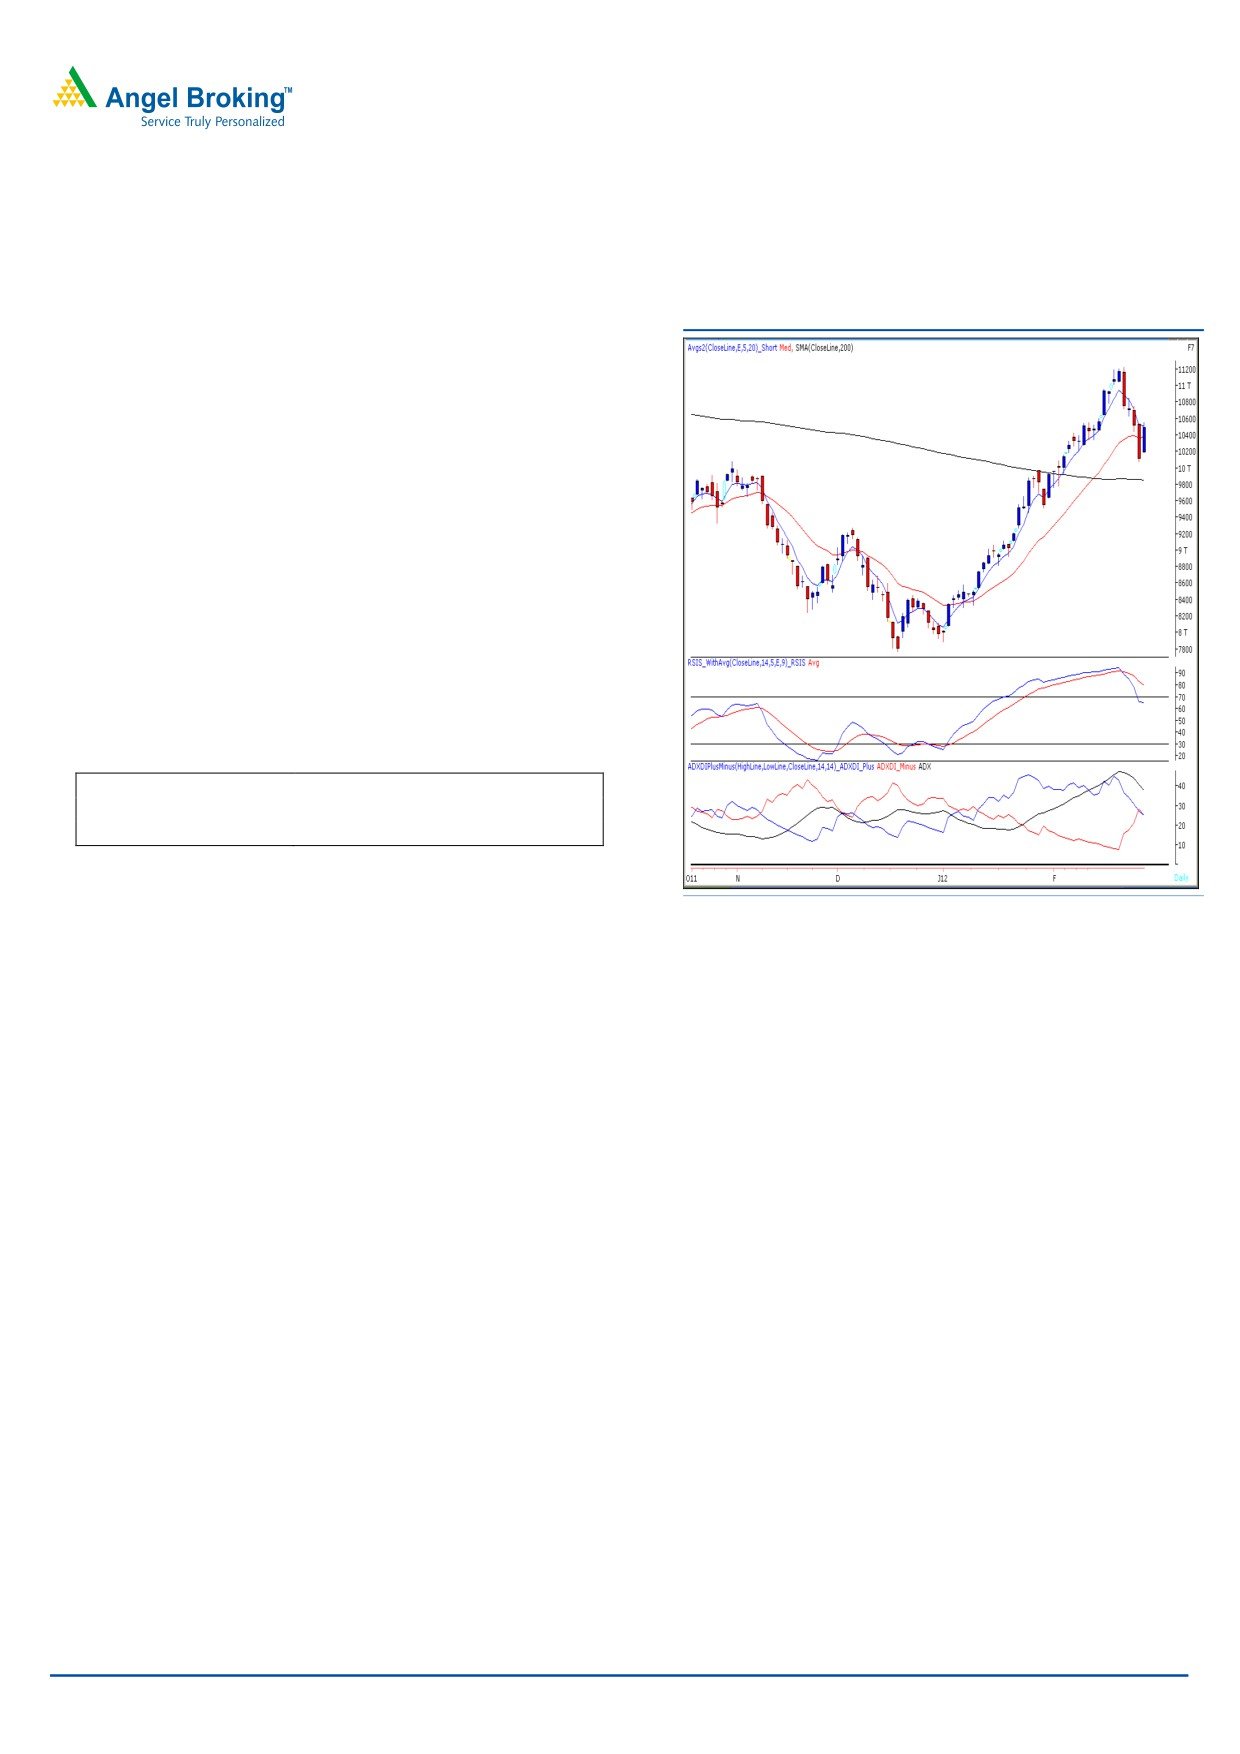
Bank Nifty Outlook - (10484)
Exhibit 2: Bank Nifty Daily Chart
Yesterday, Bank Nifty opened on an optimistic note in line
with our benchmark indices and gained strength as the
day progressed to close 3.76% higher. We are now
witnessing that the index has taken support at the 61.8%
Fibonacci retracement of the rise from January 30, 2012
- February 22, 2012. However the negative crossover in
directional indicators of “ADX (14)” mentioned in our
previous report is still intact. On the upside a move
beyond yesterday’s high of 10561 may trigger positive
momentum and the bank nifty may test 10760 levels. On
the downside 10316 - 10178 levels are likely to act as
support in coming trading session.
Actionable points:
View
Neutral
Resistance Levels
10587 - 10760
Support Levels
10316 - 10178
Source: Falcon
For Private Circulation Only |
2
Technical Research | February 29, 2012
Positive Bias:
Expected
Stock Name
CMP
5 Day EMA
20 Day EMA
Remarks
Target
Jain Irrigation
105.3
106.2
104.8
110
View will change below 99
Negative Bias:
Expected
Stock Name
CMP
5 Day EMA
20 Day EMA
Remarks
Target
Wipro
420.2
430.3
431.4
408
View will change above 431
For Private Circulation Only |
3
Technical Research | February 29, 2012
Daily Pivot Levels for Nifty 50 Stocks
SCRIPS
S2
S1
PIVOT
R1
R2
SENSEX
17,433
17,582
17,679
17,828
17,926
NIFTY
5,273
5,324
5,358
5,409
5,442
BANKNIFTY
10,025
10,255
10,408
10,638
10,791
ACC
1,250
1,269
1,286
1,305
1,321
AMBUJACEM
158
160
163
165
168
AXISBANK
1,092
1,131
1,160
1,199
1,227
BAJAJ-AUTO
1,687
1,727
1,752
1,792
1,817
BHARTIARTL
333
338
344
349
355
BHEL
285
297
304
316
323
BPCL
635
644
657
666
679
CAIRN
353
360
369
376
386
CIPLA
310
315
319
323
327
COALINDIA
321
325
328
333
336
DLF
212
219
223
230
235
DRREDDY
1,624
1,636
1,645
1,657
1,667
GAIL
369
371
375
378
381
HCLTECH
466
474
481
489
495
HDFC
660
665
674
679
687
HDFCBANK
506
518
526
538
546
HEROMOTOCO
1,919
1,943
1,965
1,988
2,011
HINDALCO
138
142
145
150
153
HINDUNILVR
378
380
382
383
386
ICICIBANK
884
897
909
922
933
IDFC
128
134
138
143
147
INFY
2,824
2,848
2,879
2,903
2,934
ITC
208
209
211
213
215
JINDALSTEL
570
582
591
603
612
JPASSOCIAT
69
72
74
77
79
KOTAKBANK
531
541
554
564
577
LT
1,247
1,298
1,329
1,379
1,410
M&M
691
697
704
711
718
MARUTI
1,228
1,249
1,264
1,285
1,300
NTPC
177
179
181
183
185
ONGC
274
279
282
287
290
PNB
887
919
944
977
1,002
POWERGRID
109
111
112
113
115
RANBAXY
419
424
428
432
436
RCOM
86
90
93
97
99
RELIANCE
782
789
795
802
808
RELINFRA
517
559
587
629
657
RPOWER
107
113
116
122
126
SAIL
95
97
99
101
103
SBIN
2,081
2,156
2,206
2,281
2,330
SESAGOA
201
205
208
212
216
SIEMENS
751
781
799
829
846
STER
114
118
120
123
125
SUNPHARMA
538
542
547
552
557
SUZLON
24
25
26
27
27
TATAMOTORS
257
265
270
279
284
TATAPOWER
109
110
112
114
115
TATASTEEL
440
450
456
466
472
TCS
1,194
1,210
1,235
1,252
1,277
WIPRO
411
416
423
428
436
Technical Research Team
For Private Circulation Only |
4
Technical Report
RESEARCH TEAM
Shardul Kulkarni
Head - Technicals
Sameet Chavan
Technical Analyst
Sacchitanand Uttekar
Technical Analyst
Mehul Kothari
Technical Analyst
Ankur Lakhotia
Technical Analyst
Research Team: 022-3952 6600
DISCLAIMER: This document is not for public distribution and has been furnished to you solely for your information and must not
be reproduced or redistributed to any other person. Persons into whose possession this document may come are required to observe
these restrictions.
Opinion expressed is our current opinion as of the date appearing on this material only. While we endeavor to update on a
reasonable basis the information discussed in this material, there may be regulatory, compliance, or other reasons that prevent us
from doing so. Prospective investors and others are cautioned that any forward-looking statements are not predictions and may be
subject to change without notice. Our proprietary trading and investment businesses may make investment decisions that are
inconsistent with the recommendations expressed herein.
The information in this document has been printed on the basis of publicly available information, internal data and other reliable
sources believed to be true and are for general guidance only. While every effort is made to ensure the accuracy and completeness of
information contained, the company takes no guarantee and assumes no liability for any errors or omissions of the information. No
one can use the information as the basis for any claim, demand or cause of action.
Recipients of this material should rely on their own investigations and take their own professional advice. Each recipient of this
document should make such investigations as it deems necessary to arrive at an independent evaluation of an investment in the
securities of companies referred to in this document (including the merits and risks involved), and should consult their own advisors to
determine the merits and risks of such an investment. Price and value of the investments referred to in this material may go up or
down. Past performance is not a guide for future performance. Certain transactions - futures, options and other derivatives as well as
non-investment grade securities - involve substantial risks and are not suitable for all investors. Reports based on technical analysis
centers on studying charts of a stock's price movement and trading volume, as opposed to focusing on a company's fundamentals
and as such, may not match with a report on a company's fundamentals.
We do not undertake to advise you as to any change of our views expressed in this document. While we would endeavor to update
the information herein on a reasonable basis, Angel Broking, its subsidiaries and associated companies, their directors and
employees are under no obligation to update or keep the information current. Also there may be regulatory, compliance, or other
reasons that may prevent Angel Broking and affiliates from doing so. Prospective investors and others are cautioned that any
forward-looking statements are not predictions and may be subject to change without notice.
Angel Broking Limited and affiliates, including the analyst who has issued this report, may, on the date of this report, and from time
to time, have long or short positions in, and buy or sell the securities of the companies mentioned herein or engage in any other
transaction involving such securities and earn brokerage or compensation or act as advisor or have other potential conflict of interest
with respect to company/ies mentioned herein or inconsistent with any recommendation and related information and opinions.
Angel Broking Limited and affiliates may seek to provide or have engaged in providing corporate finance, investment banking or
other advisory services in a merger or specific transaction to the companies referred to in this report, as on the date of this report or
in the past.
Sebi Registration No : INB 010996539
For Private Circulation Only |