Technical Research | December 28, 2011
Daily Technical Report
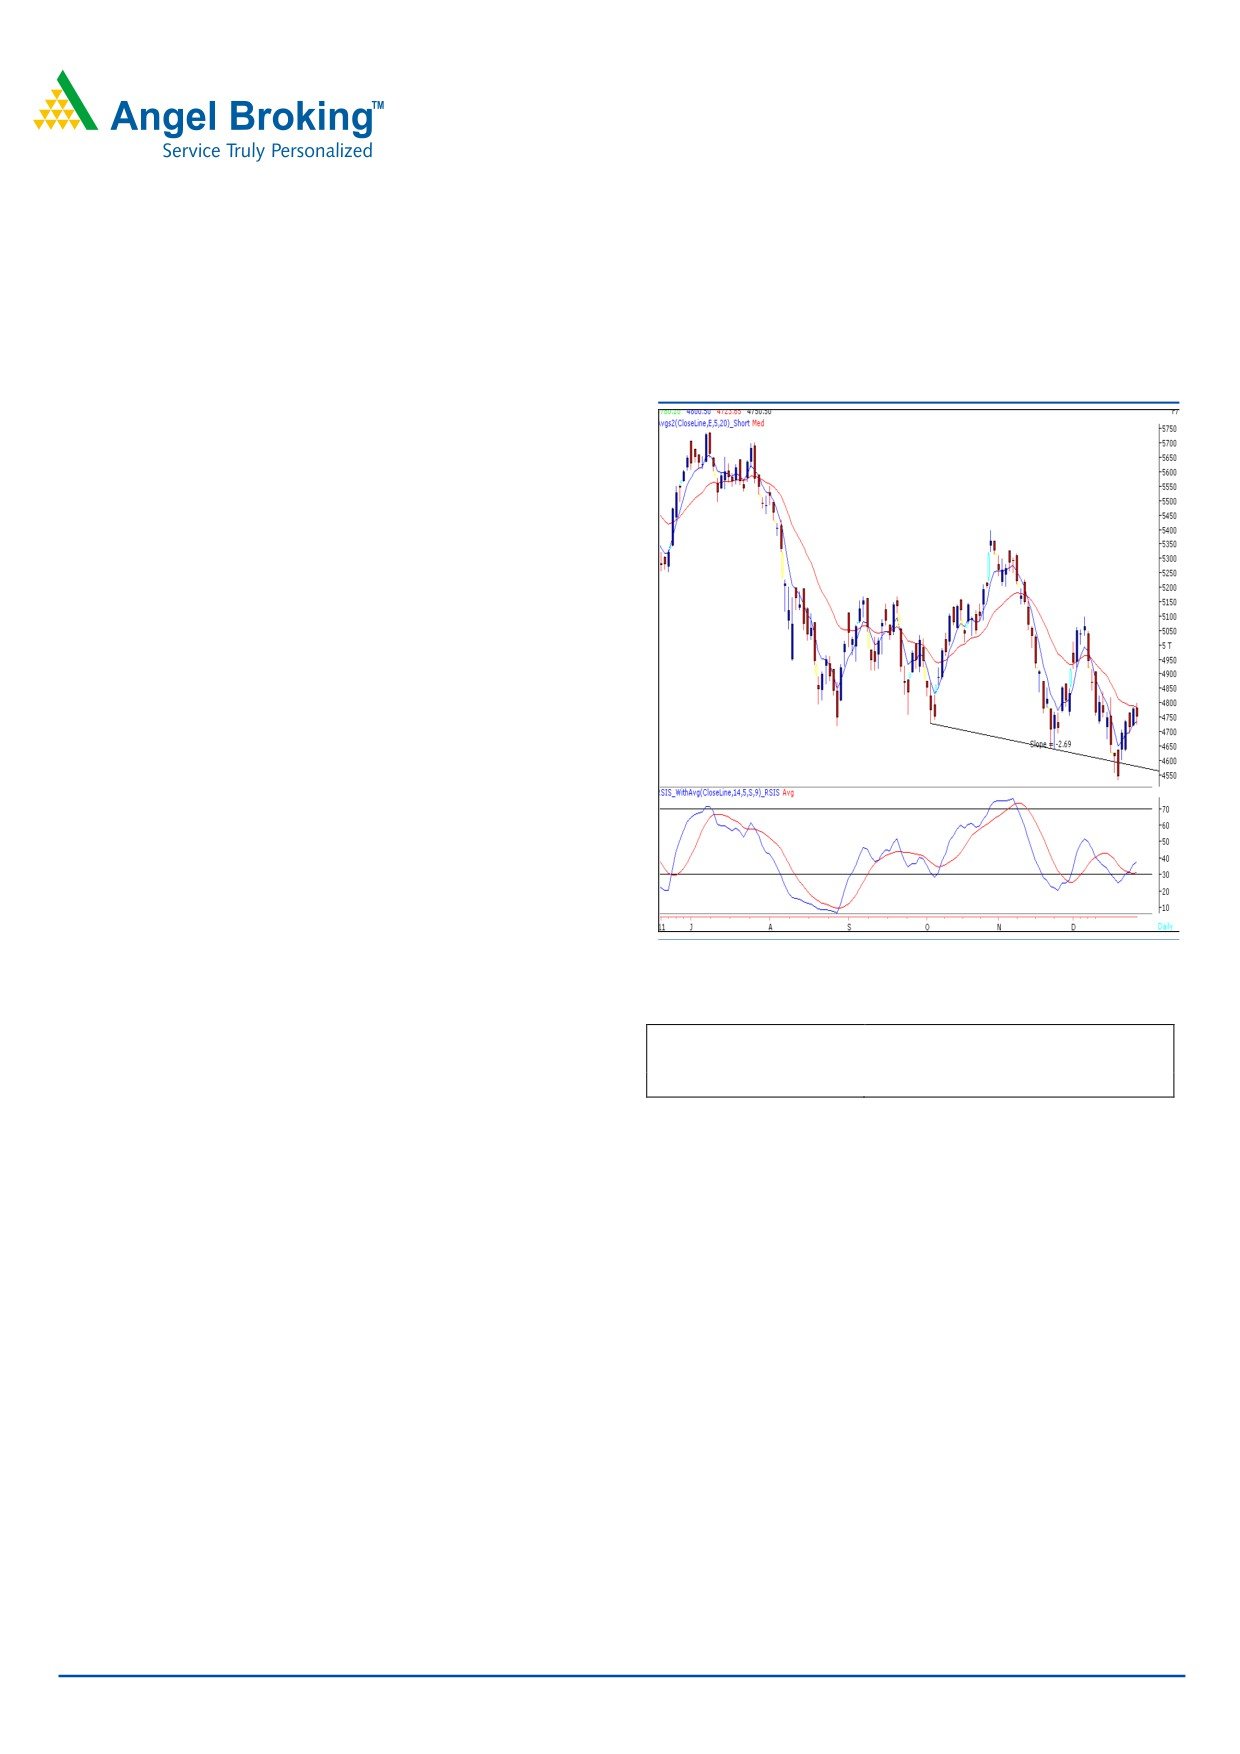
Sensex (15874) / NIFTY (4751)
Exhibit 1: Nifty Daily Chart
Yesterday, markets opened on a flat note and retested the
20 Day EMA during the initial trade of the session.
However, selling pressure during the second half dragged
indices to close in the negative territory. On the sectoral
front, Realty, Metal and Banking sectors were among the
major losers. The advance to decline ratio was in favor of
declining counters. (A=1177 D=1481).
(Source
-
Formation
• We are witnessing a positive crossover in “RSI
-
Smoothened” oscillator.
• The 20 EMA on the daily chart is placed at 16020 /
4800 level.
• The Daily chart exhibits a “Narrow Range” body
formation.
Source: Falcon
Actionable points:
Trading strategy:
View
Neutral
As expected and mentioned in our previous report, 16020 -
Resistance levels
4800 - 4820
Support levels
4723 - 4693 - 4665
16070 / 4800 - 4820 levels acted as stiff resistance for the
markets. This resistance zone also coincides with 20 Day
EMA. After a flat opening, indices moved towards this
resistance zone and then corrected to close well below the
20 day EMA. We are now observing a “Narrow Range”
body formation on the Daily chart. This indicates uncertainty
among the bulls and the bears. Thus, if indices sustain
below yesterday’s low of 15799 / 4723, then they are likely
to drift towards 15671 - 15592 / 4693 - 4665 levels.
Conversely, the positive crossover in “RSI - Smoothened” is
still intact. This impact of this crossover would be witnessed
if Indices manage to sustain above upper range of the
resistance zone i.e. 16070 / 4820. In this case, indices are
likely to move towards 16286 - 16421/ 4881 - 4920
levels.
For Private Circulation Only |
1
Technical Research | December 28, 2011
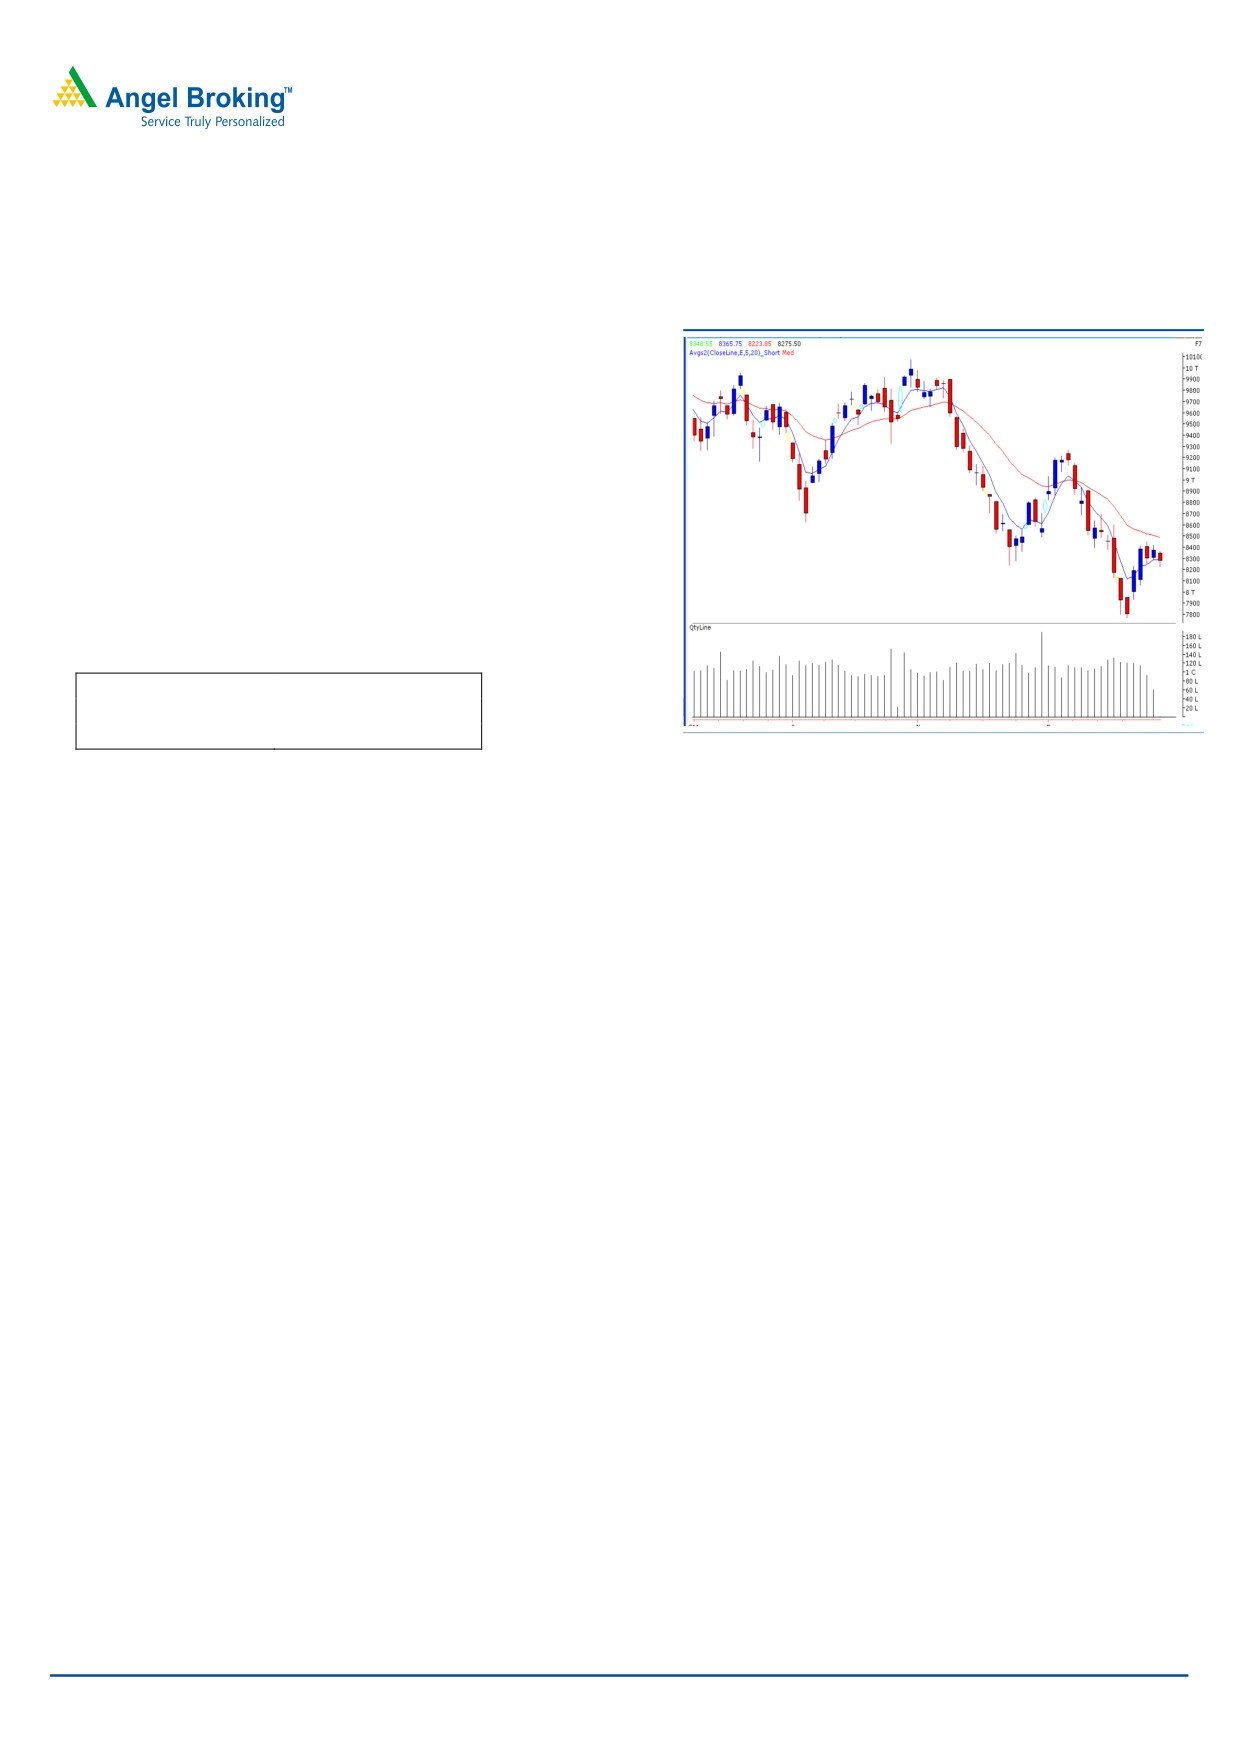
Bank Nifty Outlook - (8296)
Exhibit 2: Bank Nifty Daily Chart
Yesterday, Bank Nifty opened on a flat note and traded
with negative bias throughout the day to close near the
mentioned support level of 8250.On the hourly chart, we
are witnessing negative crossover in “5 & 20 EMA”. This
suggests that if Bank Nifty sustains below yesterday’s low
of 8224 then it is likely to test the next support level of
8072. On the upside, 8360 - 8420 levels may act as
resistance in coming trading session.
Actionable points:
View
Neutral
Resistance Level
8360 - 8420
Support Level
8224 - 8072
Source: Falcon
For Private Circulation Only |
2
Technical Research | December 28, 2011
Positive Bias:
Expected
Stock Name
CMP
5 Day EMA
20 Day EMA
Remarks
Target
Ranbaxy
410.65
406
415.4
425
View will change below 394
Negative Bias:
Expected
Stock Name
CMP
5 Day EMA
20 Day EMA
Remarks
Target
Arvind Ltd.
69.75
71.7
77.6
66
View will change above 73.7
For Private Circulation Only |
3
Technical Research | December 28, 2011
Daily Pivot Levels for Nifty 50 Stocks
SCRIPS
S2
S1
PIVOT
R1
R2
SENSEX
15,658
15,766
15,908
16,016
16,157
NIFTY
4,681
4,716
4,758
4,793
4,835
BANKNIFTY
8,146
8,211
8,288
8,353
8,430
ACC
1,149
1,162
1,171
1,184
1,194
AMBUJACEM
159
161
162
164
166
AXISBANK
820
832
853
865
886
BAJAJ-AUTO
1,587
1,606
1,620
1,640
1,654
BHARTIARTL
336
340
344
347
352
BHEL
233
237
242
246
250
BPCL
493
498
504
510
516
CAIRN
317
320
324
327
331
CIPLA
313
317
322
326
332
DLF
185
188
193
197
202
DRREDDY
1,566
1,573
1,582
1,590
1,599
GAIL
382
389
394
401
406
HCLTECH
386
389
391
394
397
HDFC
658
663
667
672
676
HDFCBANK
432
436
440
444
448
HEROMOTOCO
1,871
1,888
1,912
1,929
1,953
HINDALCO
117
118
120
122
124
HINDUNILVR
412
415
417
420
422
ICICIBANK
715
720
727
733
740
IDFC
93
95
98
100
103
INFY
2,702
2,731
2,765
2,794
2,828
ITC
201
203
204
207
208
JINDALSTEL
481
485
490
495
499
JPASSOCIAT
52
53
54
55
56
KOTAKBANK
441
447
456
462
471
LT
1,003
1,016
1,033
1,045
1,062
M&M
684
694
703
712
721
MARUTI
937
950
965
978
993
NTPC
152
155
158
160
164
ONGC
258
261
262
264
266
PNB
797
803
809
815
821
POWERGRID
95
97
99
101
103
RANBAXY
391
401
407
417
423
RCOM
70
71
73
74
75
RELCAPITAL
241
247
253
259
265
RELIANCE
732
743
756
766
779
RELINFRA
356
363
371
378
386
RPOWER
69
71
73
75
77
SAIL
78
79
80
81
82
SBIN
1,613
1,628
1,649
1,664
1,684
SESAGOA
155
159
163
166
170
SIEMENS
637
651
660
675
684
STER
88
90
92
94
96
SUNPHARMA
489
494
502
507
515
SUZLON
18
19
19
20
20
TATAMOTORS
178
180
183
185
189
TATAPOWER
88
89
90
92
92
TATASTEEL
340
344
352
357
364
TCS
1,160
1,170
1,180
1,190
1,200
WIPRO
400
403
408
411
415
Technical Research Team
For Private Circulation Only |
4
Technical Report
RESEARCH TEAM
Shardul Kulkarni
Head - Technicals
Sameet Chavan
Technical Analyst
Sacchitanand Uttekar
Technical Analyst
Mehul Kothari
Technical Analyst
Ankur Lakhotia
Technical Analyst
Research Team: 022-3952 6600
DISCLAIMER: This document is not for public distribution and has been furnished to you solely for your information and must not
be reproduced or redistributed to any other person. Persons into whose possession this document may come are required to observe
these restrictions.
Opinion expressed is our current opinion as of the date appearing on this material only. While we endeavor to update on a
reasonable basis the information discussed in this material, there may be regulatory, compliance, or other reasons that prevent us
from doing so. Prospective investors and others are cautioned that any forward-looking statements are not predictions and may be
subject to change without notice. Our proprietary trading and investment businesses may make investment decisions that are
inconsistent with the recommendations expressed herein.
The information in this document has been printed on the basis of publicly available information, internal data and other reliable
sources believed to be true and are for general guidance only. While every effort is made to ensure the accuracy and completeness of
information contained, the company takes no guarantee and assumes no liability for any errors or omissions of the information. No
one can use the information as the basis for any claim, demand or cause of action.
Recipients of this material should rely on their own investigations and take their own professional advice. Each recipient of this
document should make such investigations as it deems necessary to arrive at an independent evaluation of an investment in the
securities of companies referred to in this document (including the merits and risks involved), and should consult their own advisors to
determine the merits and risks of such an investment. Price and value of the investments referred to in this material may go up or
down. Past performance is not a guide for future performance. Certain transactions - futures, options and other derivatives as well as
non-investment grade securities - involve substantial risks and are not suitable for all investors. Reports based on technical analysis
centers on studying charts of a stock's price movement and trading volume, as opposed to focusing on a company's fundamentals
and as such, may not match with a report on a company's fundamentals.
We do not undertake to advise you as to any change of our views expressed in this document. While we would endeavor to update
the information herein on a reasonable basis, Angel Broking, its subsidiaries and associated companies, their directors and
employees are under no obligation to update or keep the information current. Also there may be regulatory, compliance, or other
reasons that may prevent Angel Broking and affiliates from doing so. Prospective investors and others are cautioned that any
forward-looking statements are not predictions and may be subject to change without notice.
Angel Broking Limited and affiliates, including the analyst who has issued this report, may, on the date of this report, and from time
to time, have long or short positions in, and buy or sell the securities of the companies mentioned herein or engage in any other
transaction involving such securities and earn brokerage or compensation or act as advisor or have other potential conflict of interest
with respect to company/ies mentioned herein or inconsistent with any recommendation and related information and opinions.
Angel Broking Limited and affiliates may seek to provide or have engaged in providing corporate finance, investment banking or
other advisory services in a merger or specific transaction to the companies referred to in this report, as on the date of this report or
in the past.
Sebi Registration No : INB 010996539
For Private Circulation Only |