Daily Technical Report
June 28, 2012
Sensex (16968) / NIFTY (5142)
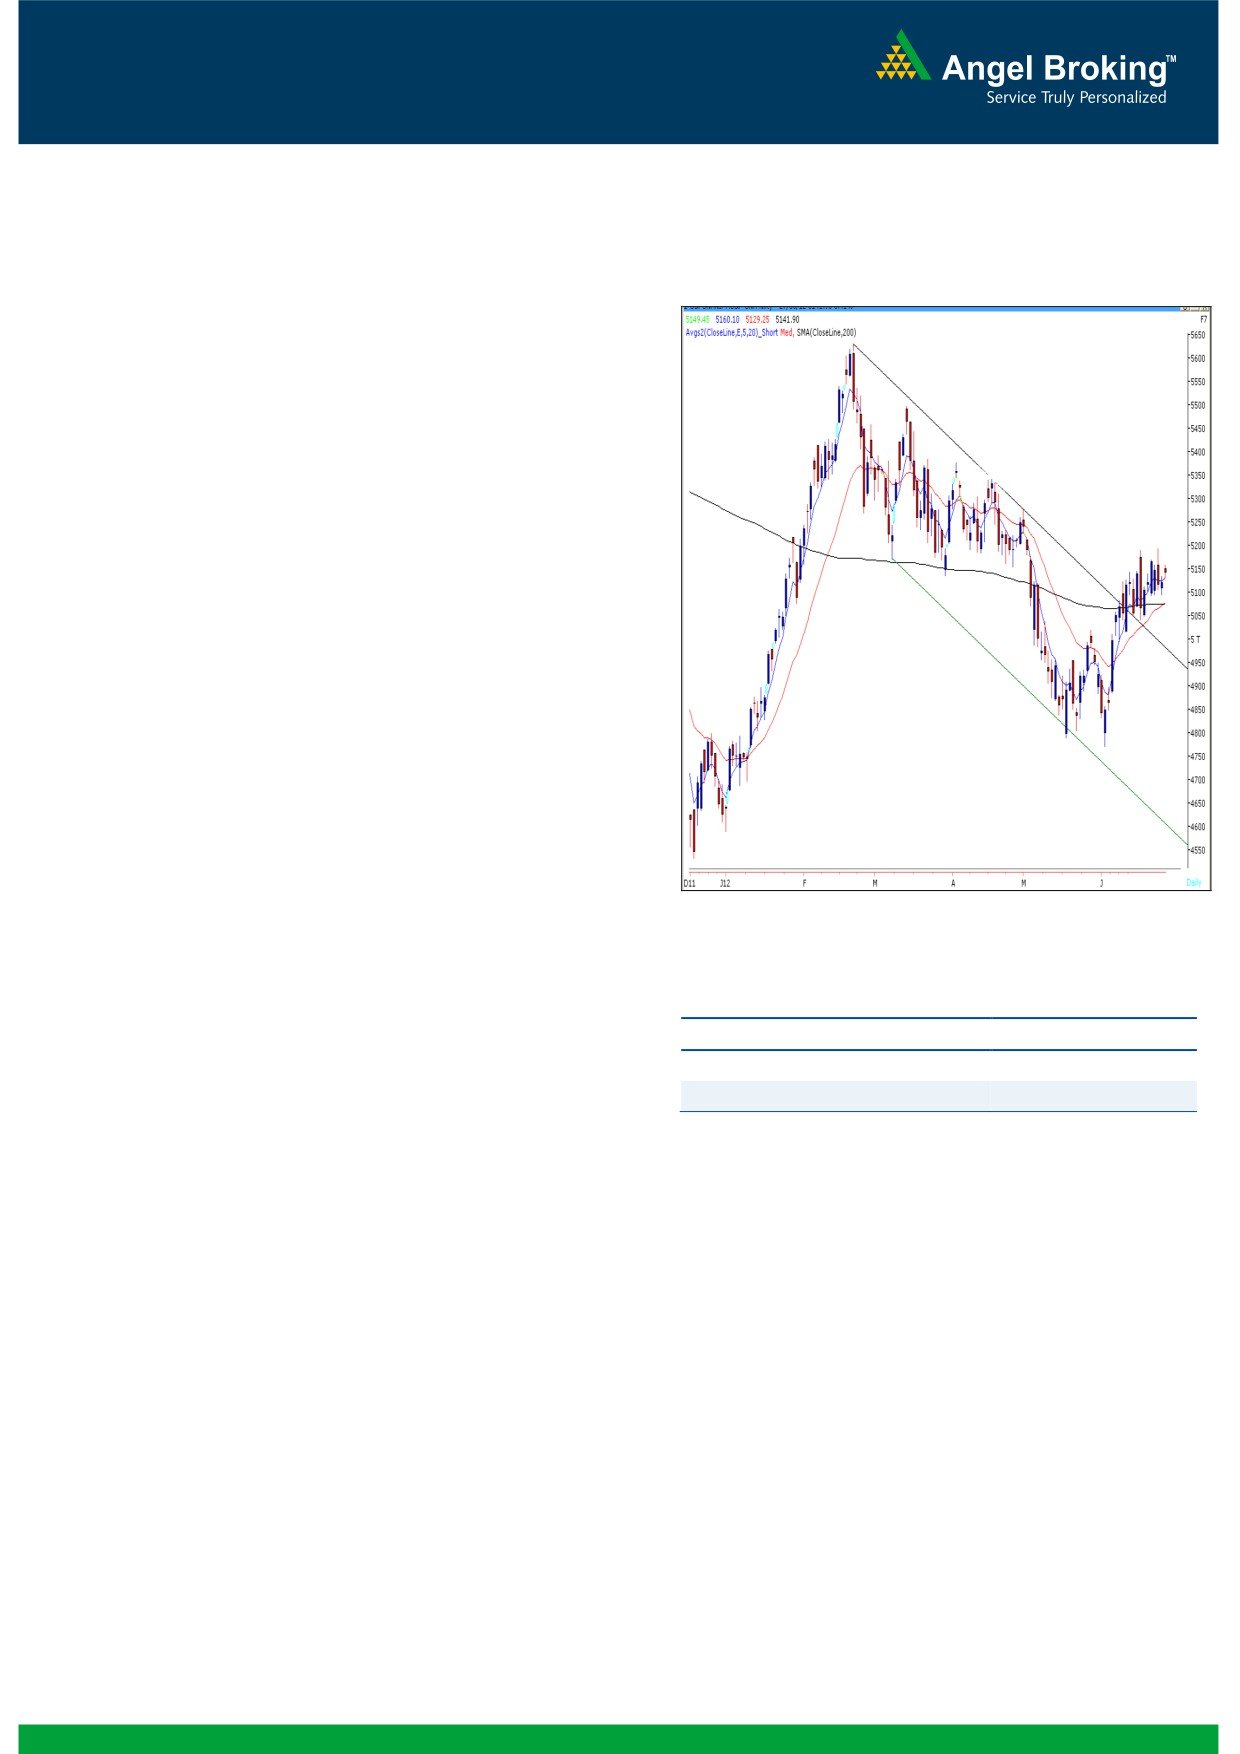
Exhibit 1: Nifty Daily Chart
Yesterday, our benchmark indices opened marginally
higher on the back of positive cues from some Asian
bourses. Subsequently, indices moved in a narrow
range throughout the session to eventually close
marginally in the green. On sectoral front, Oil & Gas,
Power and PSU stocks bounced during yesterday’s
session; whereas Consumer Durables and FMCG
sectors remained under pressure. The advance to
decline ratio was marginally in favor of advancing
counters
(A=1380
D=1346 (Source
-
Formation
The 200-day SMA (Simple Moving Average) and
20-day EMA (Exponential Moving Average) have
now shifted to 16803 / 5075 and 16691 /
5061, respectively.
The ‘20-Week EMA’ is placed at 16854 / 5108
level.
On the daily chart, indices are trading well
above the upper range of ‘Downward Sloping
Source: Falcon
Channel’ drawn by joining two highs of February
Actionable points:
22, 2012 - April 19, 2012 and low of March 7,
2012.
View
Bullish Above 5160
The positive crossover in weekly ‘RSI’ momentum
oscillator and weekly ‘3 & 8 EMA’ is still intact.
Expected Target
5195
Also, the weekly ‘RSI-Smoothened’ is now
Support Levels
5093 - 5041 - 5015
positively poised.
Today’s session is likely to trade with some volatility
Trading strategy:
and choppiness due to June series derivatives expiry.
Hence, traders are advised to trade with cautious
In-line with other global indices, our markets too
approach.
opened marginally higher and traded with positive
bias throughout the session; the movement witnessed
was extremely lackluster although overall volumes
surged on account of derivative expiry. Our view
remains unchanged as the trading range is still intact.
The crucial support remains at 16799 / 5093. Only a
sustainable move below this level may reinforce
selling pressure and indices may then correct towards
16553 - 16636 / 5041 - 5015 levels. On the upside,
17030 - 17131 / 5160 - 5195 levels are likely to act
as immediate intraday resistance in coming trading
session.
1
Daily Technical Report
June 28, 2012
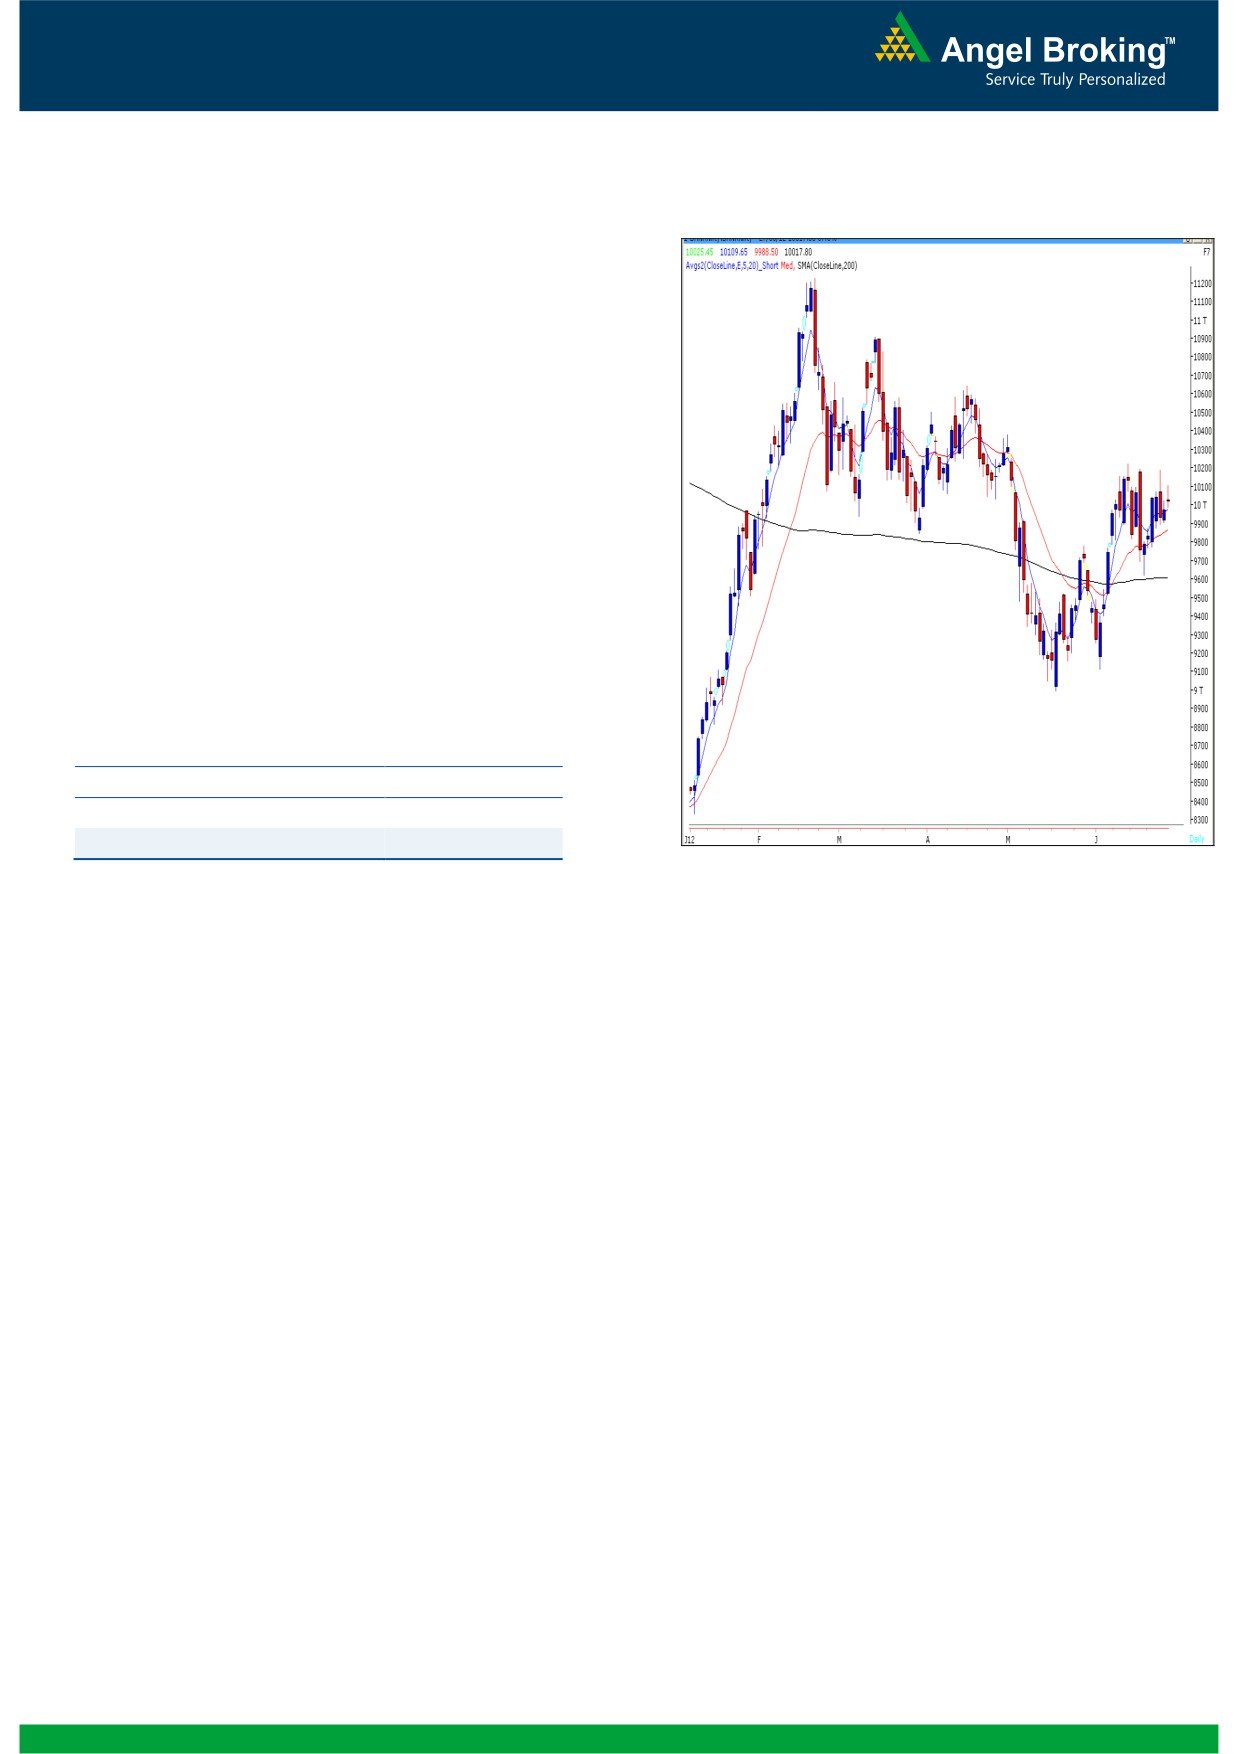
Exhibit 2: Bank Nifty Daily Chart
Bank Nifty Outlook - (10018)
Yesterday, Bank Nifty opened with an upside gap in
line with our benchmark indices and traded in a
narrow range throughout the session. There is no
significant change in the chart formation for Bank
Nifty except for the formation of a “Doji” candlestick
pattern, which represents the indecisiveness prevailing
at current levels. Hence, we reiterate our view that the
index is likely to trade in the range of 9760 - 10230.
Only a sustainable move outside the said range will
dictate a clear direction of the trend. Within the
mentioned range 10130 - 10170 is likely to act as
resistance and 9873 - 9800 is likely to act as support
in coming trading session. Positional traders holding
long positions can hold with a stop loss of 9800 level
(Closing basis) on Bank Nifty spot.
Actionable points:
View
Neutral
Resistance Levels
10080 - 10130
Support Levels
9873 - 9800
Source: Falcon
2
Daily Technical Report
June 28, 2012
Daily Pivot Levels for Nifty 50 Stocks
SCRIPS
S2
S1
PIVOT
R1
R2
SENSEX
16,877
16,923
16,976
17,021
17,074
NIFTY
5,113
5,127
5,144
5,158
5,175
BANKNIFTY
9,918
9,968
10,039
10,089
10,160
ACC
1,187
1,196
1,213
1,222
1,239
AMBUJACEM
167
169
171
172
175
ASIANPAINT
3,743
3,760
3,778
3,795
3,813
AXISBANK
987
994
1,005
1,012
1,023
BAJAJ-AUTO
1,543
1,551
1,560
1,568
1,577
BANKBARODA
709
713
716
720
724
BHARTIARTL
300
303
305
308
310
BHEL
218
219
221
222
223
BPCL
739
745
749
754
759
CAIRN
318
322
328
332
338
CIPLA
303
306
308
311
313
COALINDIA
336
340
342
345
348
DLF
189
191
192
194
195
DRREDDY
1,593
1,601
1,608
1,616
1,623
GAIL
350
352
356
358
362
GRASIM
2,424
2,493
2,591
2,660
2,757
HCLTECH
456
463
467
474
478
HDFC
640
642
645
648
651
HDFCBANK
541
545
550
554
559
HEROMOTOCO
2,028
2,042
2,056
2,070
2,085
HINDALCO
115
116
117
118
119
HINDUNILVR
446
449
452
455
458
ICICIBANK
842
847
855
860
868
IDFC
130
132
134
137
139
INFY
2,437
2,453
2,464
2,479
2,490
ITC
246
247
248
249
251
JINDALSTEL
425
428
431
434
437
JPASSOCIAT
67
68
70
71
72
KOTAKBANK
553
562
573
582
594
LT
1,331
1,339
1,352
1,360
1,373
M&M
677
685
693
701
709
MARUTI
1,103
1,112
1,118
1,127
1,133
NTPC
153
154
155
156
158
ONGC
271
274
276
280
282
PNB
775
780
785
790
795
POWERGRID
108
109
110
111
112
RANBAXY
481
484
488
491
495
RELIANCE
712
717
723
729
735
RELINFRA
535
540
546
551
557
SAIL
87
88
89
89
90
SBIN
2,083
2,098
2,118
2,133
2,153
SESAGOA
183
187
190
194
197
SIEMENS
697
702
710
715
723
STER
97
99
99
101
101
SUNPHARMA
611
617
622
628
633
TATAMOTORS
231
235
242
246
253
TATAPOWER
96
97
98
99
101
TATASTEEL
408
415
418
424
428
TCS
1,225
1,236
1,247
1,258
1,270
WIPRO
394
397
401
403
407
3
Daily Technical Report
June 28, 2012
Research Team Tel: 022 - 39357800
DISCLAIMER
This document is solely for the personal information of the recipient, and must not be singularly used as the basis of any investment
decision. Nothing in this document should be construed as investment or financial advice. Each recipient of this document should make
such investigations as they deem necessary to arrive at an independent evaluation of an investment in the securities of the companies
referred to in this document (including the merits and risks involved), and should consult their own advisors to determine the merits and
risks of such an investment.
Angel Broking Limited, its affiliates, directors, its proprietary trading and investment businesses may, from time to time, make
investment decisions that are inconsistent with or contradictory to the recommendations expressed herein. The views contained in this
document are those of the analyst, and the company may or may not subscribe to all the views expressed within.
Reports based on technical and derivative analysis center on studying charts of a stock's price movement, outstanding positions and
trading volume, as opposed to focusing on a company's fundamentals and, as such, may not match with a report on a company's
fundamentals.
The information in this document has been printed on the basis of publicly available information, internal data and other reliable
sources believed to be true, but we do not represent that it is accurate or complete and it should not be relied on as such, as this
document is for general guidance only. Angel Broking Limited or any of its affiliates/ group companies shall not be in any way
responsible for any loss or damage that may arise to any person from any inadvertent error in the information contained in this report.
Angel Broking Limited has not independently verified all the information contained within this document. Accordingly, we cannot testify,
nor make any representation or warranty, express or implied, to the accuracy, contents or data contained within this document. While
Angel Broking Limited endeavours to update on a reasonable basis the information discussed in this material, there may be regulatory,
compliance, or other reasons that prevent us from doing so.
This document is being supplied to you solely for your information, and its contents, information or data may not be reproduced,
redistributed or passed on, directly or indirectly.
Angel Broking Limited and its affiliates may seek to provide or have engaged in providing corporate finance, investment banking or
other advisory services in a merger or specific transaction to the companies referred to in this report, as on the date of this report or in
the past.
Neither Angel Broking Limited, nor its directors, employees or affiliates shall be liable for any loss or damage that may arise from or in
connection with the use of this information.
Note: Please refer to the important `Stock Holding Disclosure' report on the Angel website (Research Section). Also, please refer to the
latest update on respective stocks for the disclosure status in respect of those stocks. Angel Broking Limited and its affiliates may have
investment positions in the stocks recommended in this report.
Research Team
Shardul Kulkarni
-
Head - Technicals
Sameet Chavan
-
Technical Analyst
Sacchitanand Uttekar
-
Technical Analyst
Mehul Kothari
-
Technical Analyst
Ankur Lakhotia
-
Technical Analyst
Angel Broking Pvt. Ltd.
Registered Office: G-1, Ackruti Trade Centre, Rd. No. 7, MIDC, Andheri (E), Mumbai - 400 093.
Corporate Office: 6th Floor, Ackruti Star, MIDC, Andheri (E), Mumbai - 400 093. Tel: (022) 3952 6600
Sebi Registration No: INB 010996539
4