Daily Technical Report
May 28, 2012
Sensex (16218) / NIFTY (4921)
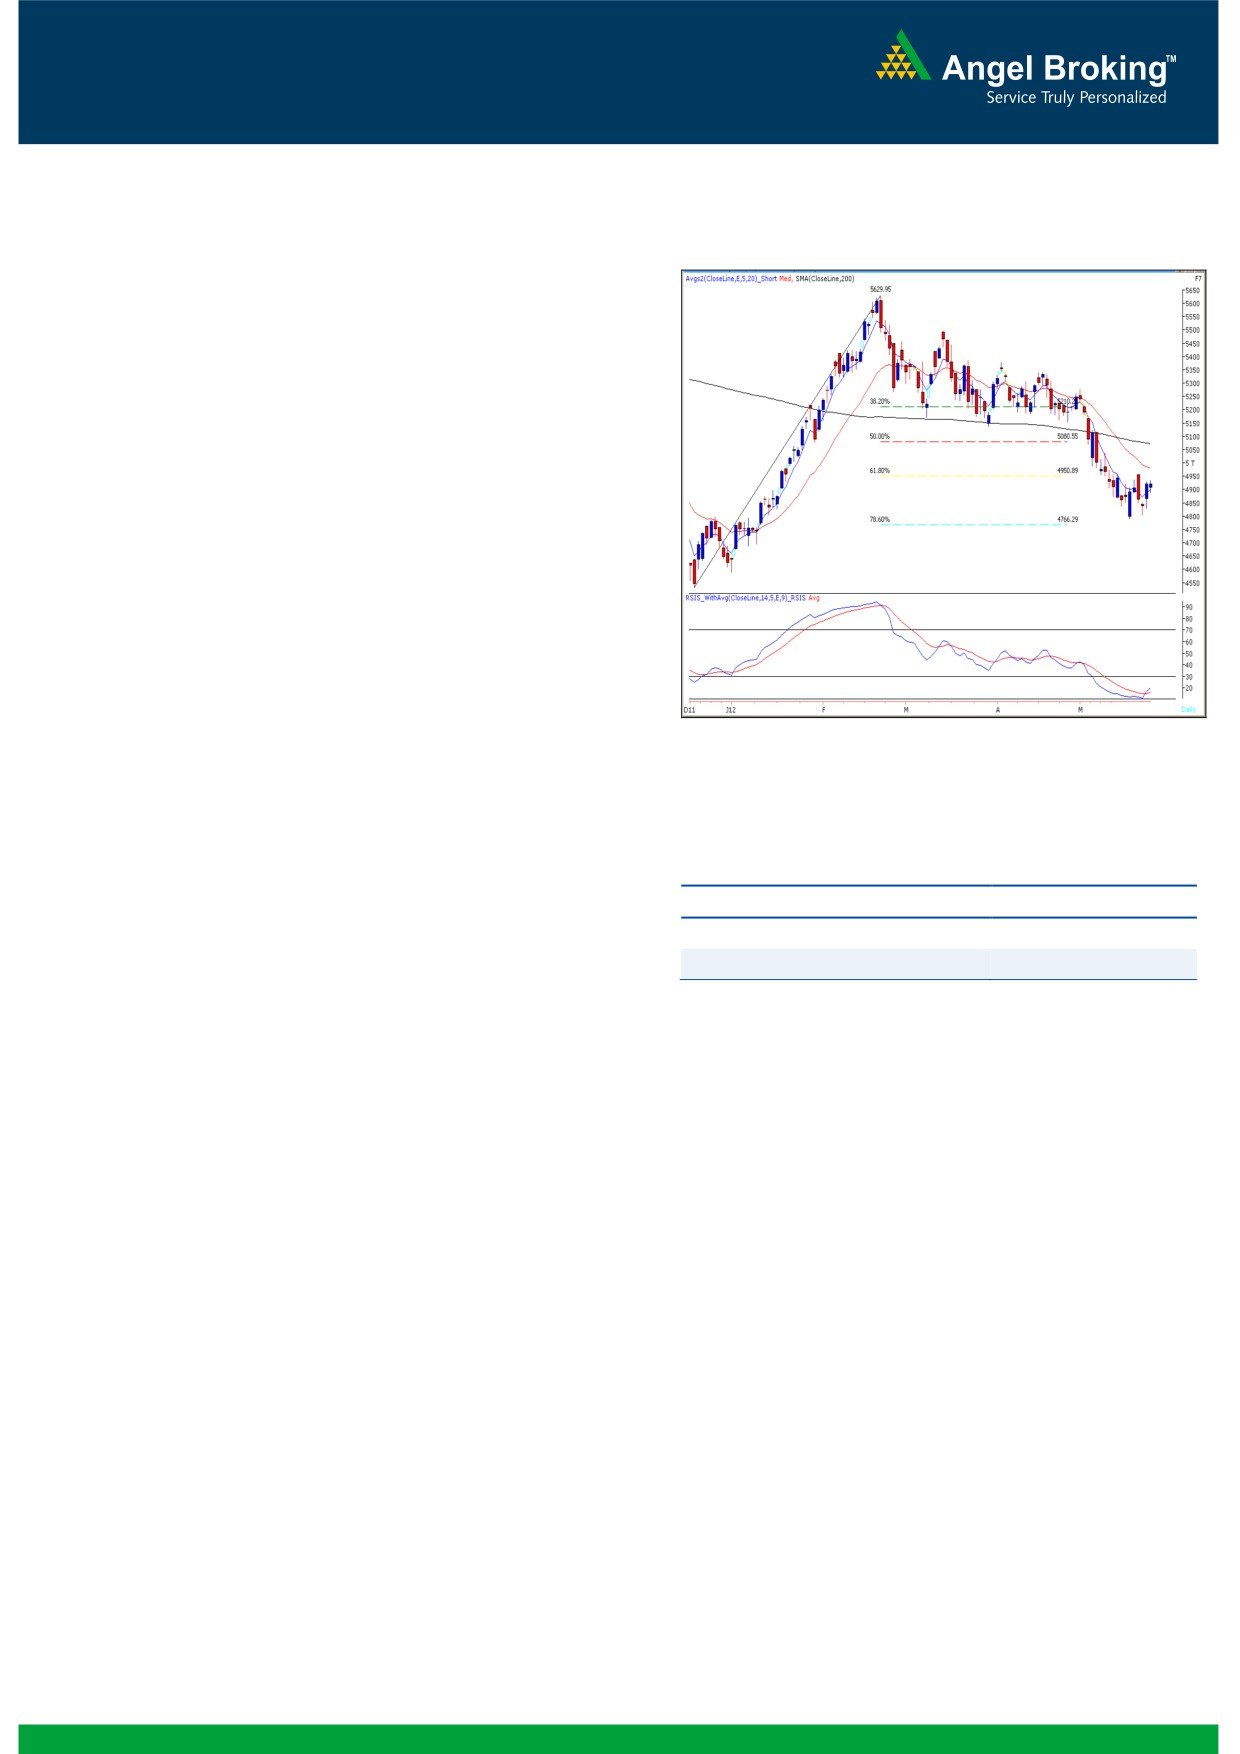
Exhibit 1: Nifty Daily Chart
On Friday, our benchmark indices opened on a flat
note and traded in a narrow range throughout the
day to close marginally in red. On sectoral front,
Metal, Consumer Durables and Realty counters were
among the major gainers; whereas FMCG, Consumer
Durables and Healthcare counters ended on a losing
side. The advance to decline ratio was in favor of
advancing counters (A=1477 D=1242) (Source -
Formation
The 200-day SMA (Simple Moving Average) and
20-day EMA (Exponential Moving Average) have
now shifted to 16800 / 5070 and 16430 /
4975, respectively.
Source: Falcon
The ‘20-Week EMA’ is placed at 16930 / 5130
level.
Indices have taken a support near 15860 /
4766 level, which is the
78.6% Fibonacci
Actionable points:
Retracement level of the rise from 15135 / 4531
View
Positive above 4957
(Low on December 23, 2011) to 18524 / 5630
Expected Targets
4986 - 5050
(High on February 22, 2012).
Support Levels
4850 - 4800
The daily ‘RSI - Smoothened’ oscillator has now
signaled a positive crossover in the oversold
territory
The candlestick pattern on the weekly chart
Therefore,
these
patterns
hold immense
represents another bullish “Hammer”.
significance. The said patterns will be confirmed
once indices sustain above the high of 16391 /
4957. In this scenario, indices are likely to move
Trading strategy:
towards 16700 - 16840 / 5050 - 5090 levels,
which coincide with the
‘200-day SMA”.
Broadly speaking, markets are still trading within the
Conversely, we continue to maintain our view that
range of 16390 to 15809 / 4957 to 4767. We are
the swing low of 15809 / 4789 is likely to act as a
now observing a positive crossover in daily ‘RSI-
decent support in coming trading sessions. A
Smoothened’ oscillator in the oversold territory. This
violation of this level would clearly increase the
indicates loss of negative momentum and high
chances of a further fall and, as a result indices
probability of a bounce. The weekly chart depicts two
may slide towards
15678
/
4695 level.
‘Bullish Hammer’ Japanese candlestick patterns next
to each other. These patterns have formed near the
78.6% Fibonacci Retracement level of the rise from
15135 / 4531 (Low on December 23, 2011) to
18524 / 5630 (High on February 22, 2012).
1
Daily Technical Report
May 28, 2012
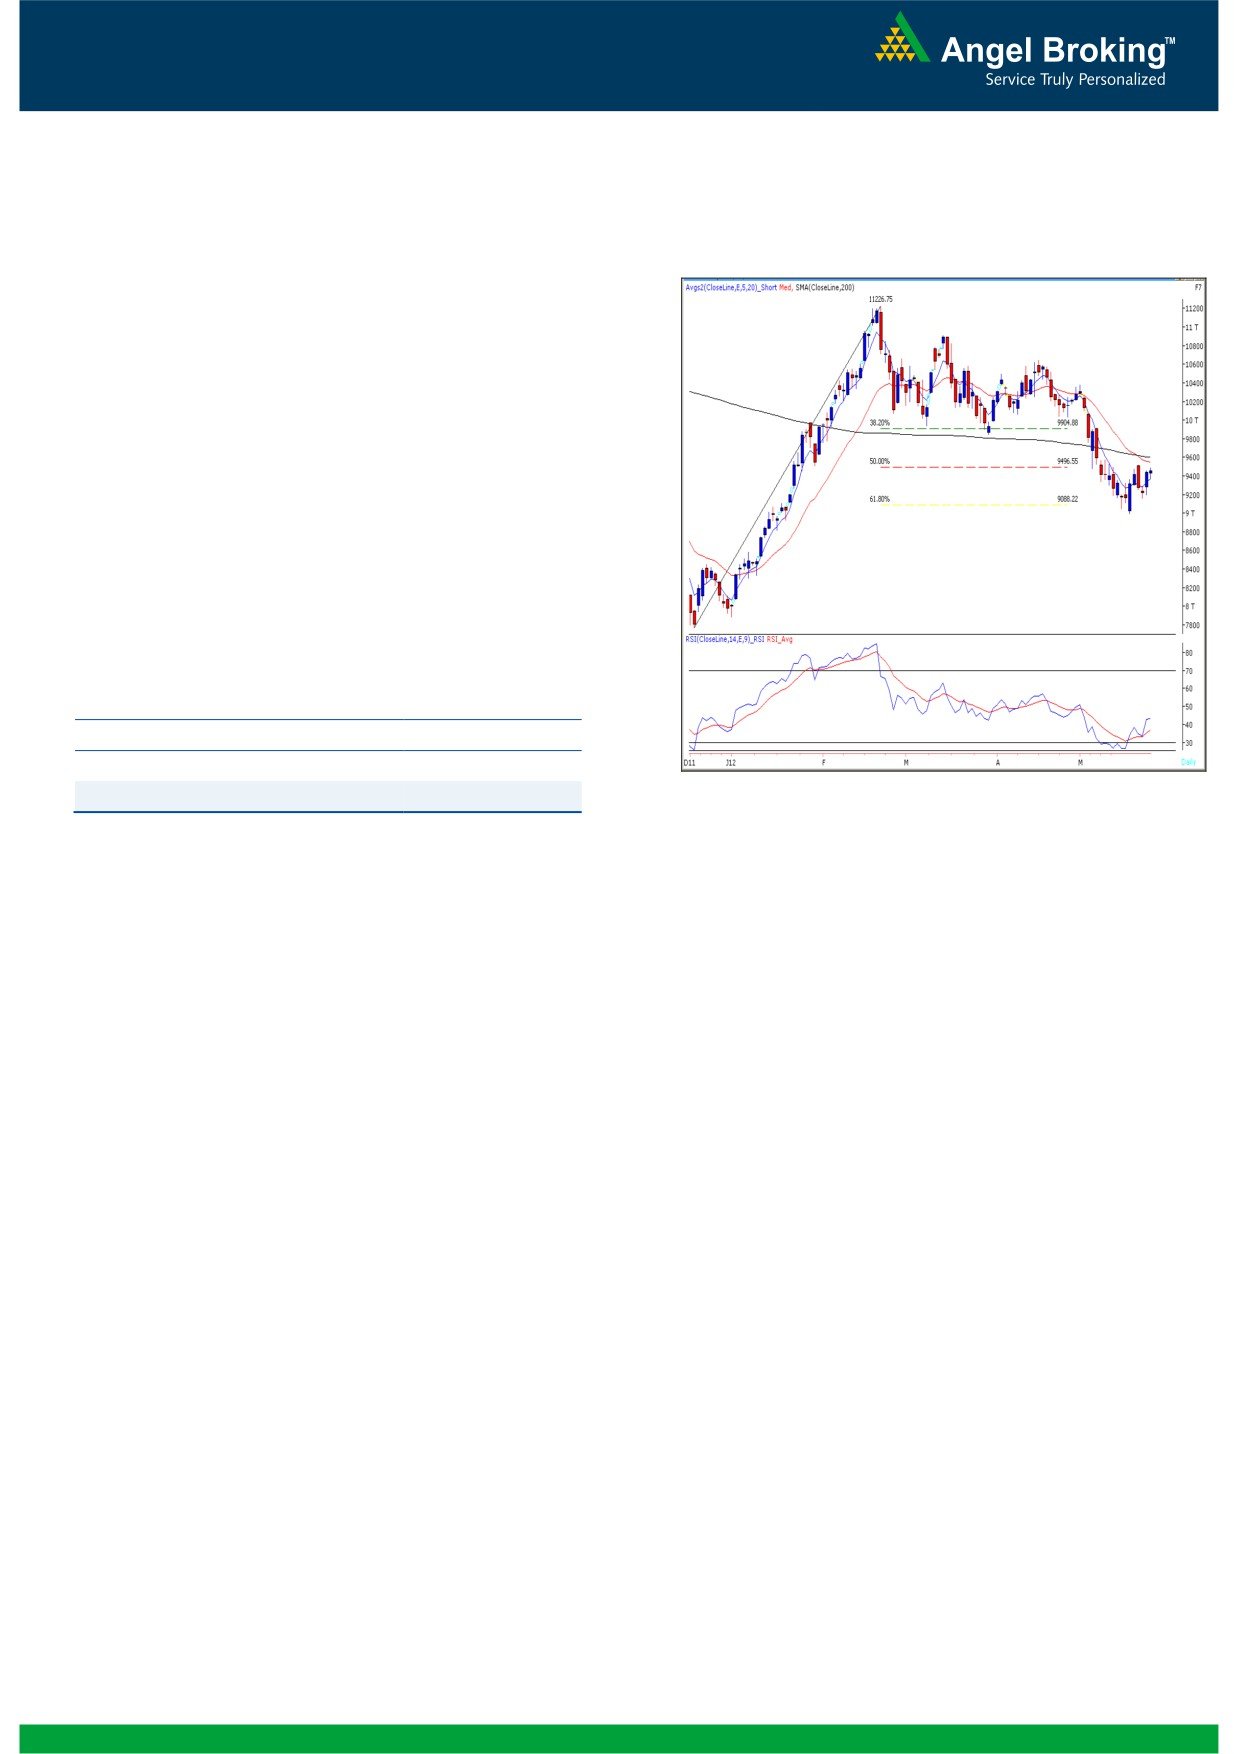
Bank Nifty Outlook - (9456)
In line with the Benchmark Indices, Bank Nifty opened
Exhibit 2: Bank Nifty Daily Chart
on a flat note and traded in a narrow range in
Friday’s session. As mentioned in our previous report
the resistance zone of 9525 - 9605 acted as a strong
resistance and still holds good. On the daily chart we
are observing a “Spinning Top” candlestick pattern,
which is a sign of indecisiveness prevailing at current
levels. The momentum oscillators on the daily chart
continue with their buy signal. Going forward we
reiterate our view that only a move above the
resistance zone 9525 - 9605 levels, will signal further
upside and the Index is then likely to test 9700. On
the downside 9370 - 9270 levels are likely to act as
support in coming trading session.
Actionable points:
View
Neutral
Resistance Levels
9525 - 9605
Source: Falcon
Support Levels
9370 - 9270
2
Daily Technical Report
May 28, 2012
Daily Pivot Levels for Nifty 50 Stocks
SCRIPS
S2
S1
PIVOT
R1
R2
SENSEX
16,048
16,133
16,203
16,288
16,358
NIFTY
4,869
4,895
4,915
4,941
4,962
BANKNIFTY
9,316
9,386
9,442
9,512
9,567
ACC
1,128
1,136
1,146
1,155
1,165
AMBUJACEM
139
141
143
145
147
ASIANPAINT
3,689
3,727
3,754
3,792
3,818
AXISBANK
982
991
1,002
1,011
1,021
BAJAJ-AUTO
1,456
1,474
1,500
1,518
1,544
BANKBARODA
653
663
675
684
696
BHARTIARTL
294
296
300
302
306
BHEL
205
206
209
210
212
BPCL
703
717
729
743
756
CAIRN
310
317
321
328
332
CIPLA
305
307
309
311
313
COALINDIA
305
309
312
316
319
DLF
182
185
187
191
193
DRREDDY
1,659
1,675
1,690
1,706
1,720
GAIL
316
327
334
344
351
GRASIM
2,329
2,352
2,375
2,398
2,421
HCLTECH
480
483
486
490
493
HDFC
645
651
657
663
669
HDFCBANK
492
496
500
504
507
HEROMOTOCO
1,795
1,818
1,833
1,856
1,871
HINDALCO
106
109
111
114
116
HINDUNILVR
415
418
422
425
429
ICICIBANK
796
805
815
824
834
IDFC
122
124
125
126
127
INFY
2,336
2,354
2,370
2,388
2,404
ITC
228
230
233
235
238
JINDALSTEL
445
451
460
466
475
JPASSOCIAT
59
60
61
62
63
KOTAKBANK
533
538
544
549
555
LT
1,146
1,167
1,180
1,201
1,214
M&M
627
632
642
648
657
MARUTI
1,085
1,102
1,126
1,143
1,167
NTPC
140
141
142
143
144
ONGC
249
253
256
260
264
PNB
715
721
727
732
738
POWERGRID
103
104
104
105
106
RANBAXY
512
521
529
538
547
RELIANCE
685
688
692
695
698
RELINFRA
440
452
462
474
484
SAIL
89
91
92
94
95
SBIN
1,929
1,968
1,993
2,032
2,057
SESAGOA
175
178
181
184
186
SIEMENS
663
676
686
699
709
STER
93
95
96
98
100
SUNPHARMA
561
565
572
576
583
TATAMOTORS
258
264
268
273
277
TATAPOWER
87
88
89
90
91
TATASTEEL
391
400
405
414
420
TCS
1,202
1,212
1,218
1,228
1,234
WIPRO
385
390
393
397
401
3
Daily Technical Report
May 28, 2012
Research Team Tel: 022 - 39357800
DISCLAIMER
This document is solely for the personal information of the recipient, and must not be singularly used as the basis of any investment
decision. Nothing in this document should be construed as investment or financial advice. Each recipient of this document should make
such investigations as they deem necessary to arrive at an independent evaluation of an investment in the securities of the companies
referred to in this document (including the merits and risks involved), and should consult their own advisors to determine the merits and
risks of such an investment.
Angel Broking Limited, its affiliates, directors, its proprietary trading and investment businesses may, from time to time, make
investment decisions that are inconsistent with or contradictory to the recommendations expressed herein. The views contained in this
document are those of the analyst, and the company may or may not subscribe to all the views expressed within.
Reports based on technical and derivative analysis center on studying charts of a stock's price movement, outstanding positions and
trading volume, as opposed to focusing on a company's fundamentals and, as such, may not match with a report on a company's
fundamentals.
The information in this document has been printed on the basis of publicly available information, internal data and other reliable
sources believed to be true, but we do not represent that it is accurate or complete and it should not be relied on as such, as this
document is for general guidance only. Angel Broking Limited or any of its affiliates/ group companies shall not be in any way
responsible for any loss or damage that may arise to any person from any inadvertent error in the information contained in this report.
Angel Broking Limited has not independently verified all the information contained within this document. Accordingly, we cannot testify,
nor make any representation or warranty, express or implied, to the accuracy, contents or data contained within this document. While
Angel Broking Limited endeavours to update on a reasonable basis the information discussed in this material, there may be regulatory,
compliance, or other reasons that prevent us from doing so.
This document is being supplied to you solely for your information, and its contents, information or data may not be reproduced,
redistributed or passed on, directly or indirectly.
Angel Broking Limited and its affiliates may seek to provide or have engaged in providing corporate finance, investment banking or
other advisory services in a merger or specific transaction to the companies referred to in this report, as on the date of this report or in
the past.
Neither Angel Broking Limited, nor its directors, employees or affiliates shall be liable for any loss or damage that may arise from or in
connection with the use of this information.
Note: Please refer to the important `Stock Holding Disclosure' report on the Angel website (Research Section). Also, please refer to the
latest update on respective stocks for the disclosure status in respect of those stocks. Angel Broking Limited and its affiliates may have
investment positions in the stocks recommended in this report.
Research Team
Shardul Kulkarni
-
Head - Technicals
Sameet Chavan
-
Technical Analyst
Sacchitanand Uttekar
-
Technical Analyst
Mehul Kothari
-
Technical Analyst
Ankur Lakhotia
-
Technical Analyst
Angel Broking Pvt. Ltd.
Registered Office: G-1, Ackruti Trade Centre, Rd. No. 7, MIDC, Andheri (E), Mumbai - 400 093.
Corporate Office: 6th Floor, Ackruti Star, MIDC, Andheri (E), Mumbai - 400 093. Tel: (022) 3952 6600
Sebi Registration No: INB 010996539
4