Technical Research | March 28, 2012
Daily Technical Report
Sensex (17257) / NIFTY (5243)
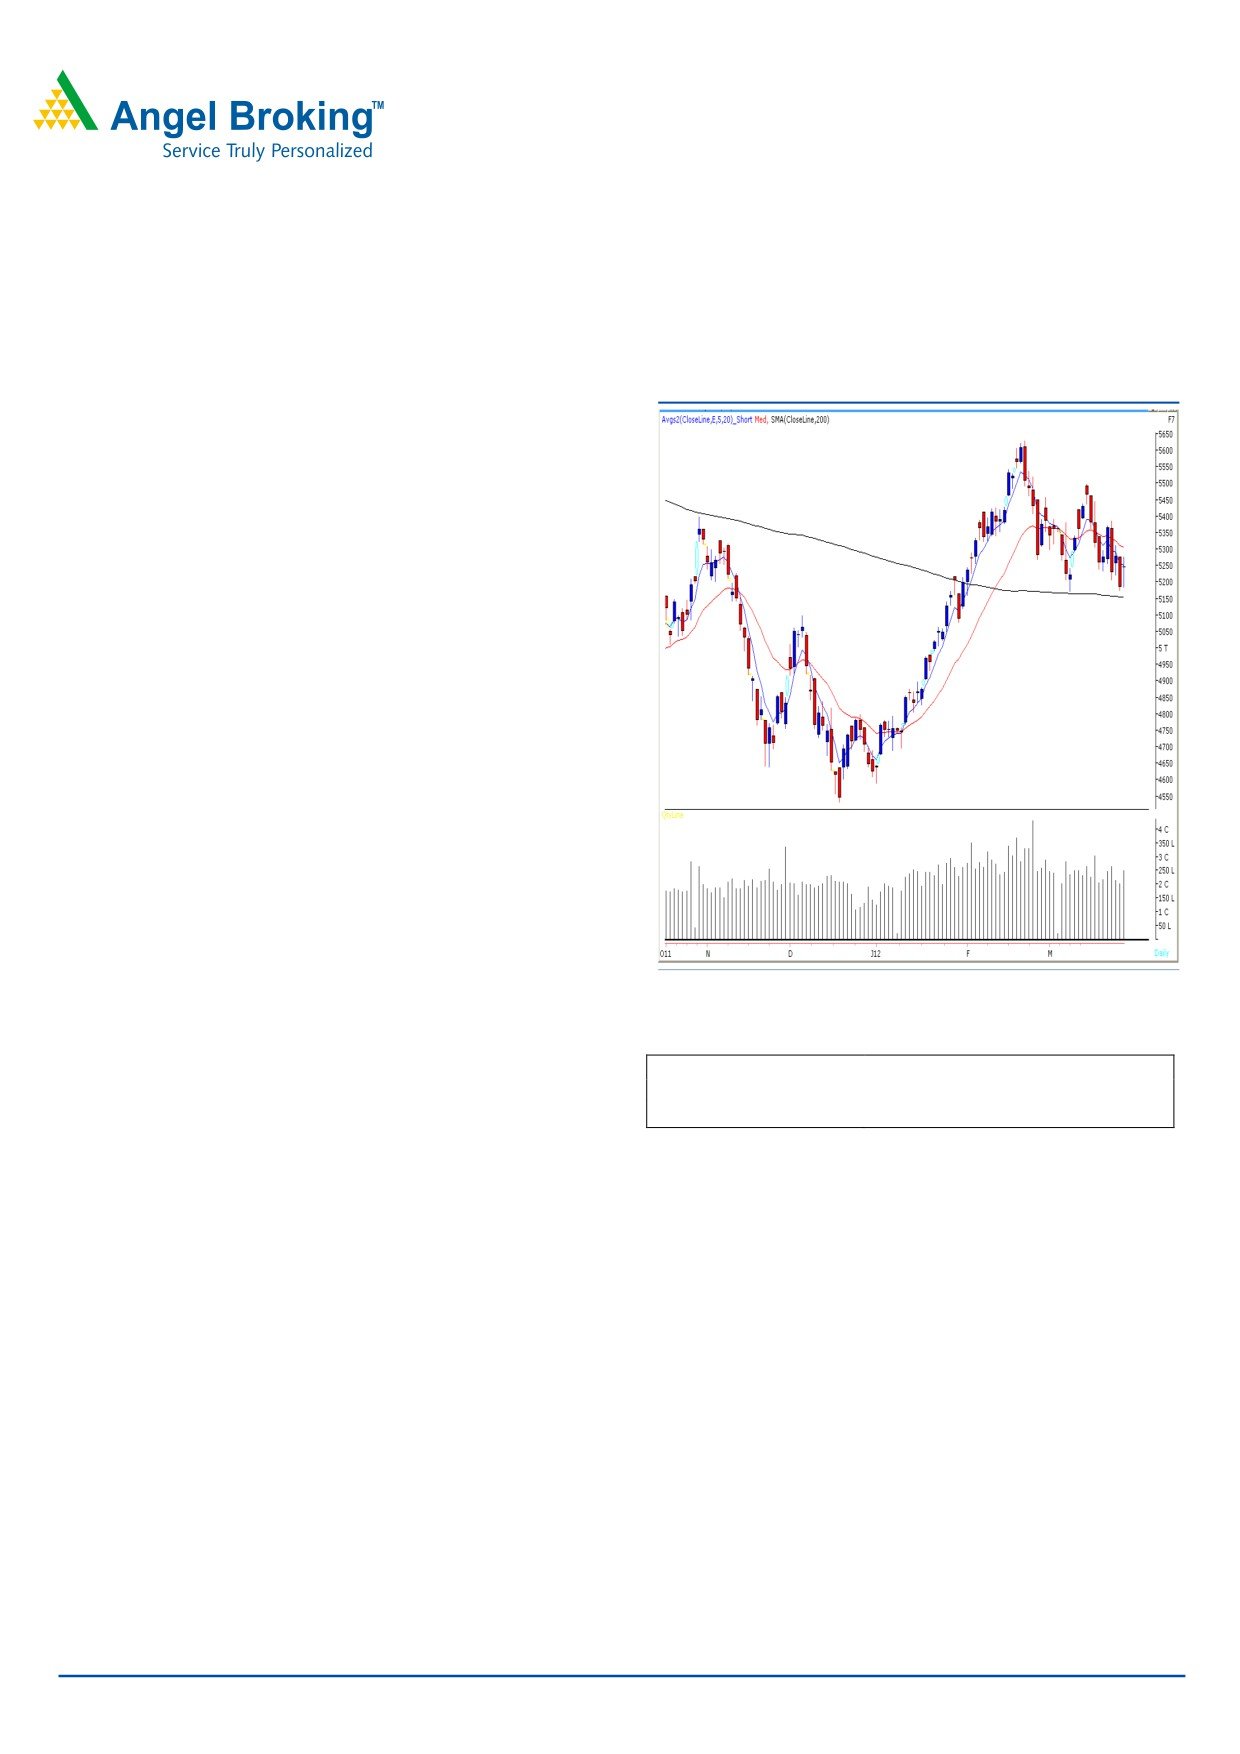
Exhibit 1: Nifty Daily Chart
Yesterday, markets opened on optimistic note in-line with
strong global bourses. However, indices traded with
extreme volatility before eventually managing to close well
in the positive territory. On sectoral front, Consumer
Durables, FMCG and Realty counters contributed heavily in
yesterday’s up move, whereas Power sector closed with
minor loss. The advance to decline ratio was strongly in
favour of declining counters (A=1189 D=1707) (Source -
Formation:
• The 200-day SMA (Simple Moving Average) and 20-
day EMA (Exponential Moving Average) have now shifted to
17164 / 5163 and 17607 / 5350, respectively.
• The “20-Week EMA” is placed at 17150 / 5188 level.
• The candlestick pattern on the daily chart resembles a
“Bullish Harami Cross”.
Source: Falcon
Actionable points:
Trading strategy:
View
Positive Above 5278
Yesterday, after opening significantly higher, indices drifted
Expected Targets
5312 - 5386
Support Levels
5171 - 5076
lower during the initial trade. However, strong buying
interest emerged at midst of the session pushed indices to
close near the
5250 mark. As mentioned above, the
candlestick pattern on the daily chart represents a “Bullish
Harami Cross”, which requires confirmation in the form of
a close above the 17367 / 5278 mark. Going forward,
positive momentum is likely to resume once indices cross
yesterday's high of 17367 / 5278. In this case, we are
likely to test next resistance levels of 17458 - 17687 / 5312
- 5386 levels. On the downside, 17008 / 5171 remains to
be a strong support in coming trading session.
For Private Circulation Only |
1
Technical Research | March 28, 2012
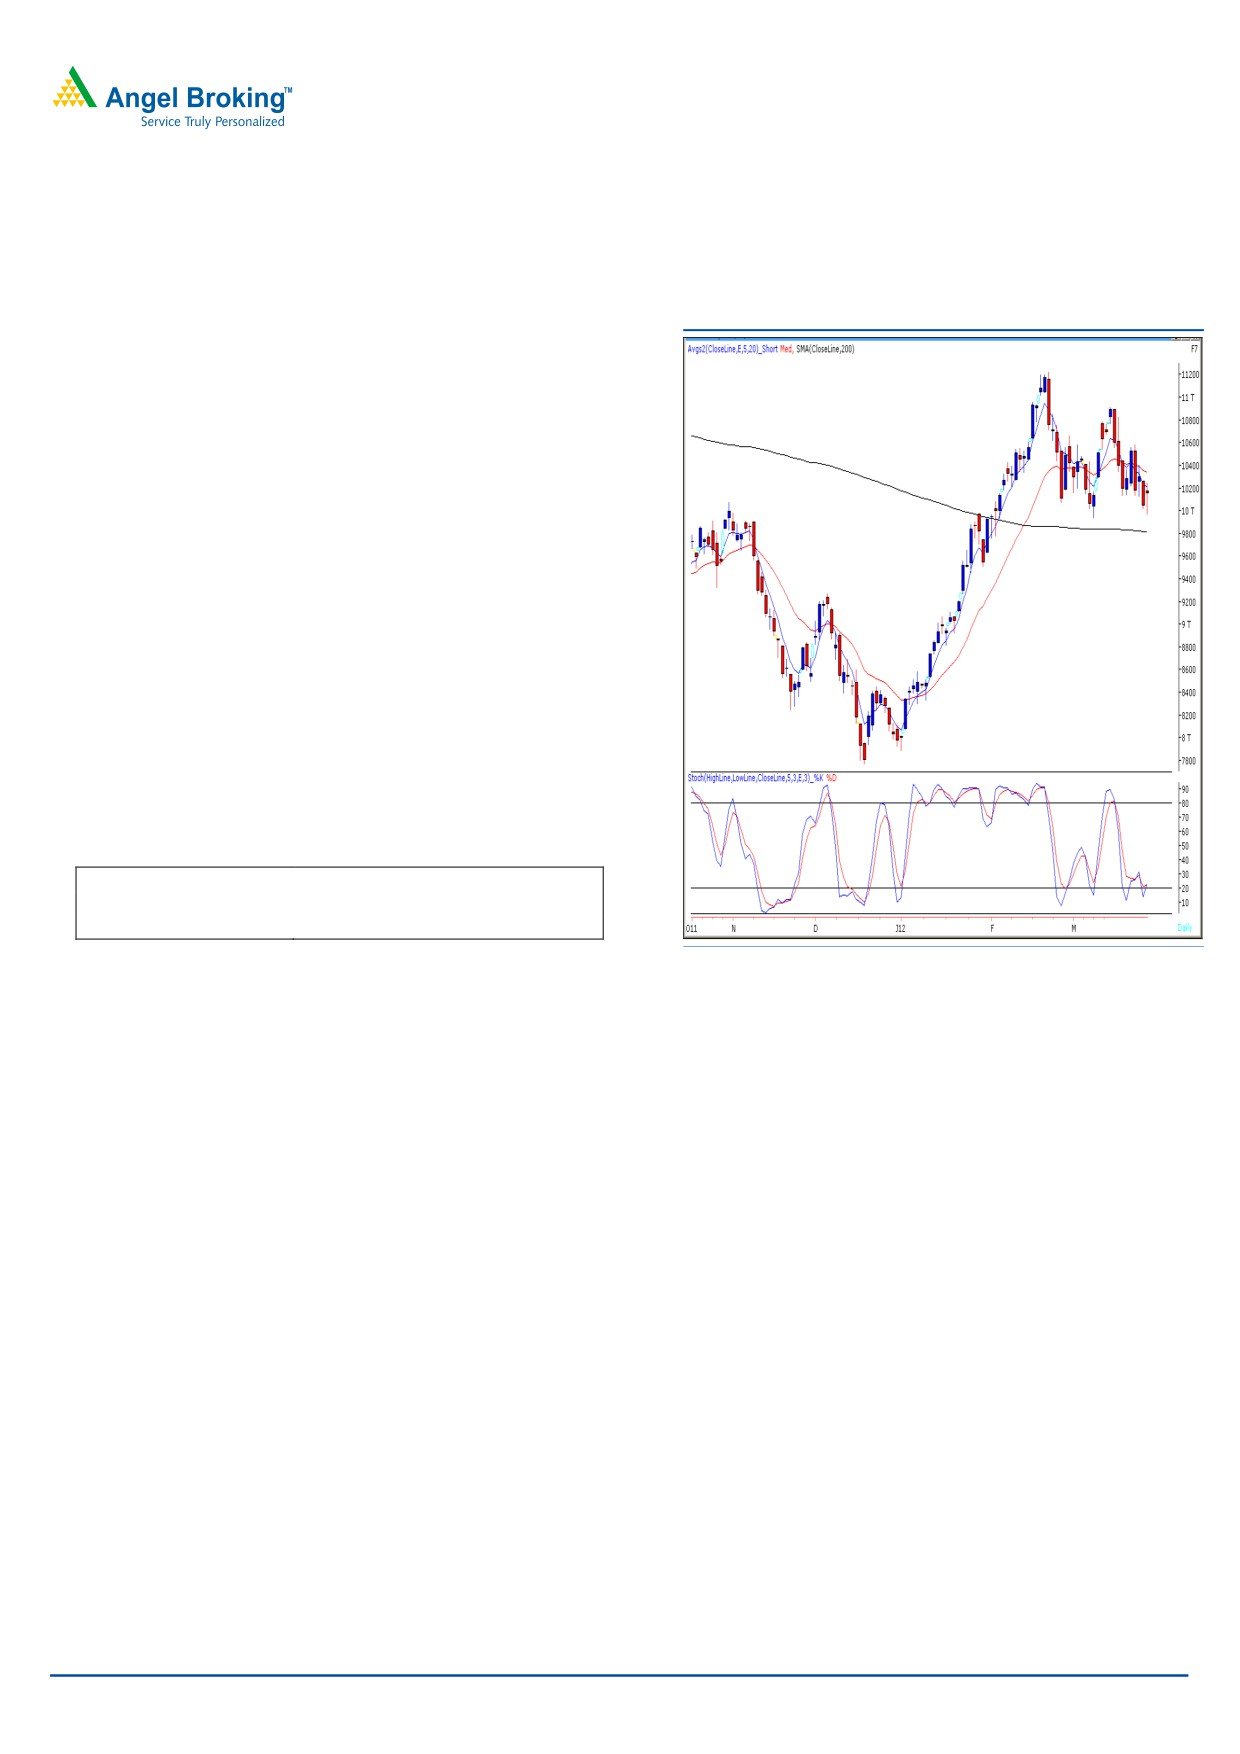
Bank Nifty Outlook - (10149)
Exhibit 2: Bank Nifty Daily Chart
Yesterday, Bank Nifty opened on an optimistic note and
traded with extreme volatility throughout the session to
close marginally below the initial opening level. We had
mentioned in our previous report that we are witnessing a
positive divergence in “RSI” momentum oscillator on the
hourly chart and a possibility of a minor pullback cannot
be ruled out. At his juncture we see a “Homing Pigeon”
candlestick pattern on the daily chart which is a sign of
reversal. Moreover, the momentum oscillators on the
daily chart are in an oversold condition. Thus if the index
sustains above yesterday’s high of 10247 then it is likely
to rally towards 10340 - 10405. On the downside 10026
- 9939 levels are likely to act as support in coming
trading session. The mentioned pattern will be negated if
the index closes below 9967 level.
Actionable points:
View
Bullish Above 10247
Expected Target
10340 - 10405
Support Levels
10026 - 9939
Source: Falcon
For Private Circulation Only |
2
Technical Research | March 28, 2012
Positive Bias:
Positive
Expected
Stock Name
CMP
5 Day EMA
20 Day EMA
Remarks
Above
Target
Biocon
234.1
235.8
251
237
250
View will change below
230.5
Adani Power
68.2
67.7
71.7
69.3
76
View will change below
65.5
For Private Circulation Only |
3
Technical Research | March 28, 2012
Daily Pivot Levels for Nifty 50 Stocks
SCRIPS
S2
S1
PIVOT
R1
R2
SENSEX
16,923
17,090
17,228
17,396
17,534
NIFTY
5,142
5,193
5,235
5,286
5,329
BANKNIFTY
9,842
9,995
10,121
10,275
10,401
ACC
1,282
1,303
1,324
1,345
1,366
AMBUJACEM
160
163
167
171
175
AXISBANK
1,096
1,119
1,140
1,163
1,184
BAJAJ-AUTO
1,632
1,647
1,665
1,680
1,698
BHARTIARTL
327
333
336
342
345
BHEL
245
250
257
262
268
BPCL
651
659
670
678
688
CAIRN
341
348
354
361
367
CIPLA
286
293
298
305
310
COALINDIA
321
326
330
335
340
DLF
188
193
196
201
203
DRREDDY
1,648
1,665
1,676
1,692
1,703
GAIL
357
360
364
368
372
HCLTECH
458
464
475
481
491
HDFC
648
658
665
674
681
HDFCBANK
508
513
518
523
527
HEROMOTOCO
1,962
1,986
2,013
2,037
2,064
HINDALCO
125
127
129
132
134
HINDUNILVR
398
407
412
422
427
ICICIBANK
836
857
873
894
909
IDFC
125
128
130
132
134
INFY
2,799
2,838
2,871
2,909
2,942
ITC
220
223
225
228
230
JINDALSTEL
508
521
529
542
550
JPASSOCIAT
77
79
82
84
86
KOTAKBANK
523
531
539
547
555
LT
1,257
1,280
1,301
1,324
1,345
M&M
670
677
685
693
701
MARUTI
1,229
1,251
1,281
1,303
1,333
NTPC
160
162
165
167
170
ONGC
256
261
264
269
273
PNB
885
905
922
942
959
POWERGRID
104
105
106
107
108
RANBAXY
405
409
415
419
426
RCOM
85
86
87
88
89
RELIANCE
718
725
732
738
745
RELINFRA
563
573
585
594
607
RPOWER
117
118
120
122
124
SAIL
93
94
95
96
96
SBIN
2,059
2,094
2,133
2,168
2,207
SESAGOA
188
192
194
198
200
SIEMENS
737
749
767
779
797
STER
108
110
111
113
115
SUNPHARMA
563
570
576
582
589
SUZLON
27
27
28
28
28
TATAMOTORS
262
267
271
277
281
TATAPOWER
92
94
96
98
100
TATASTEEL
433
440
445
452
457
TCS
1,141
1,158
1,169
1,186
1,196
WIPRO
411
420
425
433
438
Technical Research Team
For Private Circulation Only |
4
Technical Report
RESEARCH TEAM
Shardul Kulkarni
Head - Technicals
Sameet Chavan
Technical Analyst
Sacchitanand Uttekar
Technical Analyst
Mehul Kothari
Technical Analyst
Ankur Lakhotia
Technical Analyst
Research Team: 022-3952 6600
DISCLAIMER: This document is not for public distribution and has been furnished to you solely for your information and must not
be reproduced or redistributed to any other person. Persons into whose possession this document may come are required to observe
these restrictions.
Opinion expressed is our current opinion as of the date appearing on this material only. While we endeavor to update on a
reasonable basis the information discussed in this material, there may be regulatory, compliance, or other reasons that prevent us
from doing so. Prospective investors and others are cautioned that any forward-looking statements are not predictions and may be
subject to change without notice. Our proprietary trading and investment businesses may make investment decisions that are
inconsistent with the recommendations expressed herein.
The information in this document has been printed on the basis of publicly available information, internal data and other reliable
sources believed to be true and are for general guidance only. While every effort is made to ensure the accuracy and completeness of
information contained, the company takes no guarantee and assumes no liability for any errors or omissions of the information. No
one can use the information as the basis for any claim, demand or cause of action.
Recipients of this material should rely on their own investigations and take their own professional advice. Each recipient of this
document should make such investigations as it deems necessary to arrive at an independent evaluation of an investment in the
securities of companies referred to in this document (including the merits and risks involved), and should consult their own advisors to
determine the merits and risks of such an investment. Price and value of the investments referred to in this material may go up or
down. Past performance is not a guide for future performance. Certain transactions - futures, options and other derivatives as well as
non-investment grade securities - involve substantial risks and are not suitable for all investors. Reports based on technical analysis
centers on studying charts of a stock's price movement and trading volume, as opposed to focusing on a company's fundamentals
and as such, may not match with a report on a company's fundamentals.
We do not undertake to advise you as to any change of our views expressed in this document. While we would endeavor to update
the information herein on a reasonable basis, Angel Broking, its subsidiaries and associated companies, their directors and
employees are under no obligation to update or keep the information current. Also there may be regulatory, compliance, or other
reasons that may prevent Angel Broking and affiliates from doing so. Prospective investors and others are cautioned that any
forward-looking statements are not predictions and may be subject to change without notice.
Angel Broking Limited and affiliates, including the analyst who has issued this report, may, on the date of this report, and from time
to time, have long or short positions in, and buy or sell the securities of the companies mentioned herein or engage in any other
transaction involving such securities and earn brokerage or compensation or act as advisor or have other potential conflict of interest
with respect to company/ies mentioned herein or inconsistent with any recommendation and related information and opinions.
Angel Broking Limited and affiliates may seek to provide or have engaged in providing corporate finance, investment banking or
other advisory services in a merger or specific transaction to the companies referred to in this report, as on the date of this report or
in the past.
Sebi Registration No: INB 010996539
For Private Circulation Only |