Technical Research | February 28, 2012
Daily Technical Report
Sensex (17446) / NIFTY (5281)
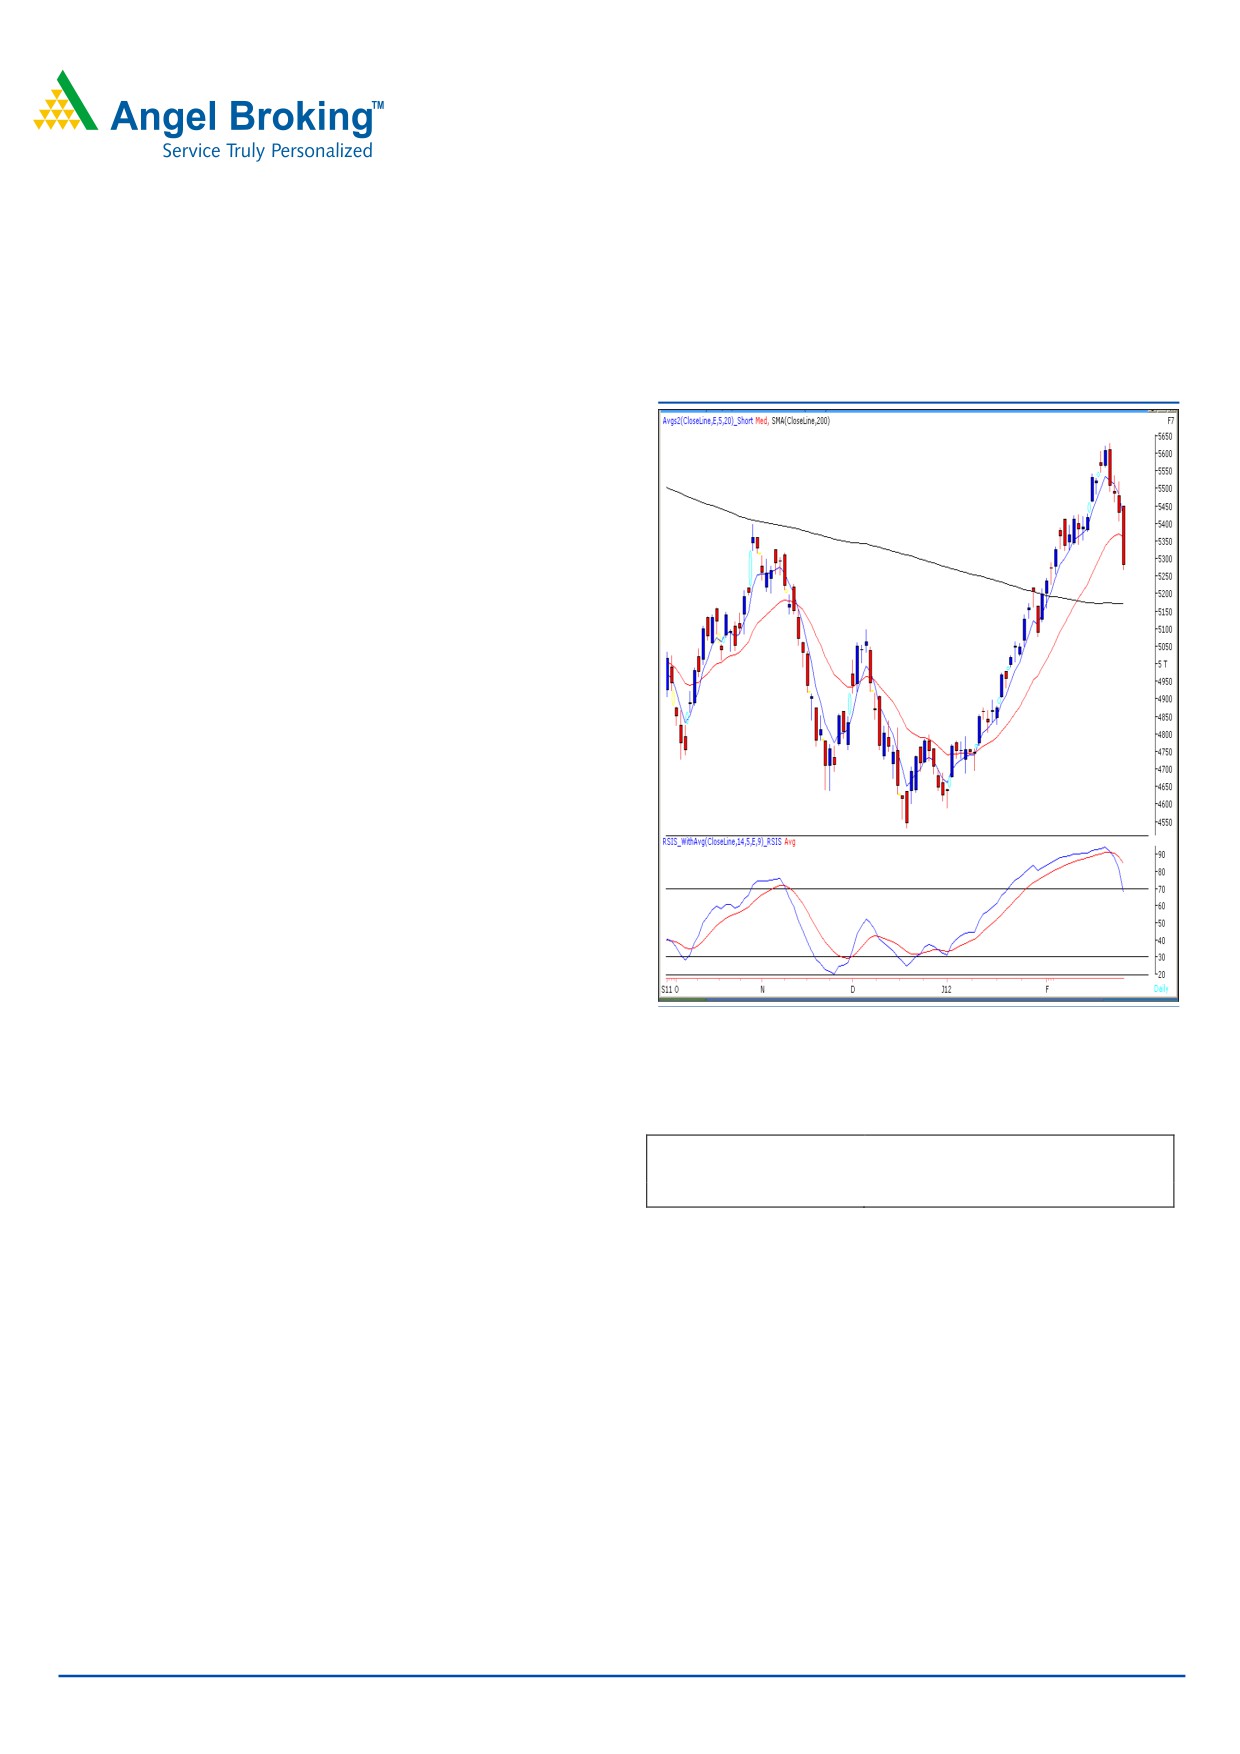
Exhibit 1: Nifty Daily Chart
Yesterday, markets opened on a flat note in-line with other
Asian indices. However, strong selling pressure was seen on
the violation of Friday’s low which led indices to close at the
lowest point of the session. On the sectoral front, Realty,
Metal, Power and Banking counters contributed heavily in
yesterday’s fall, whereas FMCG sector ended with a
nominal gain. The losses were higher in the mid and small
cap space and the nifty lost more than 2.7%. The advance
to decline ratio was strongly in favour of declining counters.
Formation:
• The 200-day SMA and 20-day EMA have now shifted to
17200 / 5170 and 17720 / 5370, respectively.
• The “RSI-Smoothened” oscillator and “3 & 8 EMA” on
the daily chart have given a negative crossover.
• The weekly “Stochastic” oscillator is negatively poised.
Source: Falcon
Trading strategy:
Actionable points:
Our markets opened on a flat note but selling pressure was
View
Negative below 5255
clearly evident from the first few trades of the session.
Expected target
5170 - 5120
Subsequently, the impact of negatively poised “RSI-
Resistance level
5340 - 5370
Smoothened” and “3 & 8 daily EMA” was seen on the
violation of Friday’s low of 17848 / 5405. We observed
strong selling pressure which pulled indices significantly
lower to close well below “Daily 20-EMA”. The immediate
support level is at 17382 / 5255 level. If indices sustain
below this level then they may fall further towards the “200-
day SMA” placed around 17200 - 5170 level. On the
upside, 17720 - 17975 / 5370 - 5450 levels may act as
strong resistance levels in coming trading session.
We reiterate that traders should adopt cautious
approach and trade with strict stop-loss.
For Private Circulation Only |
1
Technical Research | February 28, 2012
Bank Nifty Outlook - (10104)
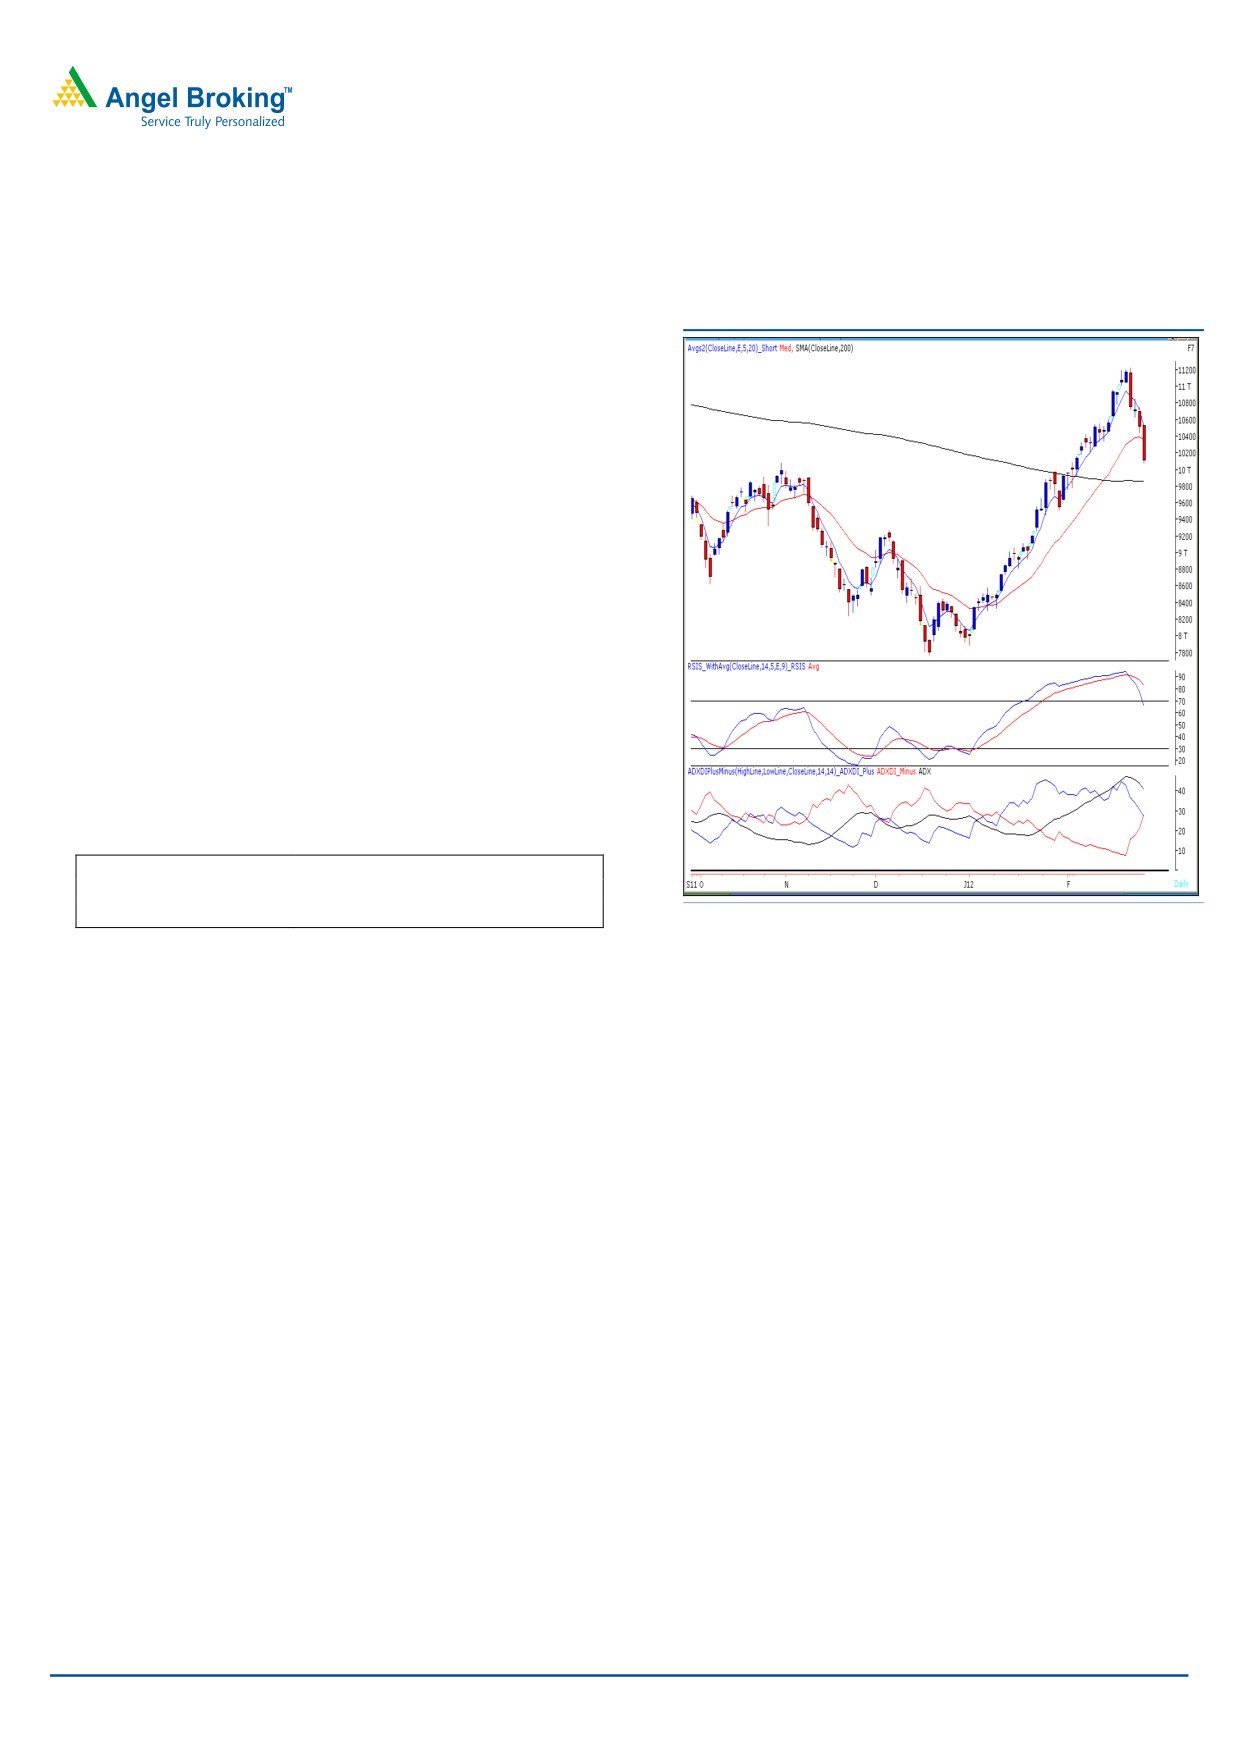
Exhibit 2: Bank Nifty Daily Chart
Yesterday, Bank Nifty opened on a flat note and selling
pressure was witnessed throughout the session, which led
the index to close near the lowest point of the day. As
stated in our previous report selling pressure intensified
below the mentioned support level of 10390. The index
has managed to close well below the “20 EMA” currently
placed at 10360 level coupled with negative crossover of
directional indicators in “ADX (14)” indicator. Combining
the above technical evidences it is quite likely that if the
index sustains below yesterday’s low of 10073 then it is
likely to test the support zone of 9900 - 9850. The said
support zone is formed by confluence of 38.2% Fibonacci
retracement of the rise from December 20, 2011 -
February 22, 2012 and 200 SMA. On the upside 10380
- 10528 are likely to act as resistance in coming trading
session.
Actionable points:
View
Negative below 10073
Expected Target
9900 - 9850
Resistance Levels
10380 - 10528
Source: Falcon
For Private Circulation Only |
2
Technical Research | February 28, 2012
Negative Bias:
Expected
Stock Name
CMP
5 Day EMA
20 Day EMA
Remarks
Target
IDBI
104.3
108.9
106.7
100
View will change above 112
For Private Circulation Only |
3
Technical Research | February 28, 2012
Daily Pivot Levels for Nifty 50 Stocks
SCRIPS
S2
S1
PIVOT
R1
R2
SENSEX
17,007
17,227
17,601
17,820
18,194
NIFTY
5,151
5,216
5,333
5,398
5,515
BANKNIFTY
9,781
9,943
10,235
10,396
10,689
ACC
1,213
1,236
1,260
1,283
1,307
AMBUJACEM
155
157
159
161
163
AXISBANK
1,053
1,084
1,136
1,167
1,219
BAJAJ-AUTO
1,628
1,667
1,720
1,759
1,812
BHARTIARTL
332
336
342
346
352
BHEL
273
281
294
302
315
BPCL
632
646
665
679
699
CAIRN
356
367
378
389
400
CIPLA
306
310
315
319
324
COALINDIA
310
317
324
330
338
DLF
204
210
219
224
233
DRREDDY
1,597
1,614
1,629
1,646
1,661
GAIL
366
369
373
376
381
HCLTECH
470
477
488
495
505
HDFC
649
657
670
678
691
HDFCBANK
500
508
520
527
539
HEROMOTOCO
1,806
1,869
1,978
2,041
2,150
HINDALCO
133
136
142
146
152
HINDUNILVR
370
375
383
388
396
ICICIBANK
850
869
901
919
951
IDFC
123
127
133
137
144
INFY
2,814
2,849
2,907
2,942
3,000
ITC
207
210
211
214
216
JINDALSTEL
544
563
591
610
637
JPASSOCIAT
65
67
71
74
77
KOTAKBANK
520
532
542
553
563
LT
1,253
1,277
1,314
1,338
1,375
M&M
665
681
707
723
749
MARUTI
1,206
1,232
1,261
1,286
1,316
NTPC
171
176
180
185
190
ONGC
271
276
282
287
293
PNB
842
875
922
955
1,002
POWERGRID
109
110
113
114
116
RANBAXY
415
420
427
431
438
RCOM
82
85
90
92
97
RELIANCE
731
756
791
816
851
RELINFRA
503
522
554
573
605
RPOWER
102
106
113
116
123
SAIL
90
93
100
104
110
SBIN
2,042
2,083
2,151
2,192
2,260
SESAGOA
193
198
208
214
223
SIEMENS
729
751
775
797
820
STER
106
111
119
123
131
SUNPHARMA
539
544
549
554
559
SUZLON
22
23
25
26
28
TATAMOTORS
249
254
261
267
274
TATAPOWER
104
107
111
113
117
TATASTEEL
414
428
453
467
492
TCS
1,225
1,238
1,259
1,273
1,294
WIPRO
411
418
429
436
448
Technical Research Team
For Private Circulation Only |
4
Technical Report
RESEARCH TEAM
Shardul Kulkarni
Head - Technicals
Sameet Chavan
Technical Analyst
Sacchitanand Uttekar
Technical Analyst
Mehul Kothari
Technical Analyst
Ankur Lakhotia
Technical Analyst
Research Team: 022-3952 6600
DISCLAIMER: This document is not for public distribution and has been furnished to you solely for your information and must not
be reproduced or redistributed to any other person. Persons into whose possession this document may come are required to observe
these restrictions.
Opinion expressed is our current opinion as of the date appearing on this material only. While we endeavor to update on a
reasonable basis the information discussed in this material, there may be regulatory, compliance, or other reasons that prevent us
from doing so. Prospective investors and others are cautioned that any forward-looking statements are not predictions and may be
subject to change without notice. Our proprietary trading and investment businesses may make investment decisions that are
inconsistent with the recommendations expressed herein.
The information in this document has been printed on the basis of publicly available information, internal data and other reliable
sources believed to be true and are for general guidance only. While every effort is made to ensure the accuracy and completeness of
information contained, the company takes no guarantee and assumes no liability for any errors or omissions of the information. No
one can use the information as the basis for any claim, demand or cause of action.
Recipients of this material should rely on their own investigations and take their own professional advice. Each recipient of this
document should make such investigations as it deems necessary to arrive at an independent evaluation of an investment in the
securities of companies referred to in this document (including the merits and risks involved), and should consult their own advisors to
determine the merits and risks of such an investment. Price and value of the investments referred to in this material may go up or
down. Past performance is not a guide for future performance. Certain transactions - futures, options and other derivatives as well as
non-investment grade securities - involve substantial risks and are not suitable for all investors. Reports based on technical analysis
centers on studying charts of a stock's price movement and trading volume, as opposed to focusing on a company's fundamentals
and as such, may not match with a report on a company's fundamentals.
We do not undertake to advise you as to any change of our views expressed in this document. While we would endeavor to update
the information herein on a reasonable basis, Angel Broking, its subsidiaries and associated companies, their directors and
employees are under no obligation to update or keep the information current. Also there may be regulatory, compliance, or other
reasons that may prevent Angel Broking and affiliates from doing so. Prospective investors and others are cautioned that any
forward-looking statements are not predictions and may be subject to change without notice.
Angel Broking Limited and affiliates, including the analyst who has issued this report, may, on the date of this report, and from time
to time, have long or short positions in, and buy or sell the securities of the companies mentioned herein or engage in any other
transaction involving such securities and earn brokerage or compensation or act as advisor or have other potential conflict of interest
with respect to company/ies mentioned herein or inconsistent with any recommendation and related information and opinions.
Angel Broking Limited and affiliates may seek to provide or have engaged in providing corporate finance, investment banking or
other advisory services in a merger or specific transaction to the companies referred to in this report, as on the date of this report or
in the past.
Sebi Registration No : INB 010996539
For Private Circulation Only |