Technical Research | October 28, 2011
Daily Technical Report
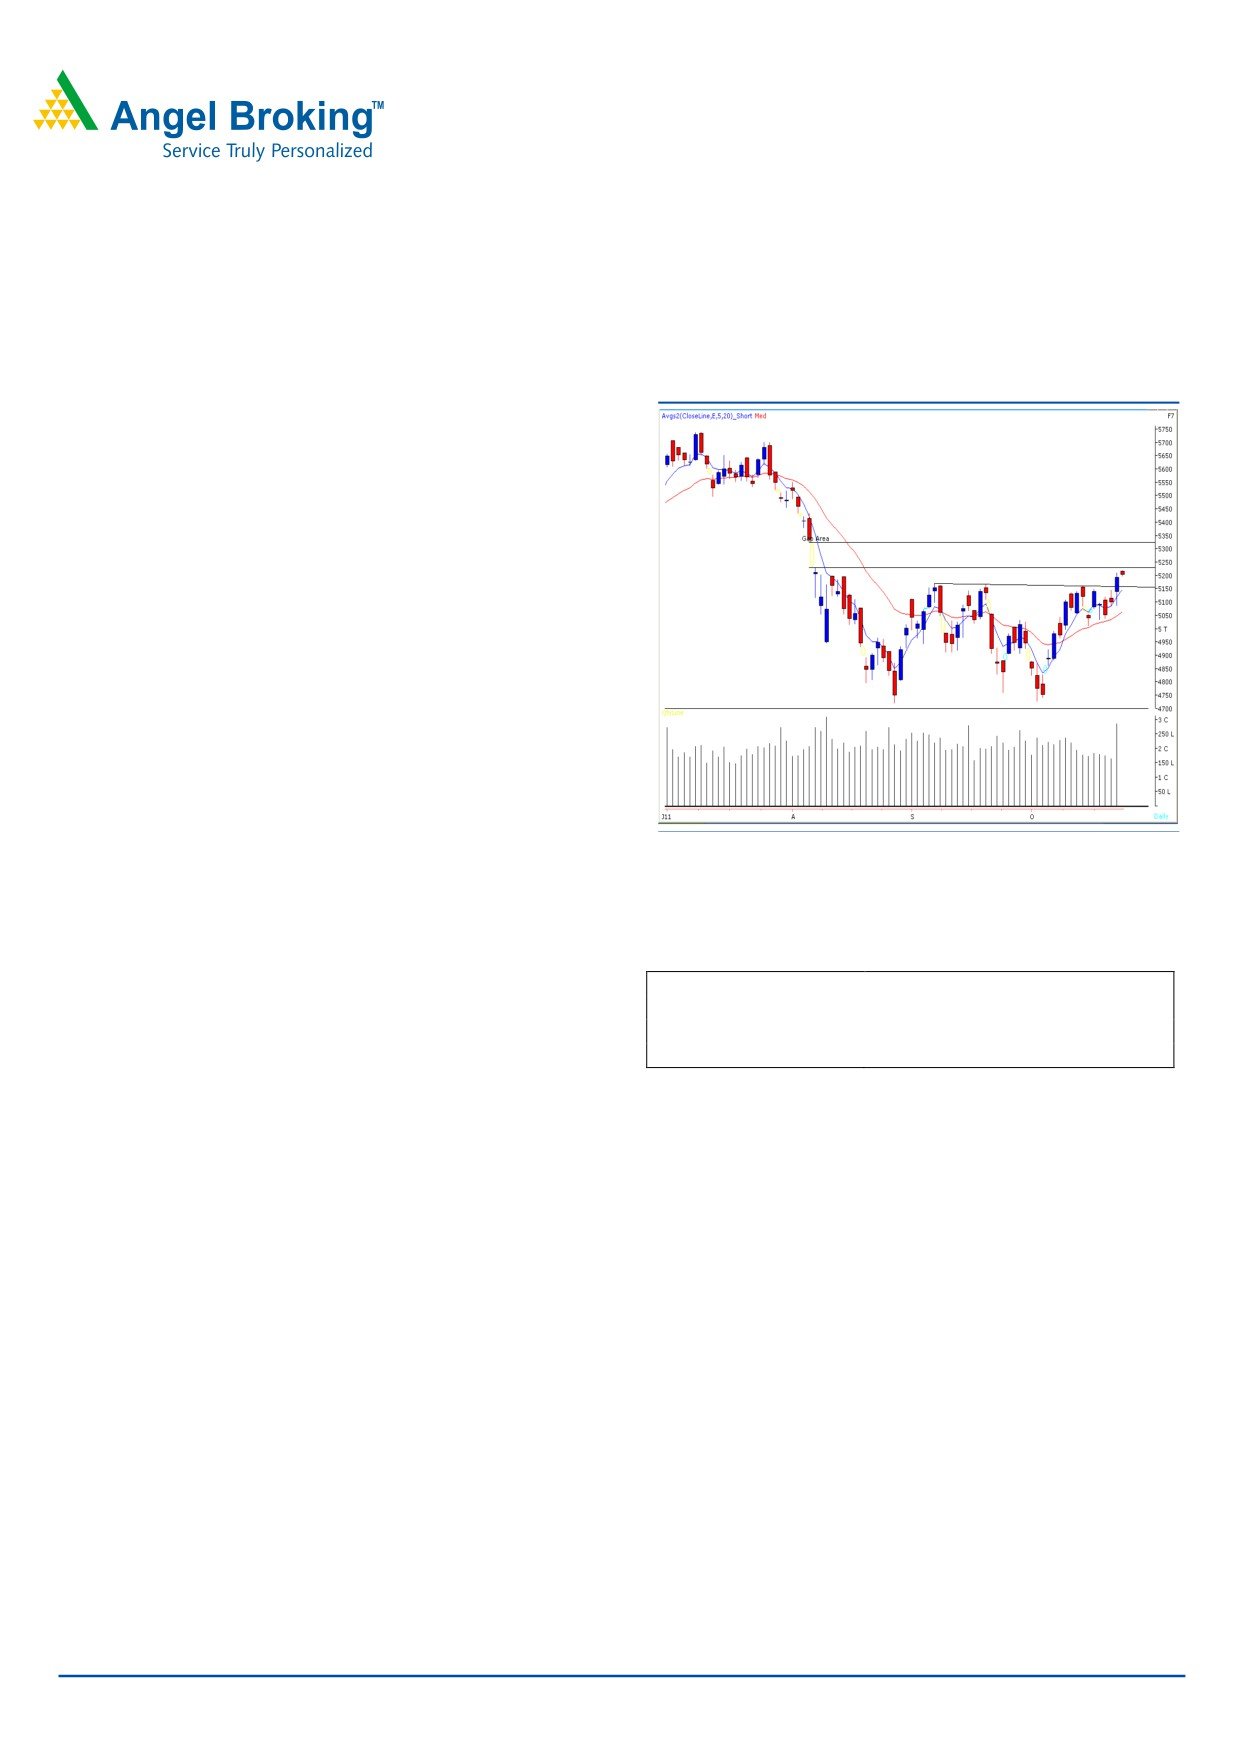
Sensex (17277) / NIFTY (5202)
On Tuesday’s session, our benchmark indices opened
Exhibit 1: Nifty Daily Chart
marginally higher and traded with extreme volatility mainly
on account of RBI Monetary policy and Derivatives expiry.
However, markets picked up strong positive momentum
during the last one hour of the session which led indices to
cross 17300 / 5200 mark after nearly four months. On the
sector front, IT, Auto, Health Care and Oil & Gas counters
were among the gainers whereas Banking sector ended on
a losing side. The advance decline ratio was marginally in
favor of declining counters (A=1355 D=1460). (Source -
Falcon software)
Formation
• During the week, indices have managed to cross
“Horizontal Line” resistance of 17256 / 5198 level.
Source: Falcon
• On the daily chart, we are witnessing a “Trend Line”
break out at 17200 / 5177 level.
Actionable points:
Trading strategy:
We witnessed a quite opening on Tuesday’s session and
View
Neutral
indices traded with immense volatility before the
Resistance Levels
5230 - 5323
Support Levels
5145 - 5085
announcement of “RBI Monetary Policy”. Subsequently,
indices rallied during the last hour and managed to cross
stiff resistance zone of 17200 - 17256 / 5177 - 5198. In
addition, we are observing a “Trend Line” break out at
17200 / 5177 level. Also, global indices are showing
tremendous strength on the back of the decisions taken
during the European summit on the debt crisis. Thus, going
forward, if indices manage to sustain above 17300 / 5200
level then they are likely to move higher to test the gap area
of 17358 - 17665 / 5230 - 5323 created on August 5,
2011. On the downside, 17100 - 16900 / 5145 - 5085
are likely to act as a support in coming trading sessions.
For Private Circulation Only |
1
Technical Research | October 28, 2011
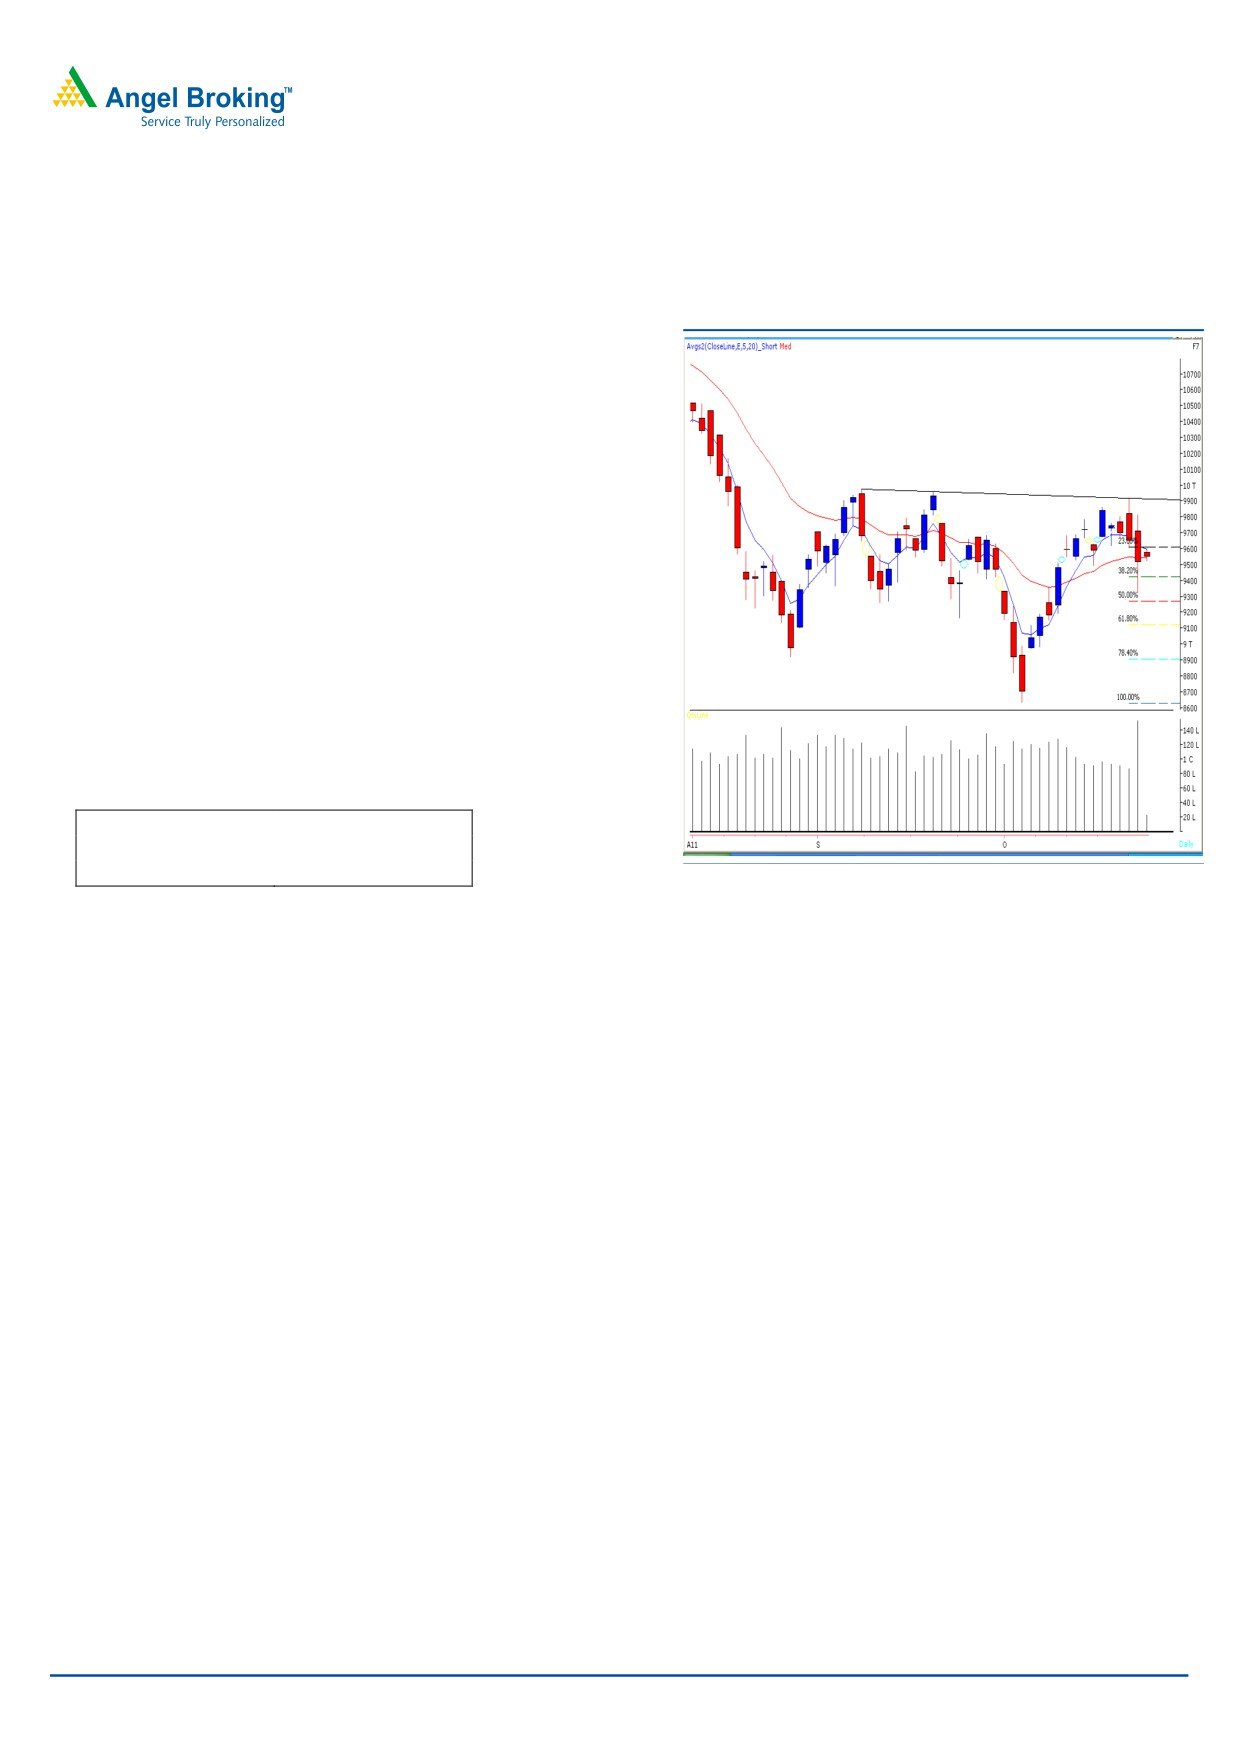
Bank Nifty Outlook - (9547)
Exhibit 2: Bank Nifty Daily Chart
Bank nifty opened on a quite note on Tuesday’s trading
session and slipped below both the mentioned support levels
of 9580-9430 during the day trade after the announcement
of RBI monetary policy. However, index managed to give a
close well above the second support level. We are witnessing
that the index has taken support near the 50% Fibonacci
retracement of the rise from 5th October - 24th October
2011. We reiterate our view that 9970 - 10030 levels may
act as a stiff resistance for Bank Nifty; only a close beyond
these levels would provide clear direction of the trend.
On the downside, 9323 level may act as a support level for
the day.
Actionable points:
View
Neutral
Resistance Levels
9970 - 10030
Support Level
9323
Source: Falcon
For Private Circulation Only |
2
Technical Research | October 28, 2011
Positive Bias:
Stock Name
5 Day EMA
20 Day EMA
Expected Target
Remarks
Global Tele
49.40
53.21
54.5
View will change below 47.5
KFA
23.2
22.9
25.9
View will change below 21.5
RecLtd
174.3
173.5
180
View will change below 170.6
Negative Bias:
Stock Name
5 Day EMA
20 Day EMA
Expected Target
Remarks
OFSS
2143.8
2052
2050
View will change above 2161
For Private Circulation Only |
3
Technical Research | October 28, 2011
Daily Pivot Levels for Nifty 50 Stocks
SCRIPS
S2
S1
PIVOT
R1
R2
SENSEX
17,227
17,258
17,304
17,335
17,381
NIFTY
5,183
5,192
5,206
5,215
5,229
BANKNIFTY
9,476
9,511
9,559
9,595
9,643
ACC
1,166
1,180
1,189
1,203
1,212
AMBUJACEM
153
154
154
155
156
AXISBANK
1,110
1,116
1,126
1,132
1,142
BAJAJ-AUTO
1,745
1,751
1,759
1,765
1,772
BHARTIARTL
389
391
393
395
397
BHEL
314
316
317
319
320
BPCL
646
652
657
663
668
CAIRN
294
296
298
299
301
CIPLA
290
291
293
295
296
DLF
226
228
230
232
234
DRREDDY
1,559
1,576
1,587
1,604
1,615
GAIL
423
425
429
431
435
HCLTECH
424
427
431
434
439
HDFC
656
662
668
673
679
HDFCBANK
467
470
472
475
477
HEROMOTOCO
2,085
2,096
2,108
2,119
2,131
HINDALCO
125
127
128
129
131
HINDUNILVR
340
342
343
345
346
ICICIBANK
854
863
874
883
894
IDFC
126
127
128
130
131
INFY
2,808
2,823
2,847
2,862
2,885
ITC
210
211
212
213
214
JINDALSTEL
530
534
539
544
549
JPASSOCIAT
72
73
73
73
74
KOTAKBANK
487
491
495
499
503
LT
1,334
1,342
1,349
1,357
1,364
M&M
839
844
850
855
861
MARUTI
1,130
1,140
1,154
1,164
1,178
NTPC
173
174
174
175
176
ONGC
272
275
276
279
280
PNB
926
933
938
945
950
POWERGRID
103
103
104
105
106
RANBAXY
508
512
515
519
522
RCOM
75
75
76
76
77
RELCAPITAL
343
345
347
348
350
RELIANCE
865
869
875
880
886
RELINFRA
421
422
425
426
429
RPOWER
90
91
92
93
94
SAIL
108
108
110
110
112
SBIN
1,845
1,856
1,863
1,874
1,881
SESAGOA
197
201
204
208
210
SIEMENS
829
834
841
846
853
STER
121
121
122
123
124
SUNPHARMA
493
498
502
508
511
SUZLON
36
36
37
37
37
TATAMOTORS
188
190
192
194
197
TATAPOWER
100
100
101
102
102
TATASTEEL
446
449
452
455
458
TCS
1,083
1,090
1,100
1,106
1,116
WIPRO
363
366
370
373
377
Technical Research Team
For Private Circulation Only |
4
Technical Report
RESEARCH TEAM
Shardul Kulkarni
Head - Technicals
Sameet Chavan
Technical Analyst
Sacchitanand Uttekar
Technical Analyst
Mehul Kothari
Technical Analyst
Ankur Lakhotia
Technical Analyst
Research Team: 022-3952 6600
DISCLAIMER: This document is not for public distribution and has been furnished to you solely for your information and must not
be reproduced or redistributed to any other person. Persons into whose possession this document may come are required to observe
these restrictions.
Opinion expressed is our current opinion as of the date appearing on this material only. While we endeavor to update on a
reasonable basis the information discussed in this material, there may be regulatory, compliance, or other reasons that prevent us
from doing so. Prospective investors and others are cautioned that any forward-looking statements are not predictions and may be
subject to change without notice. Our proprietary trading and investment businesses may make investment decisions that are
inconsistent with the recommendations expressed herein.
The information in this document has been printed on the basis of publicly available information, internal data and other reliable
sources believed to be true and are for general guidance only. While every effort is made to ensure the accuracy and completeness of
information contained, the company takes no guarantee and assumes no liability for any errors or omissions of the information. No
one can use the information as the basis for any claim, demand or cause of action.
Recipients of this material should rely on their own investigations and take their own professional advice. Each recipient of this
document should make such investigations as it deems necessary to arrive at an independent evaluation of an investment in the
securities of companies referred to in this document (including the merits and risks involved), and should consult their own advisors to
determine the merits and risks of such an investment. Price and value of the investments referred to in this material may go up or
down. Past performance is not a guide for future performance. Certain transactions - futures, options and other derivatives as well as
non-investment grade securities - involve substantial risks and are not suitable for all investors. Reports based on technical analysis
centers on studying charts of a stock's price movement and trading volume, as opposed to focusing on a company's fundamentals
and as such, may not match with a report on a company's fundamentals.
We do not undertake to advise you as to any change of our views expressed in this document. While we would endeavor to update
the information herein on a reasonable basis, Angel Broking, its subsidiaries and associated companies, their directors and
employees are under no obligation to update or keep the information current. Also there may be regulatory, compliance, or other
reasons that may prevent Angel Broking and affiliates from doing so. Prospective investors and others are cautioned that any
forward-looking statements are not predictions and may be subject to change without notice.
Angel Broking Limited and affiliates, including the analyst who has issued this report, may, on the date of this report, and from time
to time, have long or short positions in, and buy or sell the securities of the companies mentioned herein or engage in any other
transaction involving such securities and earn brokerage or compensation or act as advisor or have other potential conflict of interest
with respect to company/ies mentioned herein or inconsistent with any recommendation and related information and opinions.
Angel Broking Limited and affiliates may seek to provide or have engaged in providing corporate finance, investment banking or
other advisory services in a merger or specific transaction to the companies referred to in this report, as on the date of this report or
in the past.
Sebi Registration No : INB 010996539
For Private Circulation Only |