Technical Research | December 27, 2011
Daily Technical Report
Sensex (15971) / NIFTY (4779)
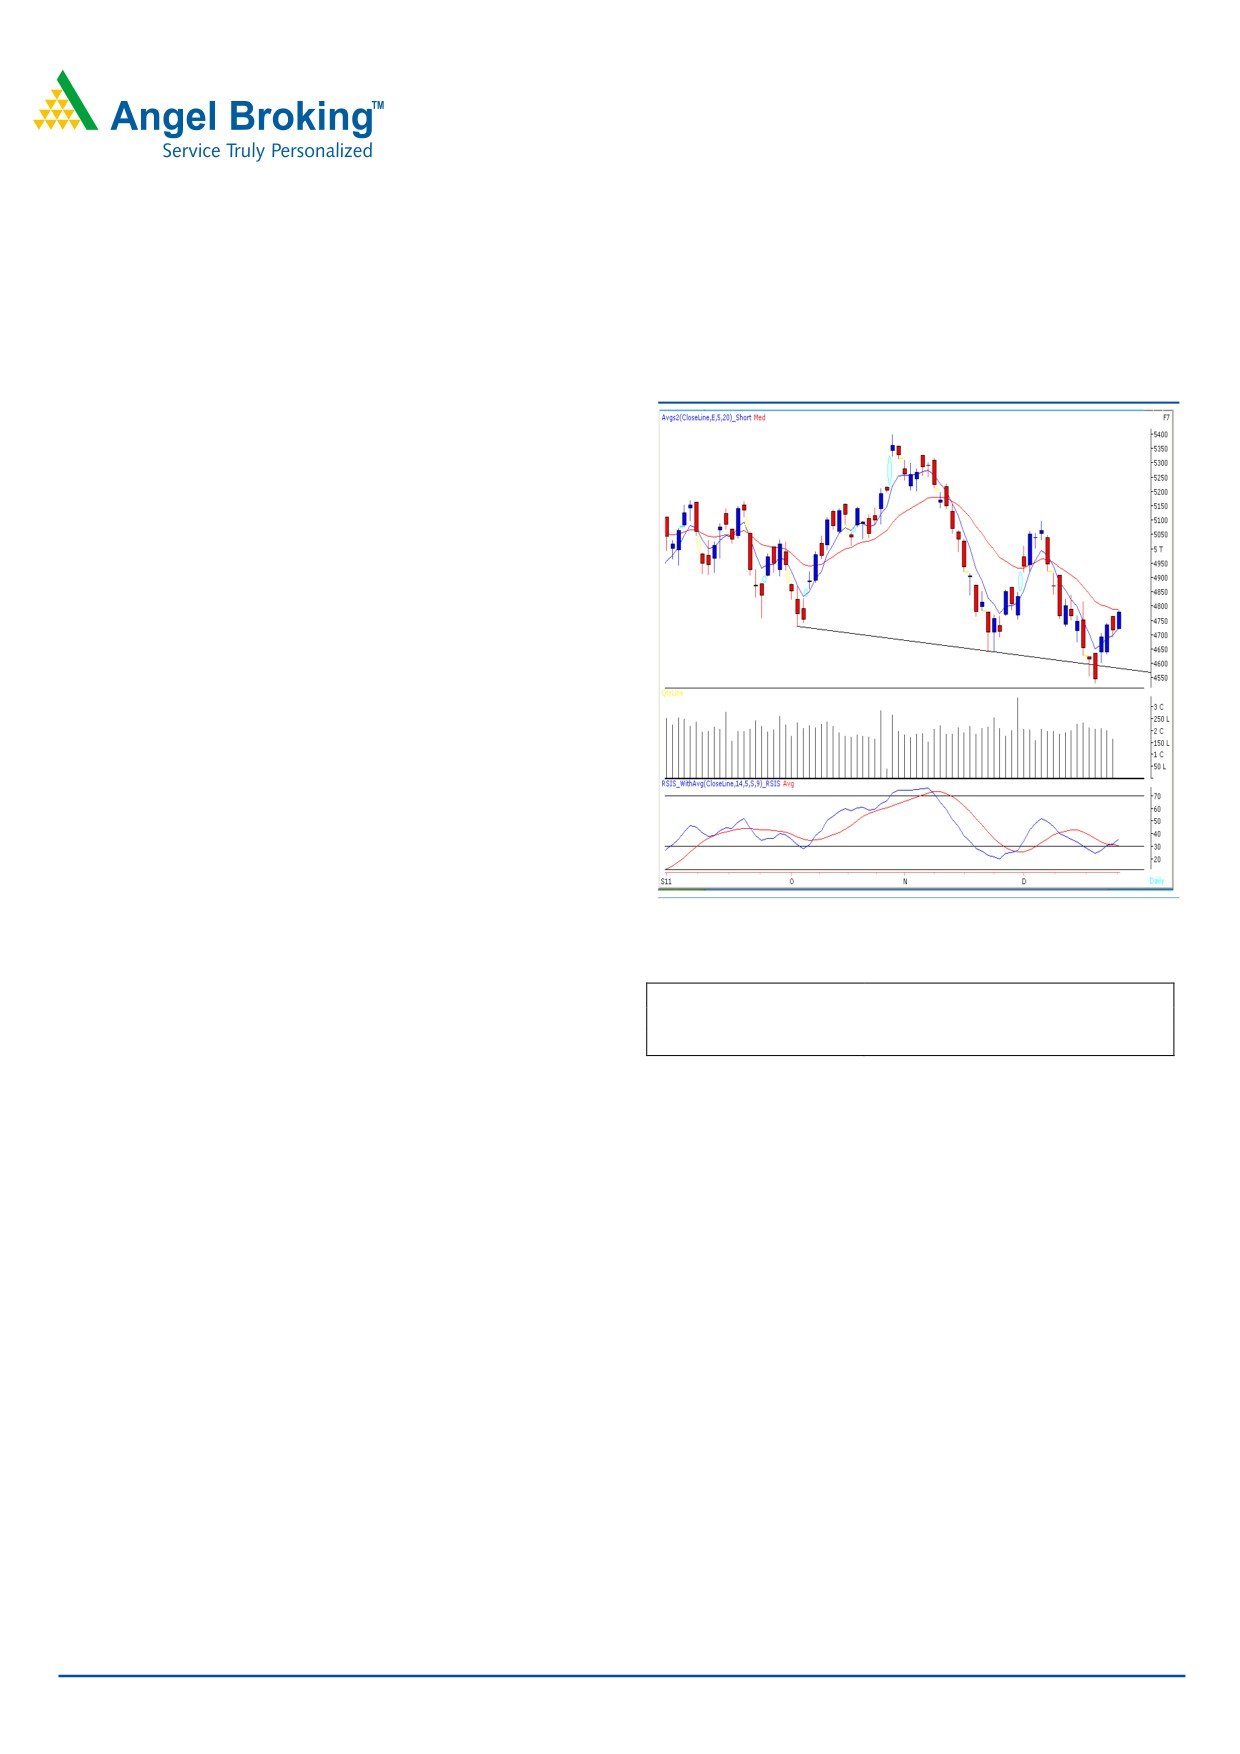
Exhibit 1: Nifty Daily Chart
Yesterday, markets opened quietly and then traded with a
positive bias throughout the session. Subsequently, indices
moved towards the 4800 mark and closed marginally
below it. On the sectoral front, Technology, IT and Realty
sectors were among the major gainers, whereas Health
Care counters ended marginally on the losing side. The
advance to decline ratio was strongly in favor of advancing
counters.
(A=1662 D=1015).
(Source
-
Formation
• We are witnessing a positive crossover in “RSI
-
Smoothened” oscillator.
• The 20 EMA on the daily chart is placed at 16020 /
4800 level.
Source: Falcon
Actionable points:
Trading strategy:
View
Neutral
After a flat opening in yesterday’s session, indices continued
Resistance levels
4800 - 4820 - 4881
to move higher and tested the 20 Day EMA during the
Support levels
4757 - 4693
second half. Going forward, 16020 - 16070 / 4800 -
4820 levels are likely to act as a strong resistance zone.
Further, we are observing a positive crossover in “RSI -
Smoothened” oscillator, which indicates possibility of
increase in positive momentum, if indices manage to
sustain above upper range of the resistance zone i.e.
16070 / 4820. In this case, indices are likely to move
towards 16286 - 16421/ 4881 - 4920 levels. On the
downside, the immediate support levels are at 15887 -
15671 / 4757 - 4693.
For Private Circulation Only |
1
Technical Research | December 27, 2011
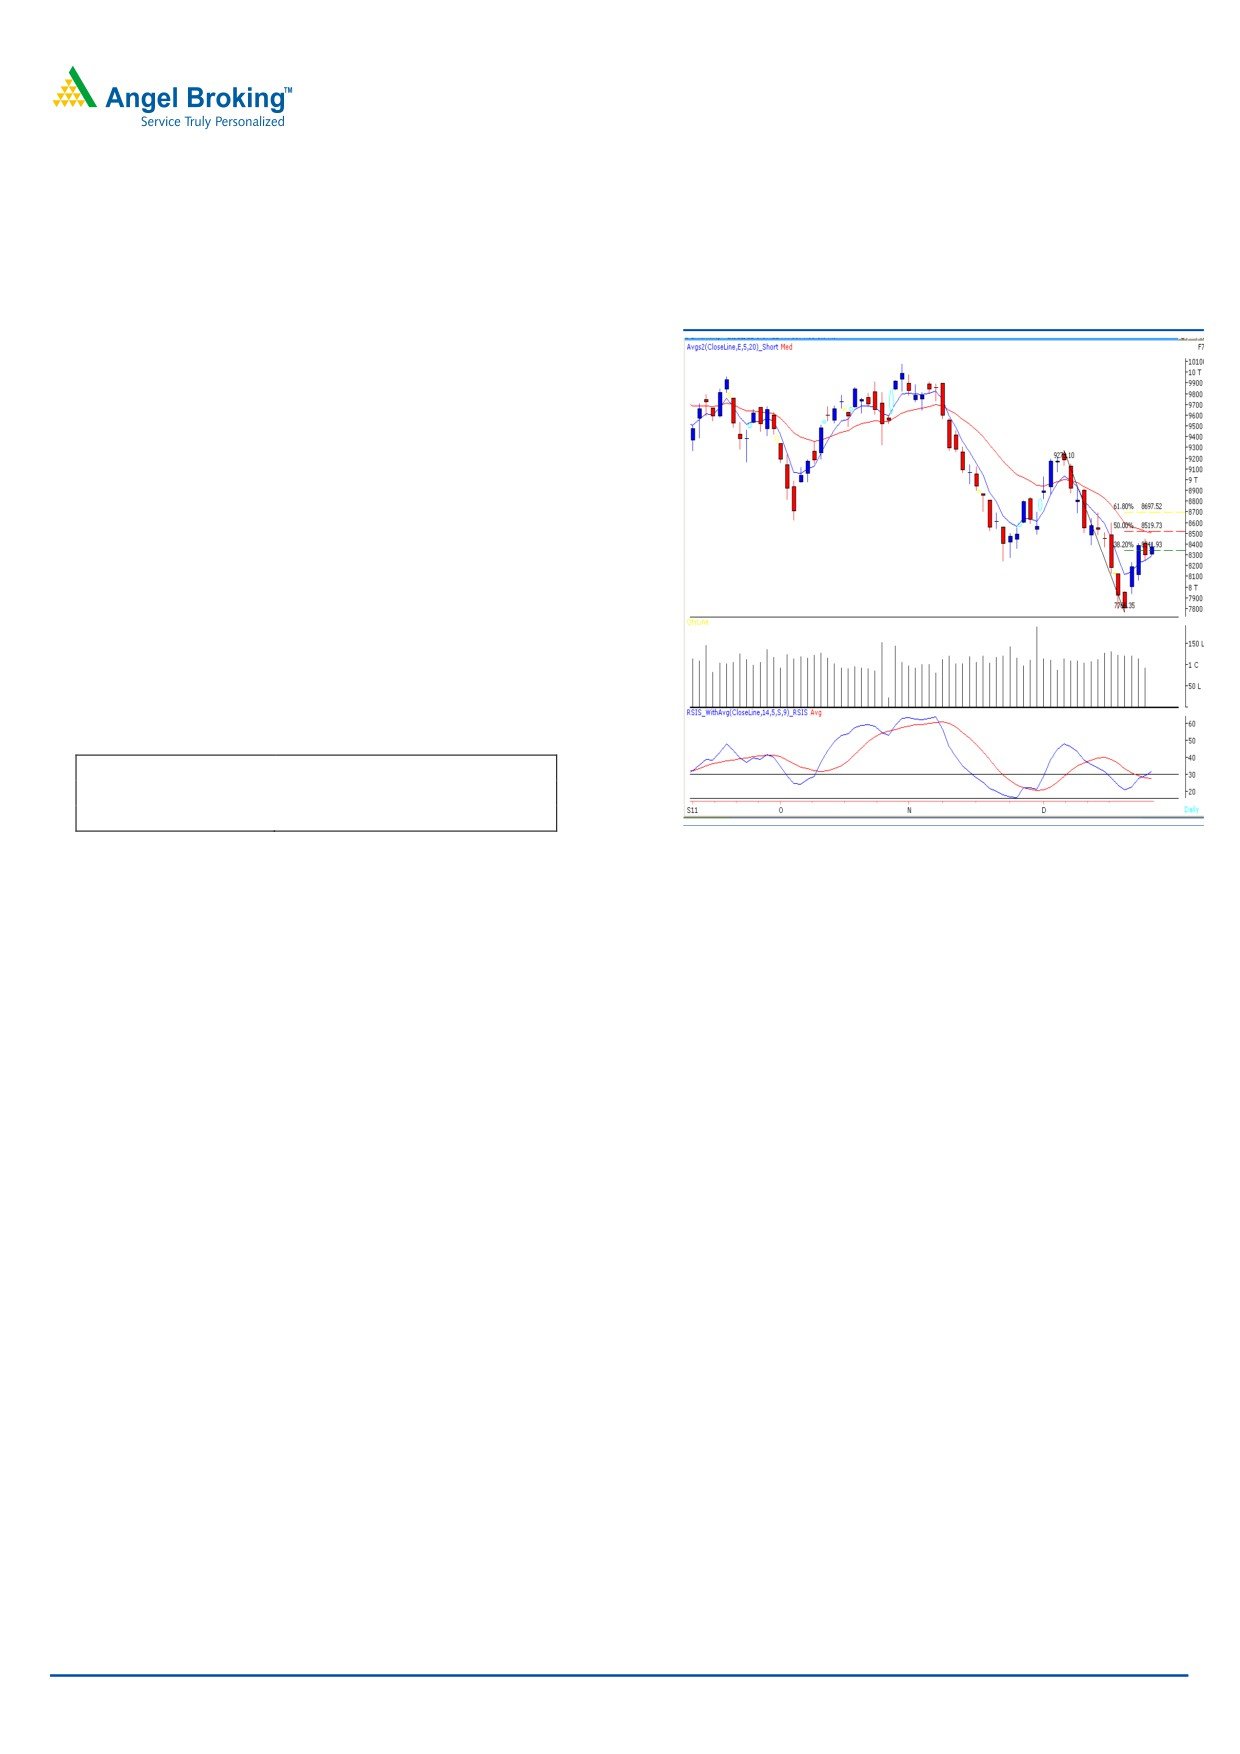
Bank Nifty Outlook - (8375)
Exhibit 2: Bank Nifty Daily Chart
Bank Nifty opened on an optimistic note and traded in a
narrow range throughout the session. The volumes were
lower in comparison to previous sessions. As mentioned
in our previous reports, the positive crossover of
“Stochastic and RSI” momentum oscillator on the daily
chart is still intact. Therefore, if Bank Nifty sustains above
yesterday’s high of 8420 then it is likely to rally towards
8520 - 8570. These levels are near the 50% Fibonacci
retracement of the fall from 9273 - 7766 and “20 SMA”.
Thus we may witness some consolidation near to 8520 -
8570 levels. On the down side, 8250 - 8072 levels may
act as support levels in coming trading session.
Actionable points:
View
Neutral
Resistance Level
8420 - 8520 - 8570
Support Level
8250 - 8072
Source: Falcon
For Private Circulation Only |
2
Technical Research | December 27, 2011
Positive Bias:
Expected
Stock Name
CMP
5 Day EMA
20 Day EMA
Remarks
Target
Tata Steel
357.65
355
376
375
View will change below 345
ICICI Bank
729.60
714.1
724.5
759
View will change below 714
Negative Bias:
Expected
Stock Name
CMP
5 Day EMA
20 Day EMA
Remarks
Target
Orchid Chem
138.60
138.6
147.2
127
View will change above 145
For Private Circulation Only |
3
Technical Research | December 27, 2011
Daily Pivot Levels for Nifty 50 Stocks
SCRIPS
S2
S1
PIVOT
R1
R2
SENSEX
15,673
15,822
15,910
16,059
16,147
NIFTY
4,692
4,736
4,761
4,805
4,831
BANKNIFTY
8,235
8,305
8,362
8,432
8,490
ACC
1,121
1,140
1,152
1,171
1,183
AMBUJACEM
153
157
159
162
164
AXISBANK
853
862
877
886
901
BAJAJ-AUTO
1,582
1,597
1,608
1,622
1,634
BHARTIARTL
329
337
341
349
354
BHEL
237
240
244
248
251
BPCL
489
495
505
511
521
CAIRN
312
318
321
326
330
CIPLA
324
326
329
331
334
DLF
192
194
196
199
200
DRREDDY
1,558
1,571
1,589
1,602
1,620
GAIL
383
389
394
400
404
HCLTECH
380
384
391
395
401
HDFC
652
659
665
672
677
HDFCBANK
434
439
442
447
450
HEROMOTOCO
1,807
1,864
1,903
1,960
1,998
HINDALCO
119
120
121
122
124
HINDUNILVR
409
414
417
422
426
ICICIBANK
712
721
728
737
743
IDFC
98
99
100
101
102
INFY
2,655
2,716
2,751
2,812
2,847
ITC
201
203
205
206
208
JINDALSTEL
476
482
487
494
499
JPASSOCIAT
53
54
55
56
57
KOTAKBANK
452
457
461
467
471
LT
1,005
1,015
1,025
1,035
1,044
M&M
687
695
700
707
713
MARUTI
949
959
975
985
1,001
NTPC
158
159
160
162
163
ONGC
259
261
262
264
265
PNB
799
806
815
822
832
POWERGRID
100
100
101
101
102
RANBAXY
389
395
400
407
412
RCOM
66
68
69
71
72
RELCAPITAL
241
246
250
255
259
RELIANCE
738
749
757
769
776
RELINFRA
355
361
366
372
377
RPOWER
71
72
74
75
76
SAIL
79
80
81
81
82
SBIN
1,628
1,647
1,661
1,680
1,694
SESAGOA
159
161
163
166
167
SIEMENS
637
645
658
666
679
STER
91
92
93
94
95
SUNPHARMA
483
492
498
507
513
SUZLON
18
19
19
20
20
TATAMOTORS
183
185
187
189
190
TATAPOWER
87
88
88
89
90
TATASTEEL
344
351
355
362
367
TCS
1,141
1,165
1,177
1,201
1,214
WIPRO
398
402
407
411
416
Technical Research Team
For Private Circulation Only |
4
Technical Report
RESEARCH TEAM
Shardul Kulkarni
Head - Technicals
Sameet Chavan
Technical Analyst
Sacchitanand Uttekar
Technical Analyst
Mehul Kothari
Technical Analyst
Ankur Lakhotia
Technical Analyst
Research Team: 022-3952 6600
DISCLAIMER: This document is not for public distribution and has been furnished to you solely for your information and must not
be reproduced or redistributed to any other person. Persons into whose possession this document may come are required to observe
these restrictions.
Opinion expressed is our current opinion as of the date appearing on this material only. While we endeavor to update on a
reasonable basis the information discussed in this material, there may be regulatory, compliance, or other reasons that prevent us
from doing so. Prospective investors and others are cautioned that any forward-looking statements are not predictions and may be
subject to change without notice. Our proprietary trading and investment businesses may make investment decisions that are
inconsistent with the recommendations expressed herein.
The information in this document has been printed on the basis of publicly available information, internal data and other reliable
sources believed to be true and are for general guidance only. While every effort is made to ensure the accuracy and completeness of
information contained, the company takes no guarantee and assumes no liability for any errors or omissions of the information. No
one can use the information as the basis for any claim, demand or cause of action.
Recipients of this material should rely on their own investigations and take their own professional advice. Each recipient of this
document should make such investigations as it deems necessary to arrive at an independent evaluation of an investment in the
securities of companies referred to in this document (including the merits and risks involved), and should consult their own advisors to
determine the merits and risks of such an investment. Price and value of the investments referred to in this material may go up or
down. Past performance is not a guide for future performance. Certain transactions - futures, options and other derivatives as well as
non-investment grade securities - involve substantial risks and are not suitable for all investors. Reports based on technical analysis
centers on studying charts of a stock's price movement and trading volume, as opposed to focusing on a company's fundamentals
and as such, may not match with a report on a company's fundamentals.
We do not undertake to advise you as to any change of our views expressed in this document. While we would endeavor to update
the information herein on a reasonable basis, Angel Broking, its subsidiaries and associated companies, their directors and
employees are under no obligation to update or keep the information current. Also there may be regulatory, compliance, or other
reasons that may prevent Angel Broking and affiliates from doing so. Prospective investors and others are cautioned that any
forward-looking statements are not predictions and may be subject to change without notice.
Angel Broking Limited and affiliates, including the analyst who has issued this report, may, on the date of this report, and from time
to time, have long or short positions in, and buy or sell the securities of the companies mentioned herein or engage in any other
transaction involving such securities and earn brokerage or compensation or act as advisor or have other potential conflict of interest
with respect to company/ies mentioned herein or inconsistent with any recommendation and related information and opinions.
Angel Broking Limited and affiliates may seek to provide or have engaged in providing corporate finance, investment banking or
other advisory services in a merger or specific transaction to the companies referred to in this report, as on the date of this report or
in the past.
Sebi Registration No : INB 010996539
For Private Circulation Only |