Daily Technical Report
August 27, 2012
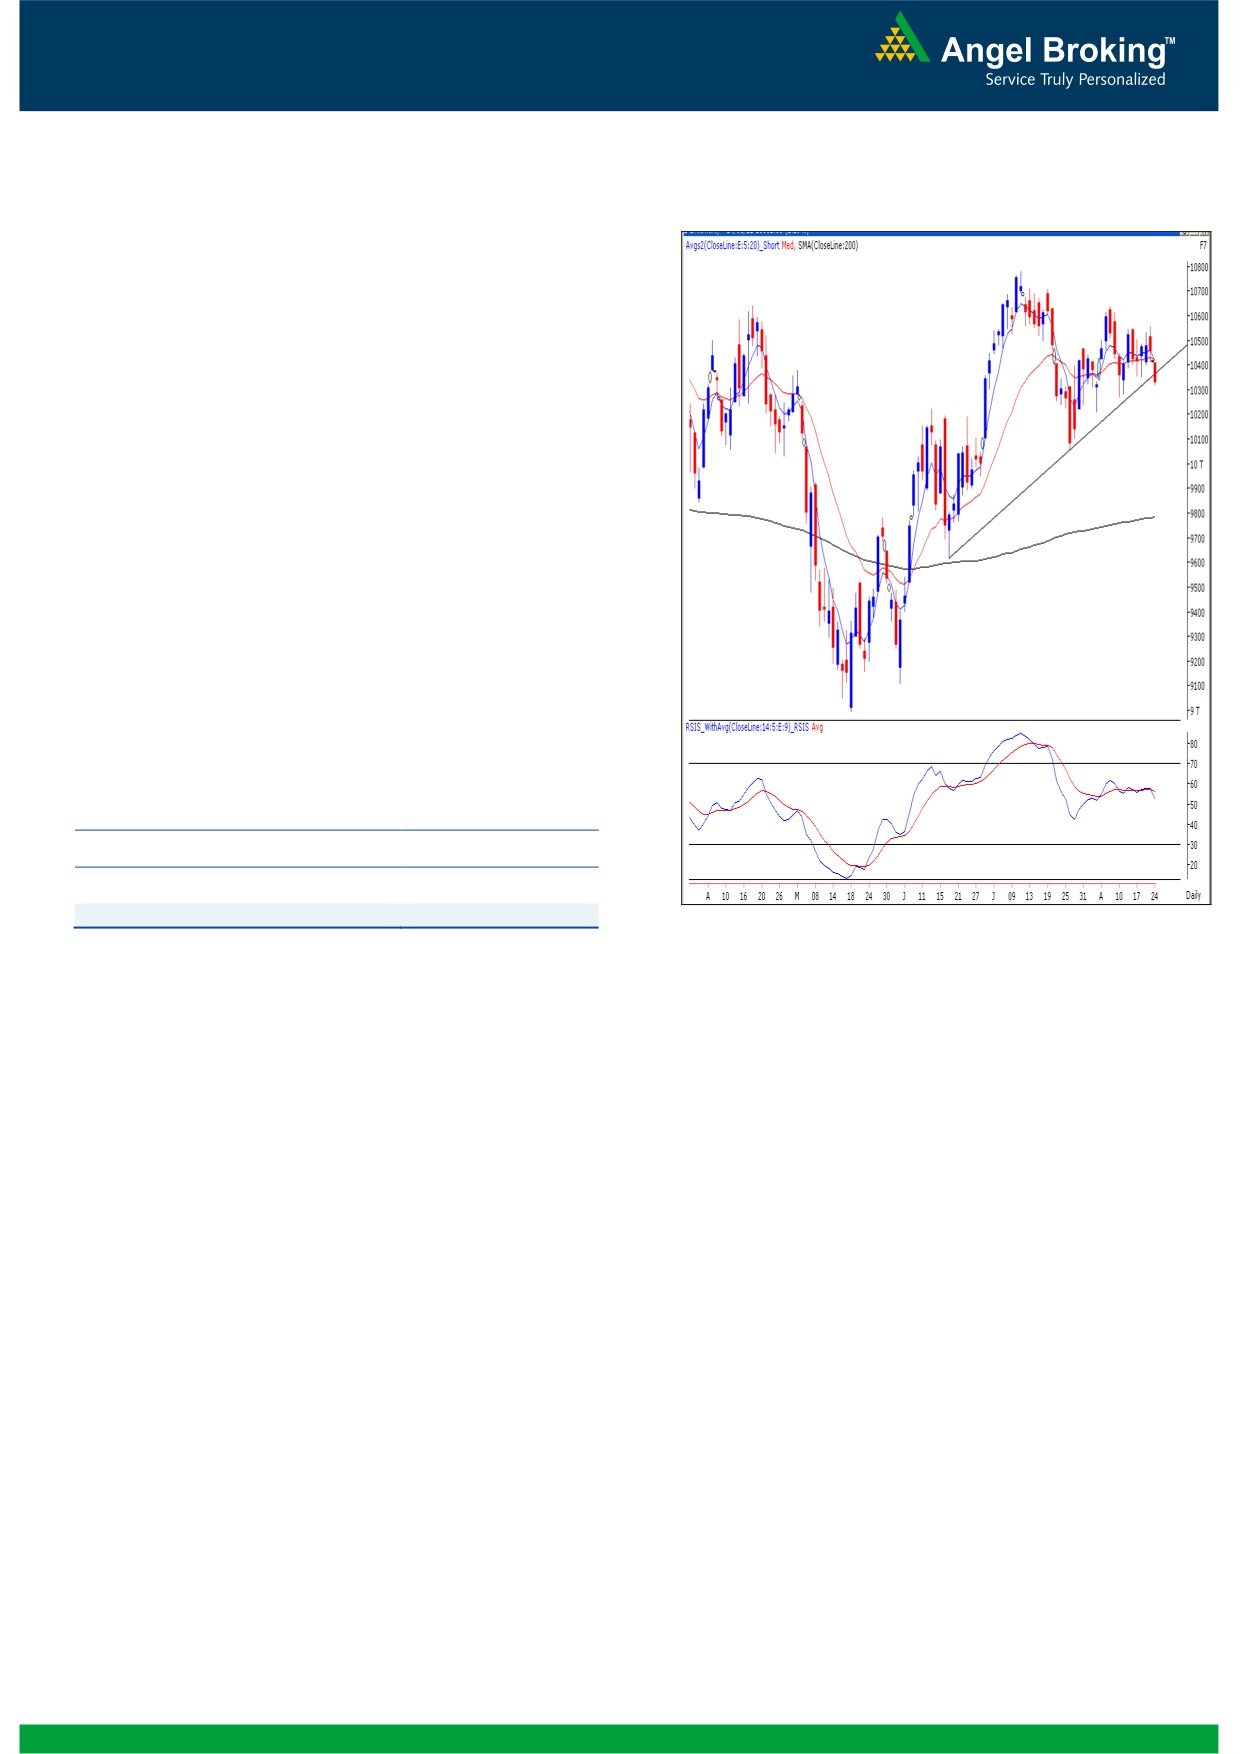
Exhibit 1: Nifty Daily Chart
Sensex (17783) / NIFTY (5387)
On Friday, our benchmark indices opened in red on
the back of weak Asian cues and traded in a narrow
range to close flat below 5400 mark. On sectoral
front, Realty, Banking and Power stocks corrected
heavily during Friday’s session; whereas FMCG,
Healthcare and Auto counters ended with marginal
gains. The advance to decline ratio was strongly in
favor of declining counters (A=1185 D=1634)
Formation
On the weekly chart, the indices have closed
above the “Downward Sloping Trend Line”
resistance around
17650/
5370 formed by
joining the highs of 21109 / 6339 (November 5,
2010) - 18524 / 5630 (February 24, 2012).
The ’20-day EMA’ and the ’200-day SMA’ are
placed at 17554 / 5324 and 16900 / 5110
levels, respectively.
Looking at the “Line Chart” it is clear that indices
Source: Falcon
have now confirmed the ‘Higher Top - Higher
Bottom’ formation on the weekly chart after
Actionable points:
August 28, 2009.
The daily momentum oscillators viz., the RSI and
View
Neutral
the Stochastic are signaling a negative crossover.
Resistance Levels
5400 - 5449
The weekly chart candle resembles a ‘Shooting
Support Levels
5370 - 5340
Star’ pattern.
In addition, the momentum oscillators on daily chart
Trading strategy:
are negatively poised. Thus, we are of the opinion
The positive streak continues as our benchmark
that if indices sustain below this week’s low of 17705
indices have posted a close in the green territory for
/ 5368, then we may witness a short term loss of
the fourth consecutive week. Looking at the weekly
current positive momentum and indices then may slip
‘Line chart’, we can infer that indices have now
towards 17450 - 17285 / 5290 - 5240 levels.
confirmed a ‘Higher Top Higher Bottom’ formation
Conversely, a sustainable move beyond 17973 /
along with the breakout from “Downward Sloping
5449 level would augment the current positive
Trend Line” resistance around 17650/ 5370 formed
momentum and then indices may rally towards
by joining the highs 21109 / 6339 (November 5,
18050 - 18524 / 5500 - 5630 levels.
2010)
-
18524
/
5630 (February
24,
2012).
However, the weekly chart candlestick
pattern
resembles a SHOOTING STAR. Also, at this juncture,
we are observing a cluster of narrow range body
formations in the daily chart, which signify uncertainty
among market participants.
1
Daily Technical Report
August 27, 2012
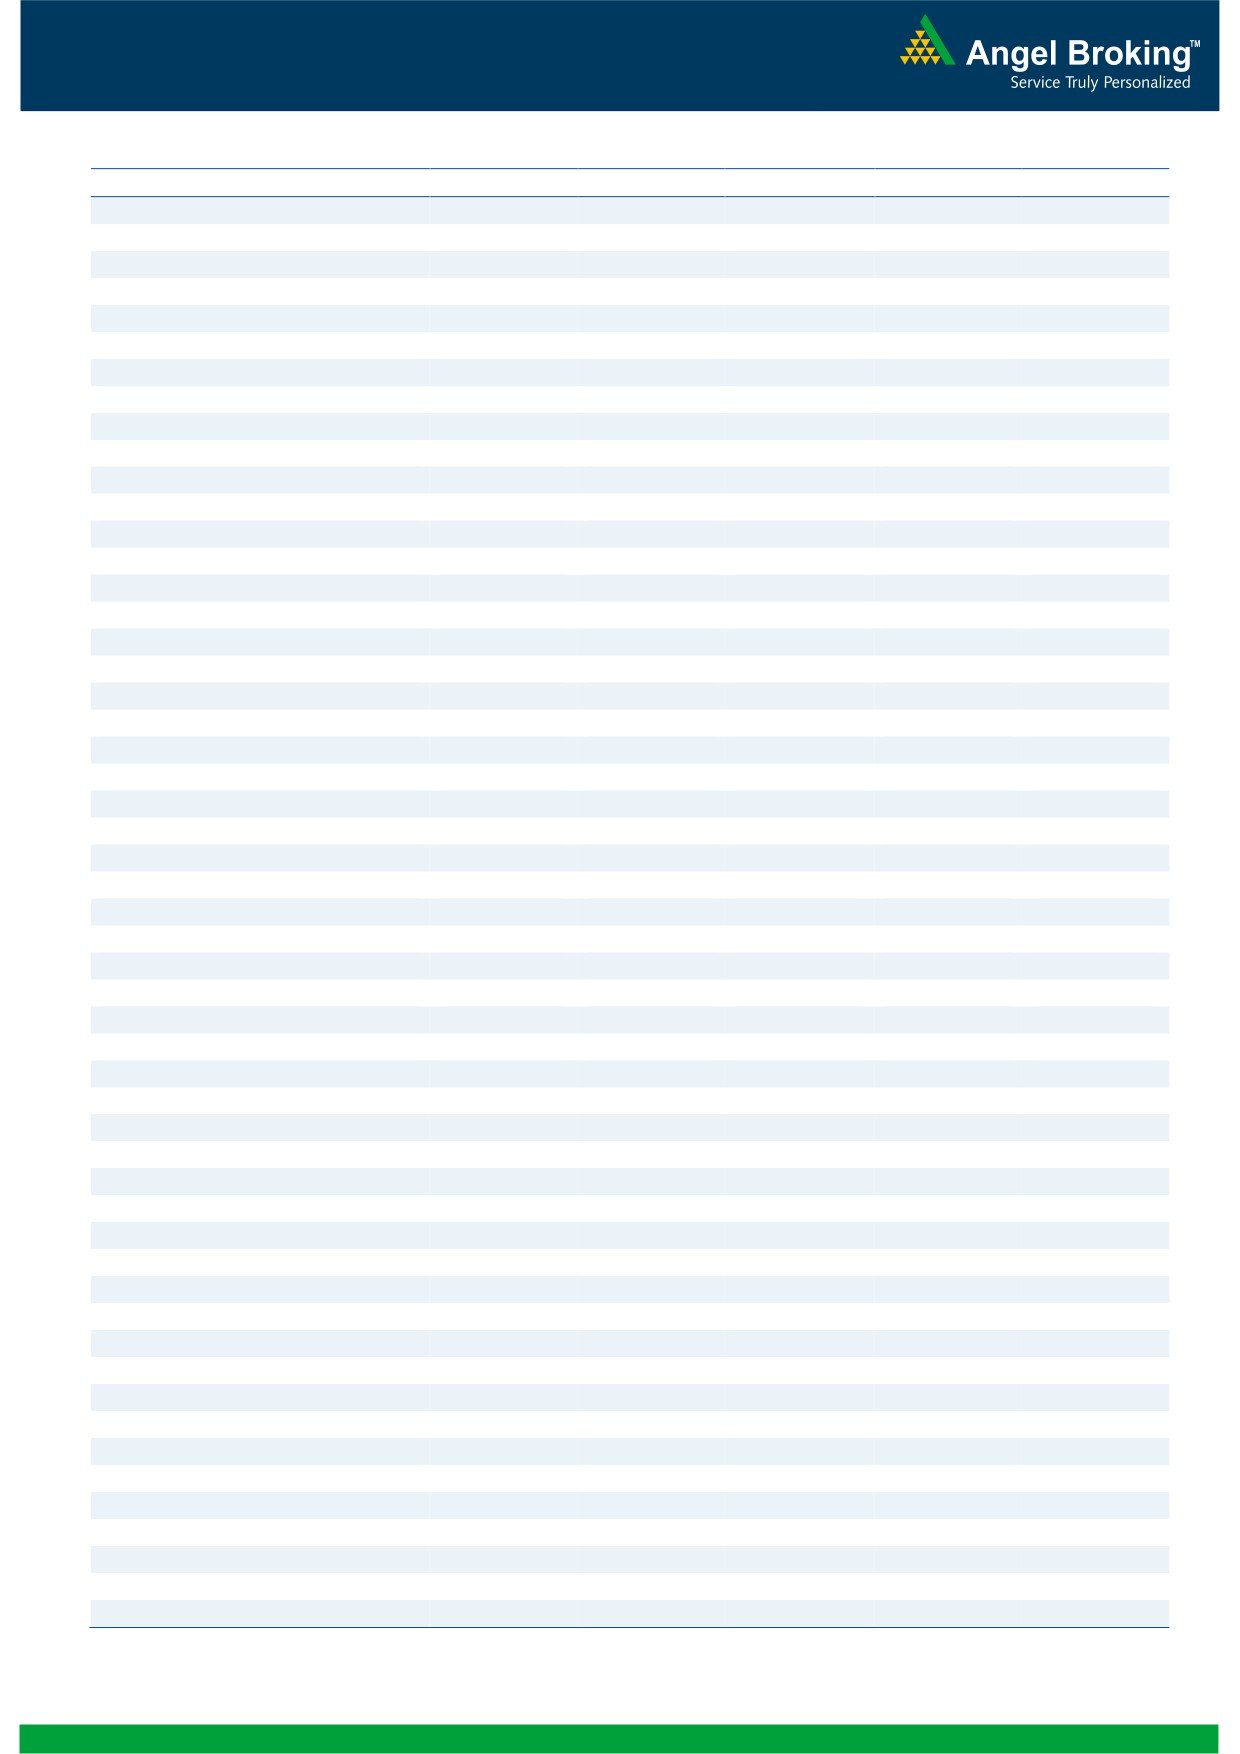
Exhibit 2: Bank Nifty Daily Chart
Bank Nifty Outlook - (10333)
On Friday, Bank Nifty opened with a downside gap
and selling pressure throughout the day led the index
to close near the lowest point of the day. We are now
witnessing an upward sloping trend line breakdown at
10350 level. The mildly bullish outlook due to the
“Tweezer Bottom” candlestick formation mentioned in
our earlier reports has been negated as the index has
closed below the
10354 level. The momentum
oscillators on the daily chart are negatively poised.
Considering the bigger picture on the weekly chart,
the index continues to be in the mentioned range of
10641 - 10240. The outlook for day traders would
be that if the index sustains below Friday’s low of
10318 then it is likely to drift towards 10240 -
10194. On the upside 10394 - 10412 levels are
likely to act as resistance in coming trading session.
Actionable points:
View
Negative Below 10318
Expected Targets
10240 - 10194
Resistance Levels
10394 - 10412
Source: Falcon
2
Daily Technical Report
August 27, 2012
Daily Pivot Levels for Nifty 50 Stocks
SCRIPS
S2
S1
PIVOT
R1
R2
SENSEX
17,680
17,732
17,777
17,829
17,874
NIFTY
5,357
5,372
5,386
5,401
5,414
BANKNIFTY
10,261
10,297
10,355
10,391
10,448
ACC
1,322
1,330
1,337
1,345
1,352
AMBUJACEM
187
188
190
192
194
ASIANPAINT
3,632
3,654
3,673
3,695
3,714
AXISBANK
1,054
1,065
1,076
1,087
1,099
BAJAJ-AUTO
1,679
1,695
1,706
1,722
1,733
BANKBARODA
634
639
644
649
654
BHARTIARTL
242
245
248
251
254
BHEL
225
228
231
234
237
BPCL
344
349
354
359
364
CAIRN
339
341
343
345
348
CIPLA
359
363
365
369
372
COALINDIA
352
360
366
373
379
DLF
202
205
210
212
217
DRREDDY
1,654
1,666
1,674
1,686
1,694
GAIL
361
363
366
368
371
GRASIM
2,984
3,008
3,024
3,047
3,064
HCLTECH
553
555
557
559
561
HDFC
705
714
722
731
739
HDFCBANK
590
593
597
600
604
HEROMOTOCO
1,920
1,928
1,936
1,945
1,953
HINDALCO
109
110
111
112
114
HINDUNILVR
509
514
521
525
532
ICICIBANK
940
947
959
967
979
IDFC
138
140
142
144
146
INFY
2,421
2,433
2,446
2,457
2,470
ITC
260
263
265
267
269
JINDALSTEL
387
392
401
406
414
JPASSOCIAT
74
75
76
76
77
KOTAKBANK
576
581
586
590
595
LT
1,396
1,408
1,420
1,432
1,444
M&M
750
756
760
767
771
MARUTI
1,149
1,170
1,181
1,202
1,213
NTPC
166
167
169
171
172
ONGC
278
282
286
290
293
PNB
705
708
712
715
719
POWERGRID
115
116
117
118
119
RANBAXY
535
543
548
557
562
RELIANCE
769
776
785
792
801
RELINFRA
475
481
489
495
504
SAIL
83
83
84
84
85
SBIN
1,873
1,884
1,894
1,904
1,914
SESAGOA
185
189
191
194
196
SIEMENS
649
659
667
677
685
STER
108
110
112
114
115
SUNPHARMA
657
661
665
670
674
TATAMOTORS
238
242
245
249
252
TATAPOWER
97
98
99
99
100
TATASTEEL
380
384
390
394
400
TCS
1,306
1,314
1,321
1,330
1,337
WIPRO
358
361
364
368
370
3
Daily Technical Report
August 27, 2012
Research Team Tel: 022 - 39357800
DISCLAIMER
This document is solely for the personal information of the recipient, and must not be singularly used as the basis of any investment
decision. Nothing in this document should be construed as investment or financial advice. Each recipient of this document should make
such investigations as they deem necessary to arrive at an independent evaluation of an investment in the securities of the companies
referred to in this document (including the merits and risks involved), and should consult their own advisors to determine the merits and
risks of such an investment.
Angel Broking Limited, its affiliates, directors, its proprietary trading and investment businesses may, from time to time, make
investment decisions that are inconsistent with or contradictory to the recommendations expressed herein. The views contained in this
document are those of the analyst, and the company may or may not subscribe to all the views expressed within.
Reports based on technical and derivative analysis center on studying charts of a stock's price movement, outstanding positions and
trading volume, as opposed to focusing on a company's fundamentals and, as such, may not match with a report on a company's
fundamentals.
The information in this document has been printed on the basis of publicly available information, internal data and other reliable
sources believed to be true, but we do not represent that it is accurate or complete and it should not be relied on as such, as this
document is for general guidance only. Angel Broking Limited or any of its affiliates/ group companies shall not be in any way
responsible for any loss or damage that may arise to any person from any inadvertent error in the information contained in this report.
Angel Broking Limited has not independently verified all the information contained within this document. Accordingly, we cannot testify,
nor make any representation or warranty, express or implied, to the accuracy, contents or data contained within this document. While
Angel Broking Limited endeavours to update on a reasonable basis the information discussed in this material, there may be regulatory,
compliance, or other reasons that prevent us from doing so.
This document is being supplied to you solely for your information, and its contents, information or data may not be reproduced,
redistributed or passed on, directly or indirectly.
Angel Broking Limited and its affiliates may seek to provide or have engaged in providing corporate finance, investment banking or
other advisory services in a merger or specific transaction to the companies referred to in this report, as on the date of this report or in
the past.
Neither Angel Broking Limited, nor its directors, employees or affiliates shall be liable for any loss or damage that may arise from or in
connection with the use of this information.
Note: Please refer to the important `Stock Holding Disclosure' report on the Angel website (Research Section). Also, please refer to the
latest update on respective stocks for the disclosure status in respect of those stocks. Angel Broking Limited and its affiliates may have
investment positions in the stocks recommended in this report.
Research Team
Shardul Kulkarni
-
Head - Technicals
Sameet Chavan
-
Technical Analyst
Sacchitanand Uttekar
-
Technical Analyst
Mehul Kothari
-
Technical Analyst
Ankur Lakhotia
-
Technical Analyst
Angel Broking Pvt. Ltd.
Registered Office: G-1, Ackruti Trade Centre, Rd. No. 7, MIDC, Andheri (E), Mumbai - 400 093.
Corporate Office: 6th Floor, Ackruti Star, MIDC, Andheri (E), Mumbai - 400 093. Tel: (022) 3952 6600
Sebi Registration No: INB 010996539
4