Technical Research | February 27, 2012
Daily Technical Report
Sensex (17924) / NIFTY (5429)
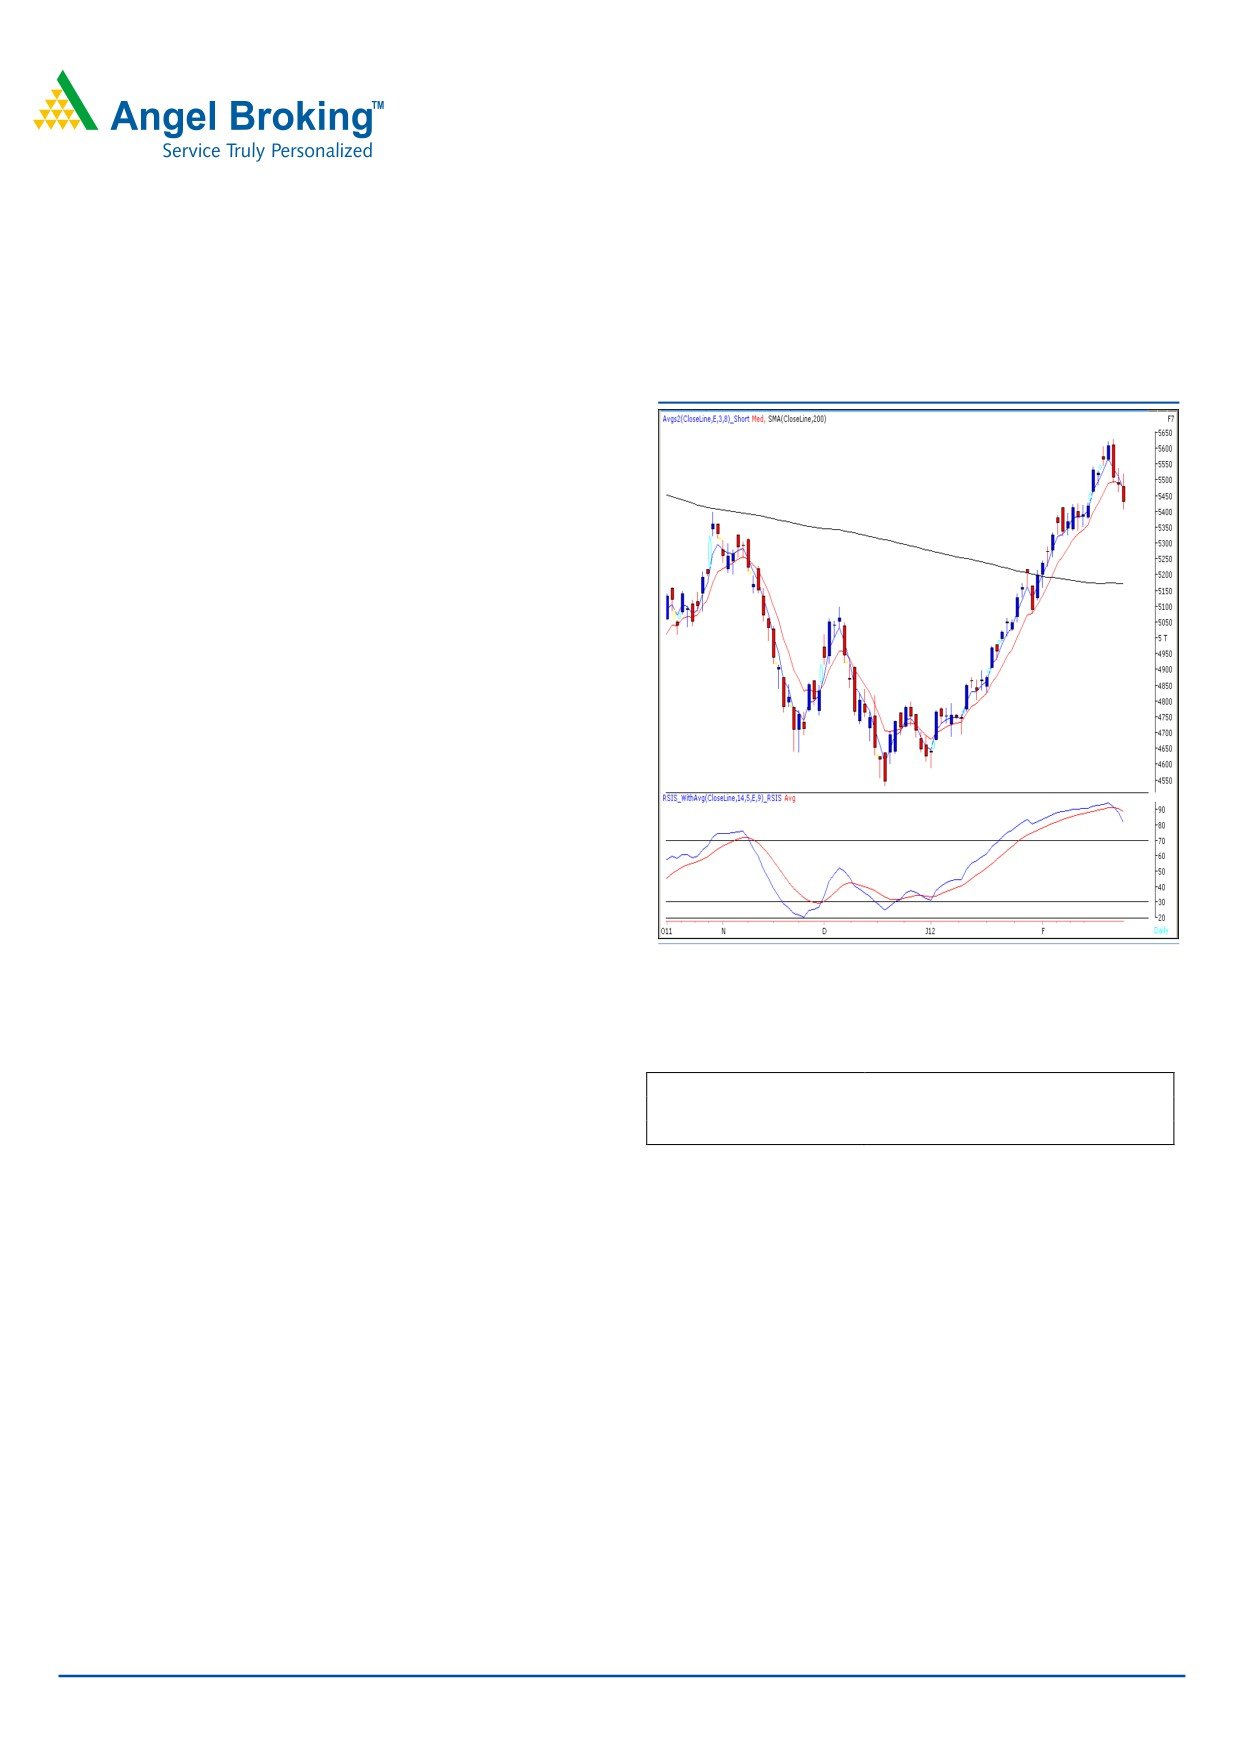
Exhibit 1: Nifty Daily Chart
On Friday, markets opened on a negative note and strong
selling pressure in the later half led indices to close deep in
red. On the sectoral front, Capital Goods, Realty and
Banking counters were among the major losers, whereas
Metal and Teck sectors ended on a gaining side. The
advance to decline ratio was strongly in favor of declining
Formation:
• The 200-day SMA and 20-day EMA have now shifted to
17200 / 5170 and 17720 / 5370, respectively.
• The “RSI-Smoothened” oscillator and “3 & 8 EMA” on
the daily chart have given a negative crossover.
• The weekly “Stochastic” oscillator is negatively poised.
• The
61.8% Fibonacci retracement level of the fall
21109 / 6339 (November 5, 2010) to 15135 / 4531
Source: Falcon
(December 23, 2011) is around 18827 / 5645.
Actionable points:
Trading strategy:
View
Neutral
Last week indices corrected after nearing their resistance
Resistance Levels
5522 - 5561
zone of 18756 / 5645. We are now observing that this
Support levels
5405 - 5370 - 5300
resistance zone almost coincides with the 61.8% Fibonacci
Retracement level of the fall from 21109 / 6339 (November
Conversely, the immediate resistance is at 18200 / 5522
5, 2010) to 15135 / 4531 (December 23, 2011). Further,
level. A move beyond this level may push indices higher
we are observing a negative placement of “Daily RSI-
to test 18293 - 18524 / 5561 - 5630 levels. In the short
Smoothened”, “3 & 8 daily EMA” and “Weekly Stochastic”
term, markets have a stiff resistance zone of 18756 -
oscillators. This indicates possibility of a further correction or
18524 / 5645 - 5630 levels. If indices manage to cross
consolidation. At present, indices have a decent support
this resistance zone then they are likely to test important
zone around its “Daily 20-EMA” level of 17720 / 5370. The
resistance of 18945 / 5702 level.
negative impact of above mentioned technical observations
will be seen only if indices sustain below 17720 / 5370
We reiterate that traders should adopt cautious
level. In this scenario, the possibility of testing
17500 -
approach and trade with strict stop-loss.
17200 / 5300 - 5200 levels cannot be ruled out.
For Private Circulation Only |
1
Technical Research | February 27, 2012
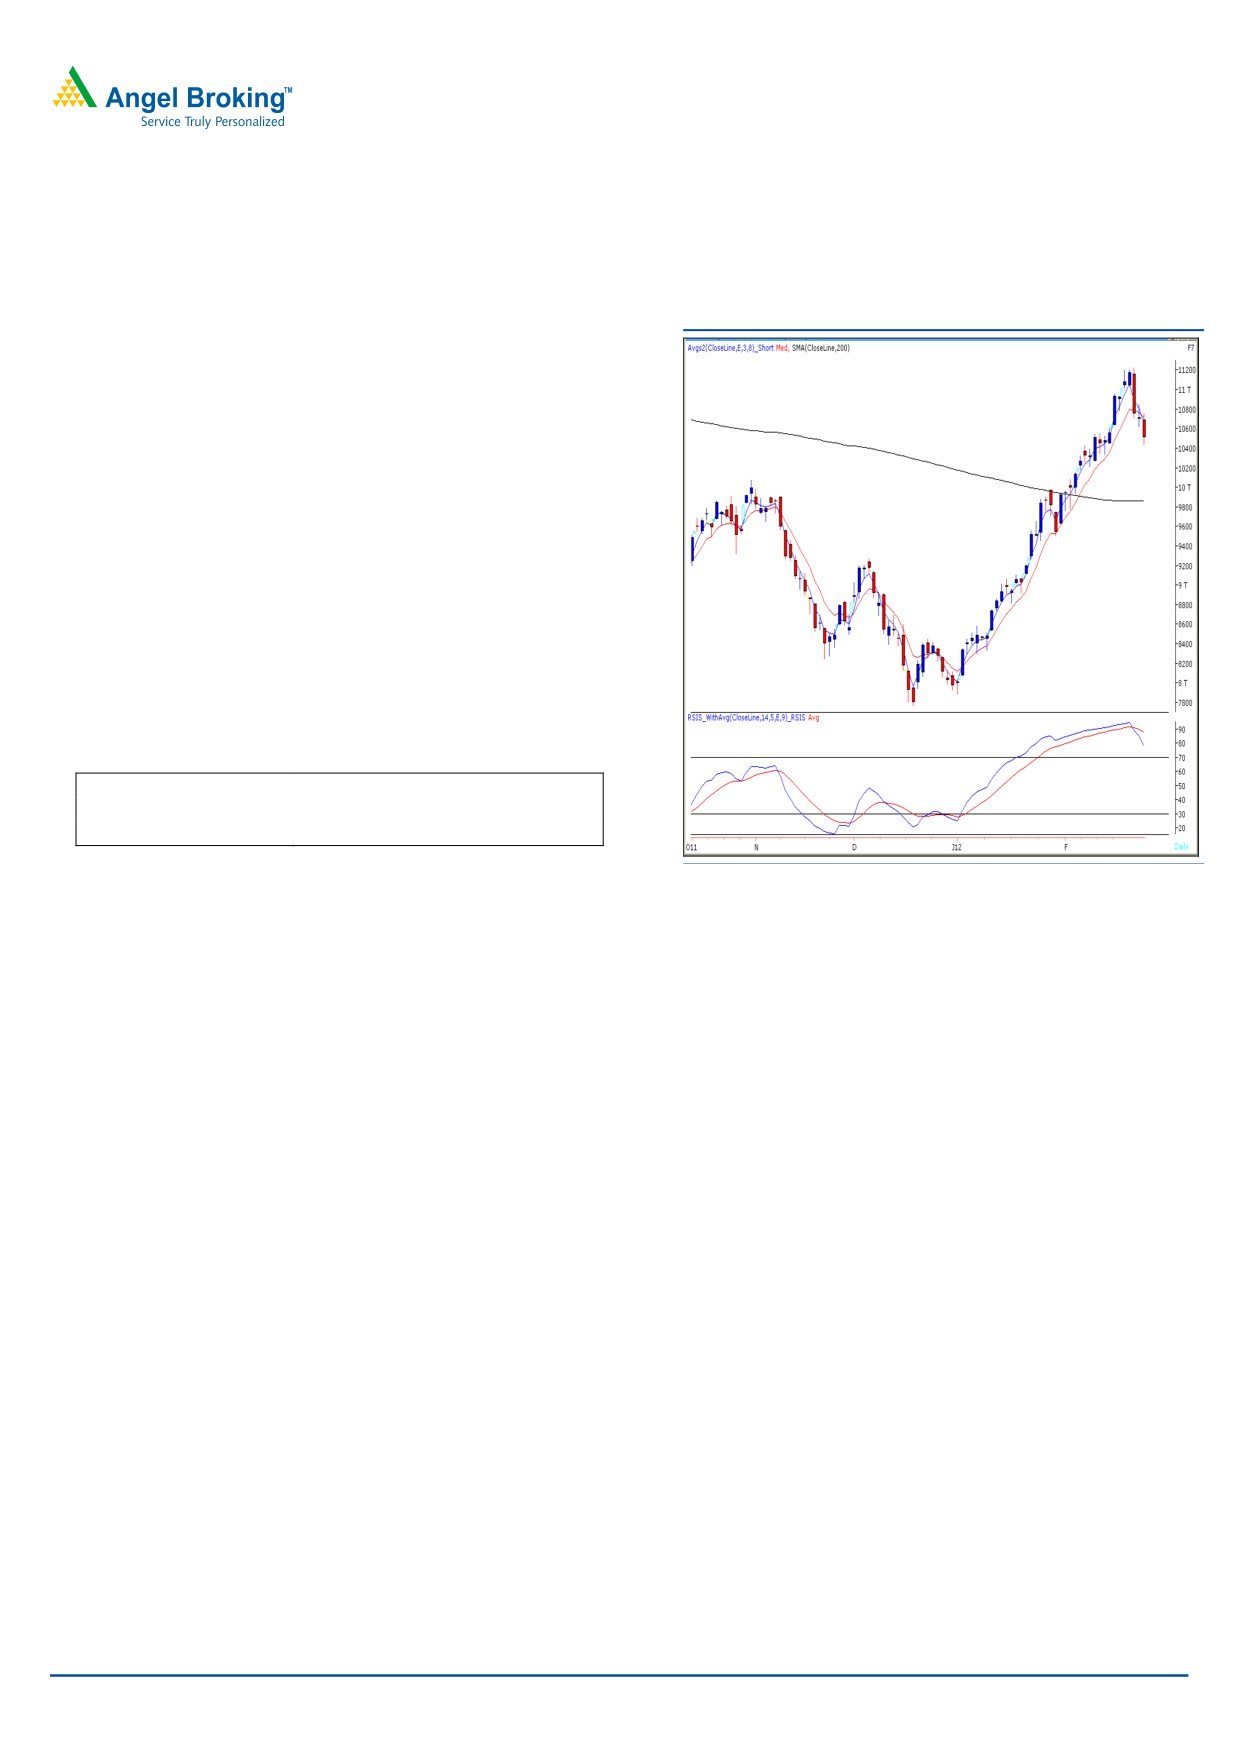
Bank Nifty Outlook - (10507)
Exhibit 2: Bank Nifty Daily Chart
On Friday, Bank Nifty opened flat but traded with
negative bias throughout the day to close in red. Selling
pressure intensified below the mentioned support of
10630 and Bank Nifty ended with a loss of almost 2%.
On the Daily chart, we are witnessing negative crossover
of “3 & 8” EMA which suggests the correction could
continue. However, the 20 Day EMA placed at 10390
could act as a crucial support for the index. Therefore,
only if Bank Nifty sustains below 10390 then we may
witness further selling pressure till 10340 - 10220 levels.
On the upside, 10590 - 10680 levels could act as
resistance for the day.
Actionable points:
View
Bearish below 10390
Expected Target
10340 - 10220
Resistance Levels
10590 - 10680
Source: Falcon
For Private Circulation Only |
2
Technical Research | February 27, 2012
Positive Bias:
Expected
Stock Name
CMP
5 Day EMA
20 Day EMA
Remarks
Target
COLPAL
1056.5
1028.3
1010
1115
View will change below 1010
For Private Circulation Only |
3
Technical Research | February 27, 2012
Daily Pivot Levels for Nifty 50 Stocks
SCRIPS
S2
S1
PIVOT
R1
R2
SENSEX
17,641
17,782
17,990
18,132
18,339
NIFTY
5,337
5,383
5,452
5,499
5,568
BANKNIFTY
10,244
10,375
10,567
10,699
10,891
ACC
1,217
1,243
1,281
1,307
1,345
AMBUJACEM
156
158
161
163
166
AXISBANK
1,132
1,158
1,202
1,228
1,272
BAJAJ-AUTO
1,718
1,741
1,775
1,798
1,832
BHARTIARTL
334
338
343
347
352
BHEL
291
298
308
314
324
BPCL
635
645
657
668
680
CAIRN
370
376
383
389
397
CIPLA
309
312
315
318
321
COALINDIA
316
322
326
332
336
DLF
216
221
231
236
245
DRREDDY
1,605
1,617
1,634
1,646
1,663
GAIL
369
372
376
379
383
HCLTECH
474
484
492
501
509
HDFC
645
661
673
689
701
HDFCBANK
505
515
525
535
545
HEROMOTOCO
2,028
2,050
2,080
2,102
2,131
HINDALCO
143
146
148
151
154
HINDUNILVR
380
383
387
390
393
ICICIBANK
905
919
931
944
957
IDFC
132
136
142
146
151
INFY
2,898
2,923
2,949
2,974
2,999
ITC
207
208
210
211
212
JINDALSTEL
595
604
611
620
628
JPASSOCIAT
72
73
75
76
78
KOTAKBANK
529
540
558
569
587
LT
1,292
1,320
1,369
1,397
1,446
M&M
711
720
730
740
749
MARUTI
1,268
1,277
1,287
1,295
1,305
NTPC
61
122
61
122
61
ONGC
274
279
287
292
299
PNB
923
944
982
1,003
1,041
POWERGRID
112
113
114
115
117
RANBAXY
413
421
433
440
452
RCOM
89
91
95
97
100
RELIANCE
798
809
825
836
853
RELINFRA
556
570
592
607
629
RPOWER
113
116
119
122
125
SAIL
102
104
105
107
108
SBIN
2,127
2,166
2,235
2,274
2,343
SESAGOA
218
222
228
232
238
SIEMENS
264
528
264
528
264
STER
114
116
119
121
123
SUNPHARMA
532
540
546
554
560
SUZLON
25
26
27
28
29
TATAMOTORS
258
262
267
270
275
TATAPOWER
109
111
113
116
117
TATASTEEL
460
468
474
482
489
TCS
1,246
1,258
1,269
1,281
1,293
WIPRO
428
433
440
445
453
Technical Research Team
For Private Circulation Only |
4
Technical Report
RESEARCH TEAM
Shardul Kulkarni
Head - Technicals
Sameet Chavan
Technical Analyst
Sacchitanand Uttekar
Technical Analyst
Mehul Kothari
Technical Analyst
Ankur Lakhotia
Technical Analyst
Research Team: 022-3952 6600
DISCLAIMER: This document is not for public distribution and has been furnished to you solely for your information and must not
be reproduced or redistributed to any other person. Persons into whose possession this document may come are required to observe
these restrictions.
Opinion expressed is our current opinion as of the date appearing on this material only. While we endeavor to update on a
reasonable basis the information discussed in this material, there may be regulatory, compliance, or other reasons that prevent us
from doing so. Prospective investors and others are cautioned that any forward-looking statements are not predictions and may be
subject to change without notice. Our proprietary trading and investment businesses may make investment decisions that are
inconsistent with the recommendations expressed herein.
The information in this document has been printed on the basis of publicly available information, internal data and other reliable
sources believed to be true and are for general guidance only. While every effort is made to ensure the accuracy and completeness of
information contained, the company takes no guarantee and assumes no liability for any errors or omissions of the information. No
one can use the information as the basis for any claim, demand or cause of action.
Recipients of this material should rely on their own investigations and take their own professional advice. Each recipient of this
document should make such investigations as it deems necessary to arrive at an independent evaluation of an investment in the
securities of companies referred to in this document (including the merits and risks involved), and should consult their own advisors to
determine the merits and risks of such an investment. Price and value of the investments referred to in this material may go up or
down. Past performance is not a guide for future performance. Certain transactions - futures, options and other derivatives as well as
non-investment grade securities - involve substantial risks and are not suitable for all investors. Reports based on technical analysis
centers on studying charts of a stock's price movement and trading volume, as opposed to focusing on a company's fundamentals
and as such, may not match with a report on a company's fundamentals.
We do not undertake to advise you as to any change of our views expressed in this document. While we would endeavor to update
the information herein on a reasonable basis, Angel Broking, its subsidiaries and associated companies, their directors and
employees are under no obligation to update or keep the information current. Also there may be regulatory, compliance, or other
reasons that may prevent Angel Broking and affiliates from doing so. Prospective investors and others are cautioned that any
forward-looking statements are not predictions and may be subject to change without notice.
Angel Broking Limited and affiliates, including the analyst who has issued this report, may, on the date of this report, and from time
to time, have long or short positions in, and buy or sell the securities of the companies mentioned herein or engage in any other
transaction involving such securities and earn brokerage or compensation or act as advisor or have other potential conflict of interest
with respect to company/ies mentioned herein or inconsistent with any recommendation and related information and opinions.
Angel Broking Limited and affiliates may seek to provide or have engaged in providing corporate finance, investment banking or
other advisory services in a merger or specific transaction to the companies referred to in this report, as on the date of this report or
in the past.
Sebi Registration No : INB 010996539
For Private Circulation Only |