Technical Research | January 27, 2012
Daily Technical Report
Sensex (17077) / NIFTY (5158)
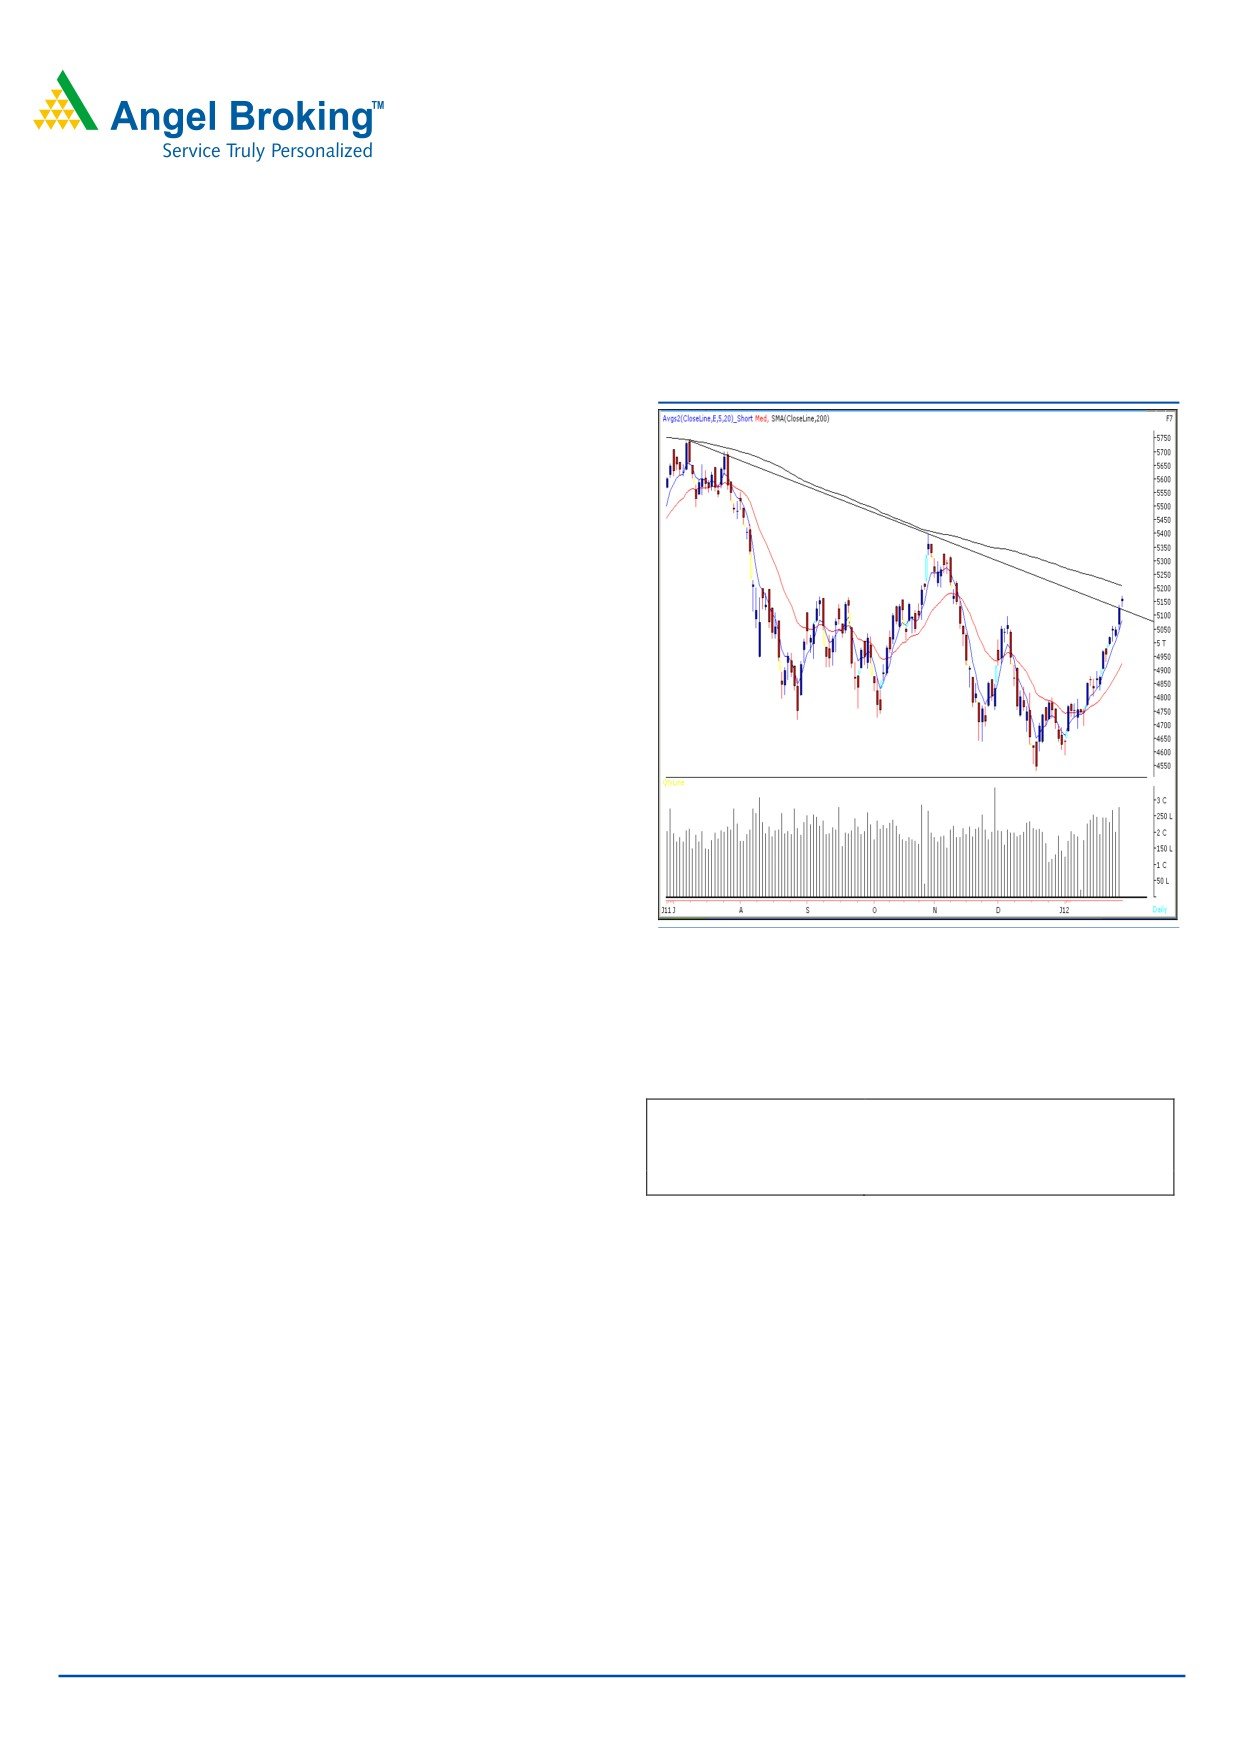
Exhibit 1: Nifty Daily Chart
On Wednesday, markets opened on a higher note for the
second consecutive session. After immense volatility on
account of derivative expiry for the January series, Indices
managed to close marginally above 17000 / 5150 mark.
On the sectoral front, Metal, PSU and Teck counters were
among the major gainers, whereas Capital goods ended
with a marginal loss. The advance to decline ratio was
strongly in favor of advancing counters. (A=1808 D=1040)
Formation:
• We are witnessing a positive crossover on weekly “RSI -
Smoothened” oscillator.
• Indices are now trading above a “Downward Sloping
Trend Line” joining July 8, 2011 high of 19132 / 5740 and
October 20, 2011 high of 17908 / 5400
Source: Falcon
• The 200-day SMA is now placed around 17356 / 5210
level.
Trading strategy:
Actionable points:
View
Bearish
We witnessed a very volatile session on Wednesday due to
Sell Only below
5130
derivative expiry. However, indices maintained their early
Expected target
5080 - 5050
gains and managed to close above the “Downward Sloping
Resistance levels
5174 - 5210
Trend Line” resistance. Thus Indices are likely to test 200-
day SMA placed around 17356 / 5210 level if they manage
to sustain above Wednesday’s high of 17130 / 5174 level.
However, we are now observing a “Narrow range body”
formation on daily chart, which indicates an uncertainty
among the bulls and the bears. Thus, if Wednesday’s low of
17016 / 5130 is violated, then indices are likely to drift
towards 16846 / 5080 level.
For Private Circulation Only |
1
Technical Research | January 27, 2012
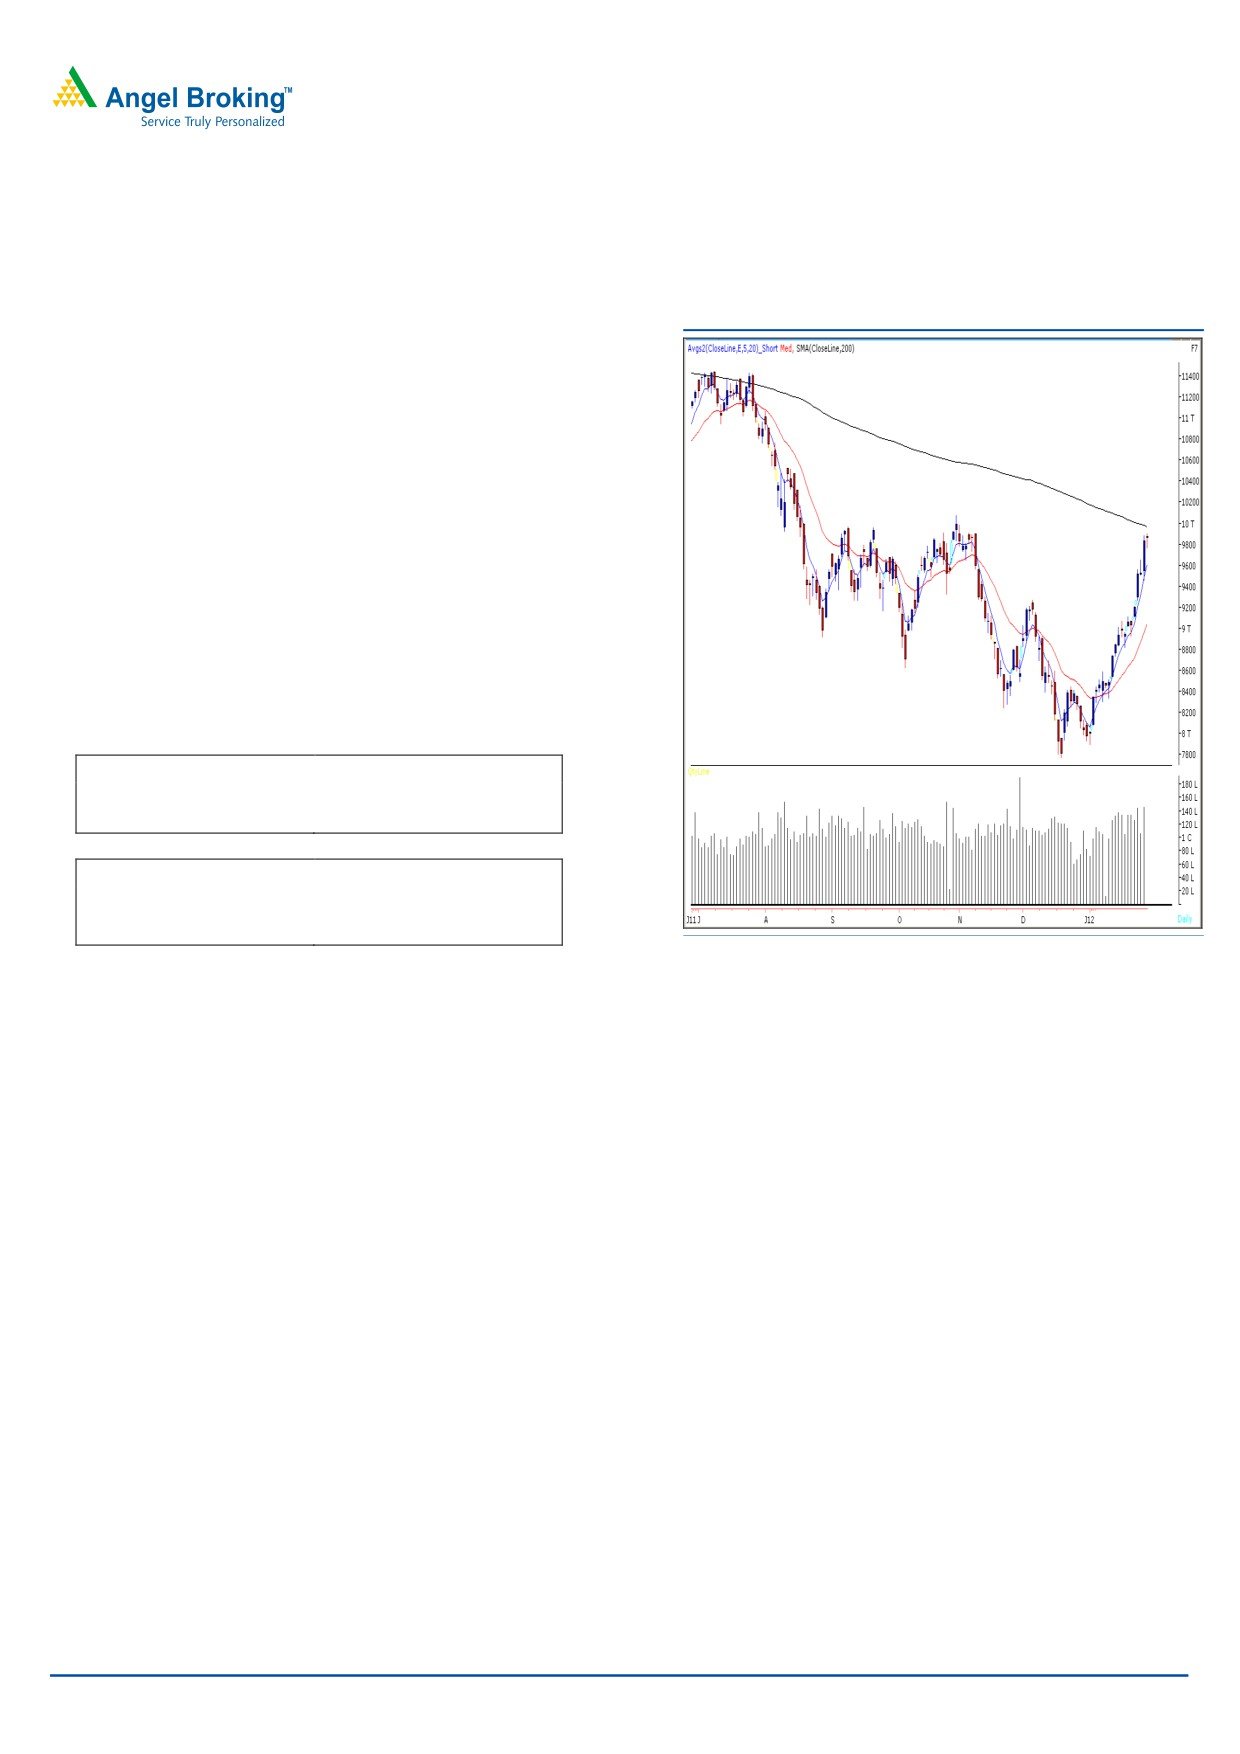
Bank Nifty Outlook - (9857)
Exhibit 2: Bank Nifty Daily Chart
On Wednesday, Bank Nifty opened on a flat note and
traded with immense volatility to close marginally below the
initial opening level. Similar to the benchmark indices, we
are now witnessing a narrow range body formation on the
daily charts, which is a sign of indecision prevailing at
current levels. Therefore, if the index manages to sustain
above Wednesday’s high of 9906 then it is likely to test
9967 - 10017 levels. At present, the momentum indicators
suggest that the Index is in an overbought condition and a
small correction cannot be ruled out. In such a scenario, if
Bank Nifty sustains below Wednesday’s low of 9762 then it
is likely to test 9680 - 9550 levels.
Actionable points:
View
Positive Above 9906
Expected Target
9967 - 10017
Support Levels
9760 - 9680 - 9550
View
Negative Below 9760
Expected Target
9680 - 9550
Resistance Levels
9906 - 9967 - 10017
Source: Falcon
For Private Circulation Only |
2
Technical Research | January 27, 2012
Positive Bias:
Expected
Stock Name
CMP
5 Day EMA
20 Day EMA
Remarks
Target
Crompton
142.3
137.8
133.5
147.5
View will change below 137
Greaves
GMDC
185
180.8
174.6
193
View will change below 179
Negative Bias:
Expected
Stock Name
CMP
5 Day EMA
20 Day EMA
Remarks
Target
Hero Motor
1853.9
1873.2
1857.4
1770
View will change above 1913
For Private Circulation Only |
3
Technical Research | January 27, 2012
Daily Pivot Levels for Nifty 50 Stocks
SCRIPS
S2
S1
PIVOT
R1
R2
SENSEX
16,961
17,019
17,075
17,133
17,188
NIFTY
5,110
5,134
5,154
5,178
5,198
BANKNIFTY
9,699
9,778
9,842
9,921
9,985
ACC
1,151
1,162
1,179
1,191
1,208
AMBUJACEM
157
159
161
163
166
AXISBANK
998
1,031
1,053
1,086
1,109
BAJAJ-AUTO
1,548
1,568
1,589
1,609
1,629
BHARTIARTL
349
354
359
364
370
BHEL
276
279
282
285
288
BPCL
544
562
576
594
608
CAIRN
329
337
352
360
375
CIPLA
338
340
343
345
348
DLF
216
217
220
222
224
DRREDDY
1,616
1,633
1,644
1,661
1,672
GAIL
361
364
367
370
373
HCLTECH
410
415
423
428
436
HDFC
699
704
708
713
717
HDFCBANK
482
486
490
494
497
HEROMOTOCO
1,801
1,828
1,862
1,888
1,922
HINDALCO
138
140
143
145
148
HINDUNILVR
384
389
394
399
404
ICICIBANK
856
868
881
894
907
IDFC
125
127
129
131
132
INFY
2,605
2,636
2,655
2,686
2,705
ITC
204
205
206
207
208
JINDALSTEL
525
533
543
551
561
JPASSOCIAT
69
71
72
74
76
KOTAKBANK
476
486
492
502
508
LT
1,287
1,309
1,338
1,360
1,389
M&M
676
681
687
692
698
MARUTI
1,118
1,149
1,174
1,205
1,230
NTPC
173
174
175
176
178
ONGC
267
270
273
276
279
PNB
972
986
1,002
1,016
1,032
POWERGRID
99
100
101
102
103
RANBAXY
460
467
473
480
486
RCOM
92
94
96
98
99
RELCAPITAL
331
338
344
351
357
RELIANCE
777
784
790
796
802
RELINFRA
461
487
503
529
544
RPOWER
93
95
97
99
100
SAIL
94
96
98
100
101
SBIN
2,015
2,037
2,061
2,083
2,107
SESAGOA
181
191
198
207
214
SIEMENS
736
745
757
765
778
STER
111
112
114
115
116
SUNPHARMA
511
514
518
521
525
SUZLON
26
27
27
28
28
TATAMOTORS
218
224
229
236
241
TATAPOWER
102
104
106
108
110
TATASTEEL
429
437
442
450
455
TCS
1,081
1,089
1,100
1,108
1,119
WIPRO
413
416
419
423
426
Technical Research Team
For Private Circulation Only |
4
Technical Report
RESEARCH TEAM
Shardul Kulkarni
Head - Technicals
Sameet Chavan
Technical Analyst
Sacchitanand Uttekar
Technical Analyst
Mehul Kothari
Technical Analyst
Ankur Lakhotia
Technical Analyst
Research Team: 022-3952 6600
DISCLAIMER: This document is not for public distribution and has been furnished to you solely for your information and must not
be reproduced or redistributed to any other person. Persons into whose possession this document may come are required to observe
these restrictions.
Opinion expressed is our current opinion as of the date appearing on this material only. While we endeavor to update on a
reasonable basis the information discussed in this material, there may be regulatory, compliance, or other reasons that prevent us
from doing so. Prospective investors and others are cautioned that any forward-looking statements are not predictions and may be
subject to change without notice. Our proprietary trading and investment businesses may make investment decisions that are
inconsistent with the recommendations expressed herein.
The information in this document has been printed on the basis of publicly available information, internal data and other reliable
sources believed to be true and are for general guidance only. While every effort is made to ensure the accuracy and completeness of
information contained, the company takes no guarantee and assumes no liability for any errors or omissions of the information. No
one can use the information as the basis for any claim, demand or cause of action.
Recipients of this material should rely on their own investigations and take their own professional advice. Each recipient of this
document should make such investigations as it deems necessary to arrive at an independent evaluation of an investment in the
securities of companies referred to in this document (including the merits and risks involved), and should consult their own advisors to
determine the merits and risks of such an investment. Price and value of the investments referred to in this material may go up or
down. Past performance is not a guide for future performance. Certain transactions - futures, options and other derivatives as well as
non-investment grade securities - involve substantial risks and are not suitable for all investors. Reports based on technical analysis
centers on studying charts of a stock's price movement and trading volume, as opposed to focusing on a company's fundamentals
and as such, may not match with a report on a company's fundamentals.
We do not undertake to advise you as to any change of our views expressed in this document. While we would endeavor to update
the information herein on a reasonable basis, Angel Broking, its subsidiaries and associated companies, their directors and
employees are under no obligation to update or keep the information current. Also there may be regulatory, compliance, or other
reasons that may prevent Angel Broking and affiliates from doing so. Prospective investors and others are cautioned that any
forward-looking statements are not predictions and may be subject to change without notice.
Angel Broking Limited and affiliates, including the analyst who has issued this report, may, on the date of this report, and from time
to time, have long or short positions in, and buy or sell the securities of the companies mentioned herein or engage in any other
transaction involving such securities and earn brokerage or compensation or act as advisor or have other potential conflict of interest
with respect to company/ies mentioned herein or inconsistent with any recommendation and related information and opinions.
Angel Broking Limited and affiliates may seek to provide or have engaged in providing corporate finance, investment banking or
other advisory services in a merger or specific transaction to the companies referred to in this report, as on the date of this report or
in the past.
Sebi Registration No : INB 010996539
For Private Circulation Only |