Technical Research | April 26, 2012
Daily Technical Report
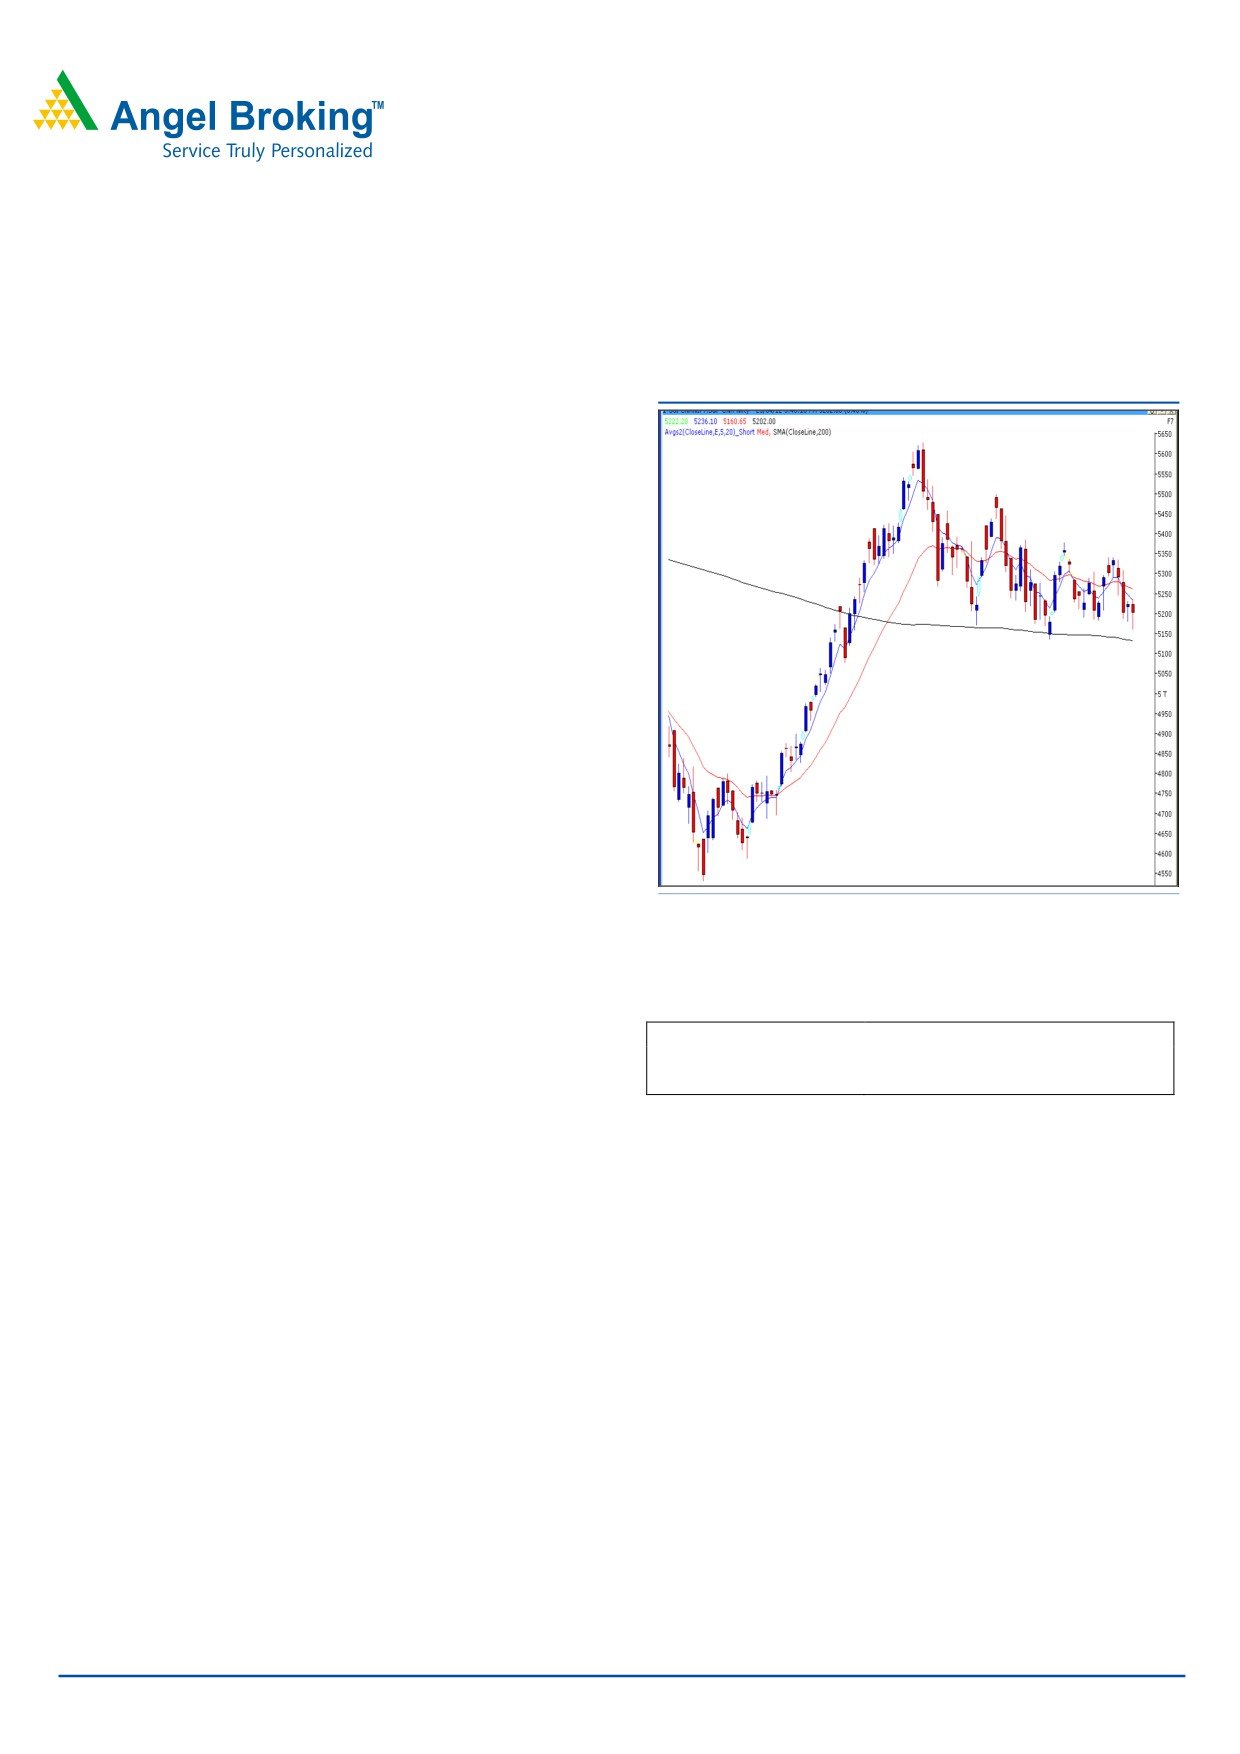
Sensex (17151) / NIFTY (5202)
Exhibit 1: Nifty Daily Chart
Yesterday, once again indices opened on a flat note in-line
with other Asian bourses. Indices traded sideways in the
initial hour of the trade but plunged post announcement of
rating agency ‘Standard & Poor’s’. The agency has changed
India’s outlook to negative. On sectoral front, Consumer
Durables and IT counters were among the major losers,
whereas defensive sectors like, FMCG and Health Care
along with Auto sector ended in the positive territory. The
advance to decline ratio was in strongly in favor of declining
Formation:
• The 200-day SMA (Simple Moving Average) and 20-day
EMA (Exponential Moving Average) have now shifted to
17050 / 5135 and 17400 / 5300, respectively.
Source: Falcon
• The ‘20-Week EMA’ is placed at 17200 / 5180 level.
Actionable points:
Trading strategy:
View
Neutral
In spite of the volatility seen in yesterday’s session, the
Resistance levels
5236 - 5311
technical outlook on the market remains unchanged and
Support Level
5135
the range bound activity is likely to continue. As mentioned
in previous reports, once again the ’20 week EMA’ has
provided decent support for the markets. Going forward,
only if indices manage to sustain below 16920 / 5135
level, then they likely to drift towards 16828 - 16600 /
5076 - 5000. Conversely, the immediate resistance is seen
around 17250 / 5236 level. A move beyond this may push
indices higher to test 17444 / 5311 level.
Note: It is likely that we may see extreme volatility in today’s
session on account of the derivatives expiry. Traders are
advised to trade with strict stop losses and avoid aggressive
positions.
For Private Circulation Only |
1
Technical Research | April 26, 2012
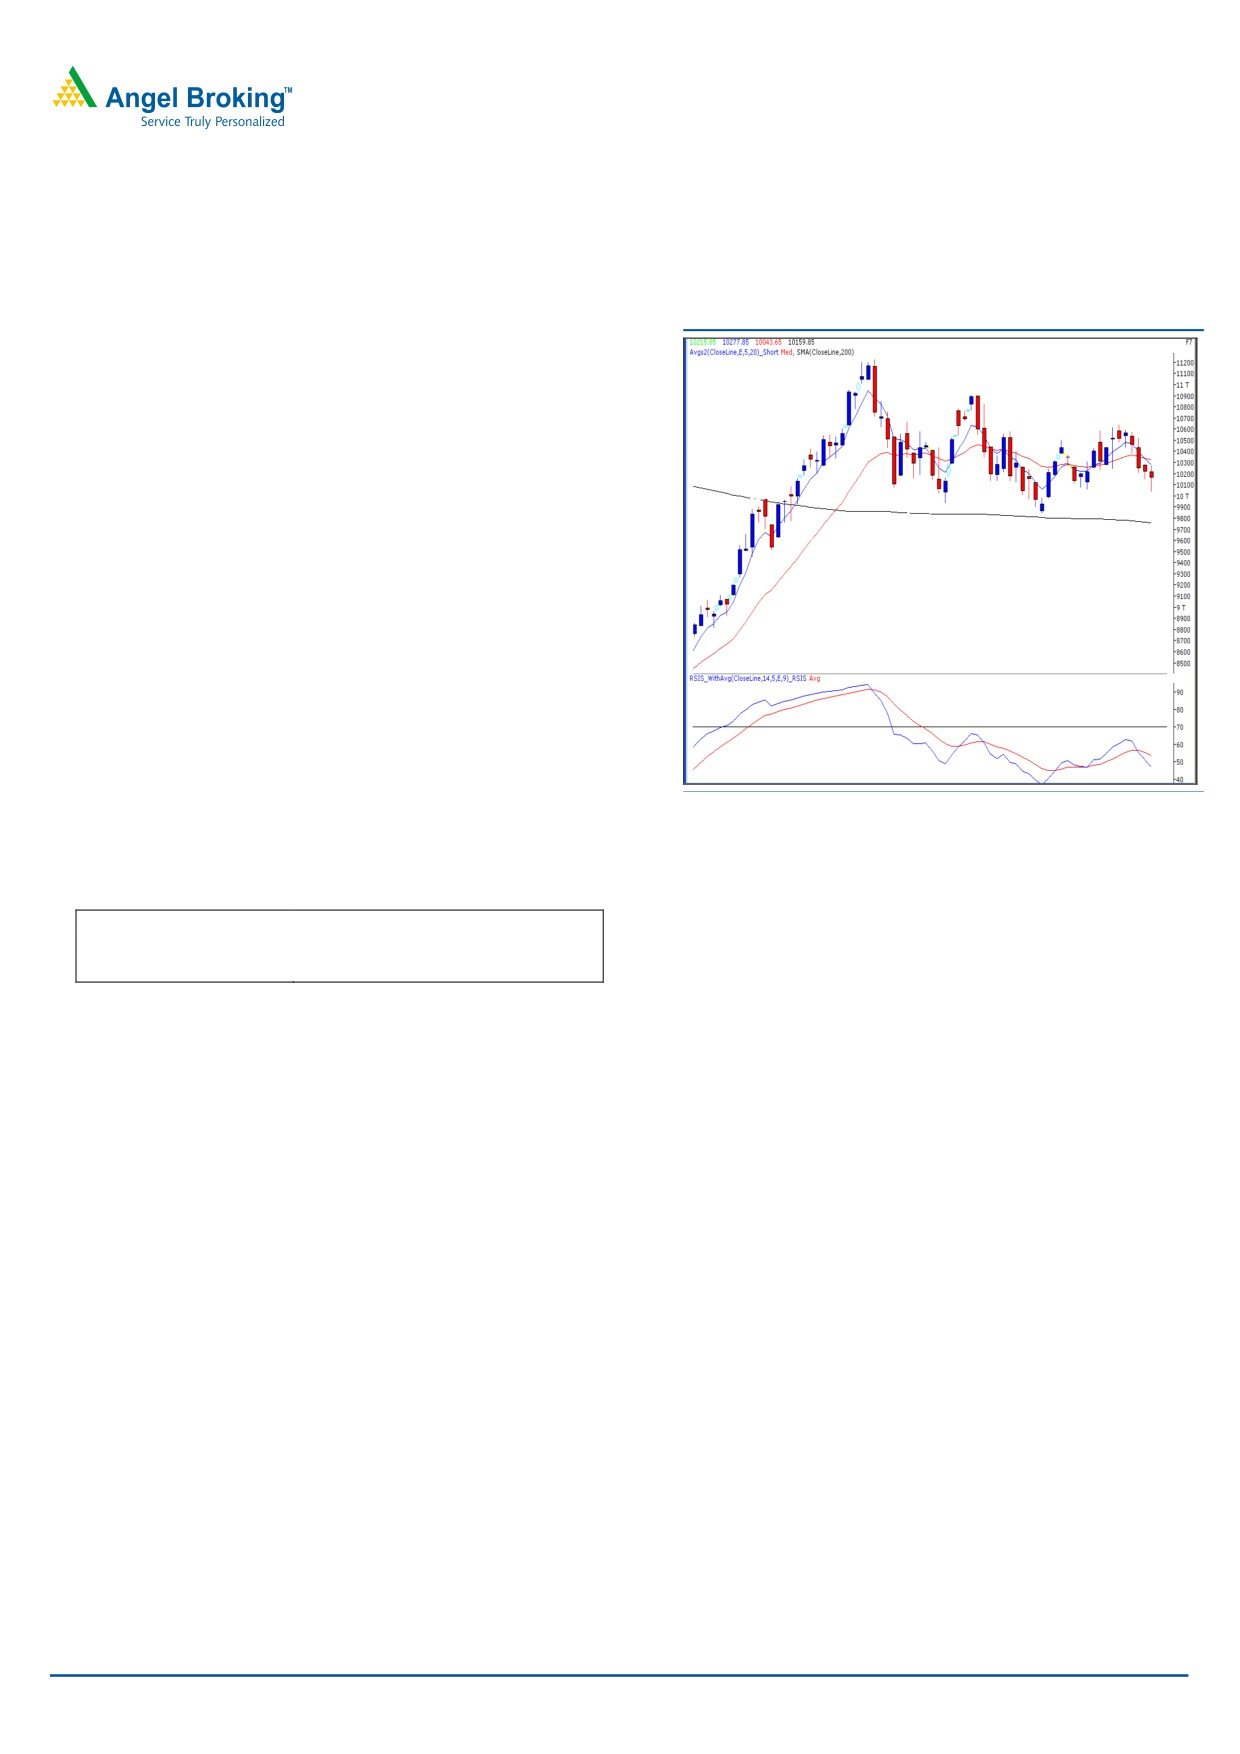
Bank Nifty Outlook - (10160)
Exhibit 2: Bank Nifty Daily Chart
Yesterday, Bank Nifty opened on a flat note and traded
with extreme volatility throughout the session. The index
tested the mentioned support level of
10060 and
bounced back. The negative crossover in “RSI
-
Smoothened” momentum oscillator on the daily chart
mentioned in our previous reports is still intact. On the
contrary, the momentum oscillator “RSI - Smoothened” on
the hourly chart is placed in an extreme oversold
condition and possibility of a bounce back cannot be
ruled out. The trading range of
10600
-
10150
mentioned in our previous reports was breached during
the day trade but the index managed to claw back and
give a close marginally above it. For the coming session
10280 - 10345 levels are likely to act as resistance and
10040 - 9985 levels may act as support.
Source: Falcon
Actionable points:
View
Neutral
Resistance Levels
10280 - 10345
Support Levels
10040 - 9985
For Private Circulation Only |
2
Technical Research | April 26, 2012
Positive Bias:
Positive
Expected
Stock Name
CMP
5 Day EMA
20 Day EMA
Remarks
Above
Target
View will change below
TVS Motor
39.9
39.8
40.9
40.2
43
38.2
For Private Circulation Only |
3
Technical Research | April 26, 2012
Daily Pivot Levels for Nifty 50 Stocks
SCRIPS
S2
S1
PIVOT
R1
R2
SENSEX
16,910
17,030
17,140
17,261
17,370
NIFTY
5,124
5,163
5,200
5,239
5,275
BANKNIFTY
9,926
10,043
10,160
10,277
10,395
ACC
1,159
1,177
1,206
1,223
1,252
AMBUJACEM
146
148
151
153
156
AXISBANK
1,057
1,076
1,100
1,119
1,144
BAJAJ-AUTO
1,615
1,635
1,661
1,681
1,707
BHARTIARTL
301
307
311
317
322
BHEL
226
229
234
237
242
BPCL
674
680
689
695
704
CAIRN
334
341
346
353
358
CIPLA
308
310
314
316
320
COALINDIA
342
346
352
356
362
DLF
180
183
186
188
191
DRREDDY
1,727
1,754
1,773
1,800
1,819
GAIL
326
331
340
345
354
HCLTECH
499
503
508
512
517
HDFC
666
671
680
685
693
HDFCBANK
533
540
545
551
556
HEROMOTOCO
2,150
2,197
2,227
2,274
2,304
HINDALCO
116
118
120
122
124
HINDUNILVR
414
416
419
422
425
ICICIBANK
812
825
840
854
869
IDFC
120
122
124
126
128
INFY
2,278
2,314
2,339
2,376
2,401
ITC
241
243
245
248
249
JINDALSTEL
465
473
480
488
495
JPASSOCIAT
70
72
74
75
77
KOTAKBANK
548
557
566
574
583
LT
1,175
1,203
1,220
1,249
1,266
M&M
691
697
706
713
722
MARUTI
1,351
1,366
1,378
1,393
1,405
NTPC
161
163
165
167
170
ONGC
259
262
266
269
273
PNB
849
862
878
891
906
POWERGRID
106
107
109
110
112
RANBAXY
500
508
520
528
540
RCOM
76
77
79
81
83
RELIANCE
721
729
736
743
751
RELINFRA
503
515
527
539
551
RPOWER
100
102
106
108
111
SAIL
96
98
100
102
104
SBIN
2,094
2,133
2,170
2,209
2,246
SESAGOA
181
183
185
188
190
SIEMENS
759
769
783
793
807
STER
104
106
107
109
110
SUNPHARMA
579
586
594
601
608
SUZLON
21
22
22
23
23
TATAMOTORS
307
310
313
317
319
TATAPOWER
101
104
105
107
109
TATASTEEL
451
458
467
474
483
TCS
1,154
1,162
1,176
1,185
1,199
WIPRO
396
403
413
420
430
Technical Research Team
For Private Circulation Only |
4
Technical Report
RESEARCH TEAM
Shardul Kulkarni
Head - Technicals
Sameet Chavan
Technical Analyst
Sacchitanand Uttekar
Technical Analyst
Mehul Kothari
Technical Analyst
Ankur Lakhotia
Technical Analyst
Research Team: 022-3952 6600
DISCLAIMER: This document is not for public distribution and has been furnished to you solely for your information and must not
be reproduced or redistributed to any other person. Persons into whose possession this document may come are required to observe
these restrictions.
Opinion expressed is our current opinion as of the date appearing on this material only. While we endeavor to update on a
reasonable basis the information discussed in this material, there may be regulatory, compliance, or other reasons that prevent us
from doing so. Prospective investors and others are cautioned that any forward-looking statements are not predictions and may be
subject to change without notice. Our proprietary trading and investment businesses may make investment decisions that are
inconsistent with the recommendations expressed herein.
The information in this document has been printed on the basis of publicly available information, internal data and other reliable
sources believed to be true and are for general guidance only. While every effort is made to ensure the accuracy and completeness of
information contained, the company takes no guarantee and assumes no liability for any errors or omissions of the information. No
one can use the information as the basis for any claim, demand or cause of action.
Recipients of this material should rely on their own investigations and take their own professional advice. Each recipient of this
document should make such investigations as it deems necessary to arrive at an independent evaluation of an investment in the
securities of companies referred to in this document (including the merits and risks involved), and should consult their own advisors to
determine the merits and risks of such an investment. Price and value of the investments referred to in this material may go up or
down. Past performance is not a guide for future performance. Certain transactions - futures, options and other derivatives as well as
non-investment grade securities - involve substantial risks and are not suitable for all investors. Reports based on technical analysis
centers on studying charts of a stock's price movement and trading volume, as opposed to focusing on a company's fundamentals
and as such, may not match with a report on a company's fundamentals.
We do not undertake to advise you as to any change of our views expressed in this document. While we would endeavor to update
the information herein on a reasonable basis, Angel Broking, its subsidiaries and associated companies, their directors and
employees are under no obligation to update or keep the information current. Also there may be regulatory, compliance, or other
reasons that may prevent Angel Broking and affiliates from doing so. Prospective investors and others are cautioned that any
forward-looking statements are not predictions and may be subject to change without notice.
Angel Broking Limited and affiliates, including the analyst who has issued this report, may, on the date of this report, and from time
to time, have long or short positions in, and buy or sell the securities of the companies mentioned herein or engage in any other
transaction involving such securities and earn brokerage or compensation or act as advisor or have other potential conflict of interest
with respect to company/ies mentioned herein or inconsistent with any recommendation and related information and opinions.
Angel Broking Limited and affiliates may seek to provide or have engaged in providing corporate finance, investment banking or
other advisory services in a merger or specific transaction to the companies referred to in this report, as on the date of this report or
in the past.
Sebi Registration No: INB 010996539
For Private Circulation Only |