Technical Research | March 26, 2012
Daily Technical Report
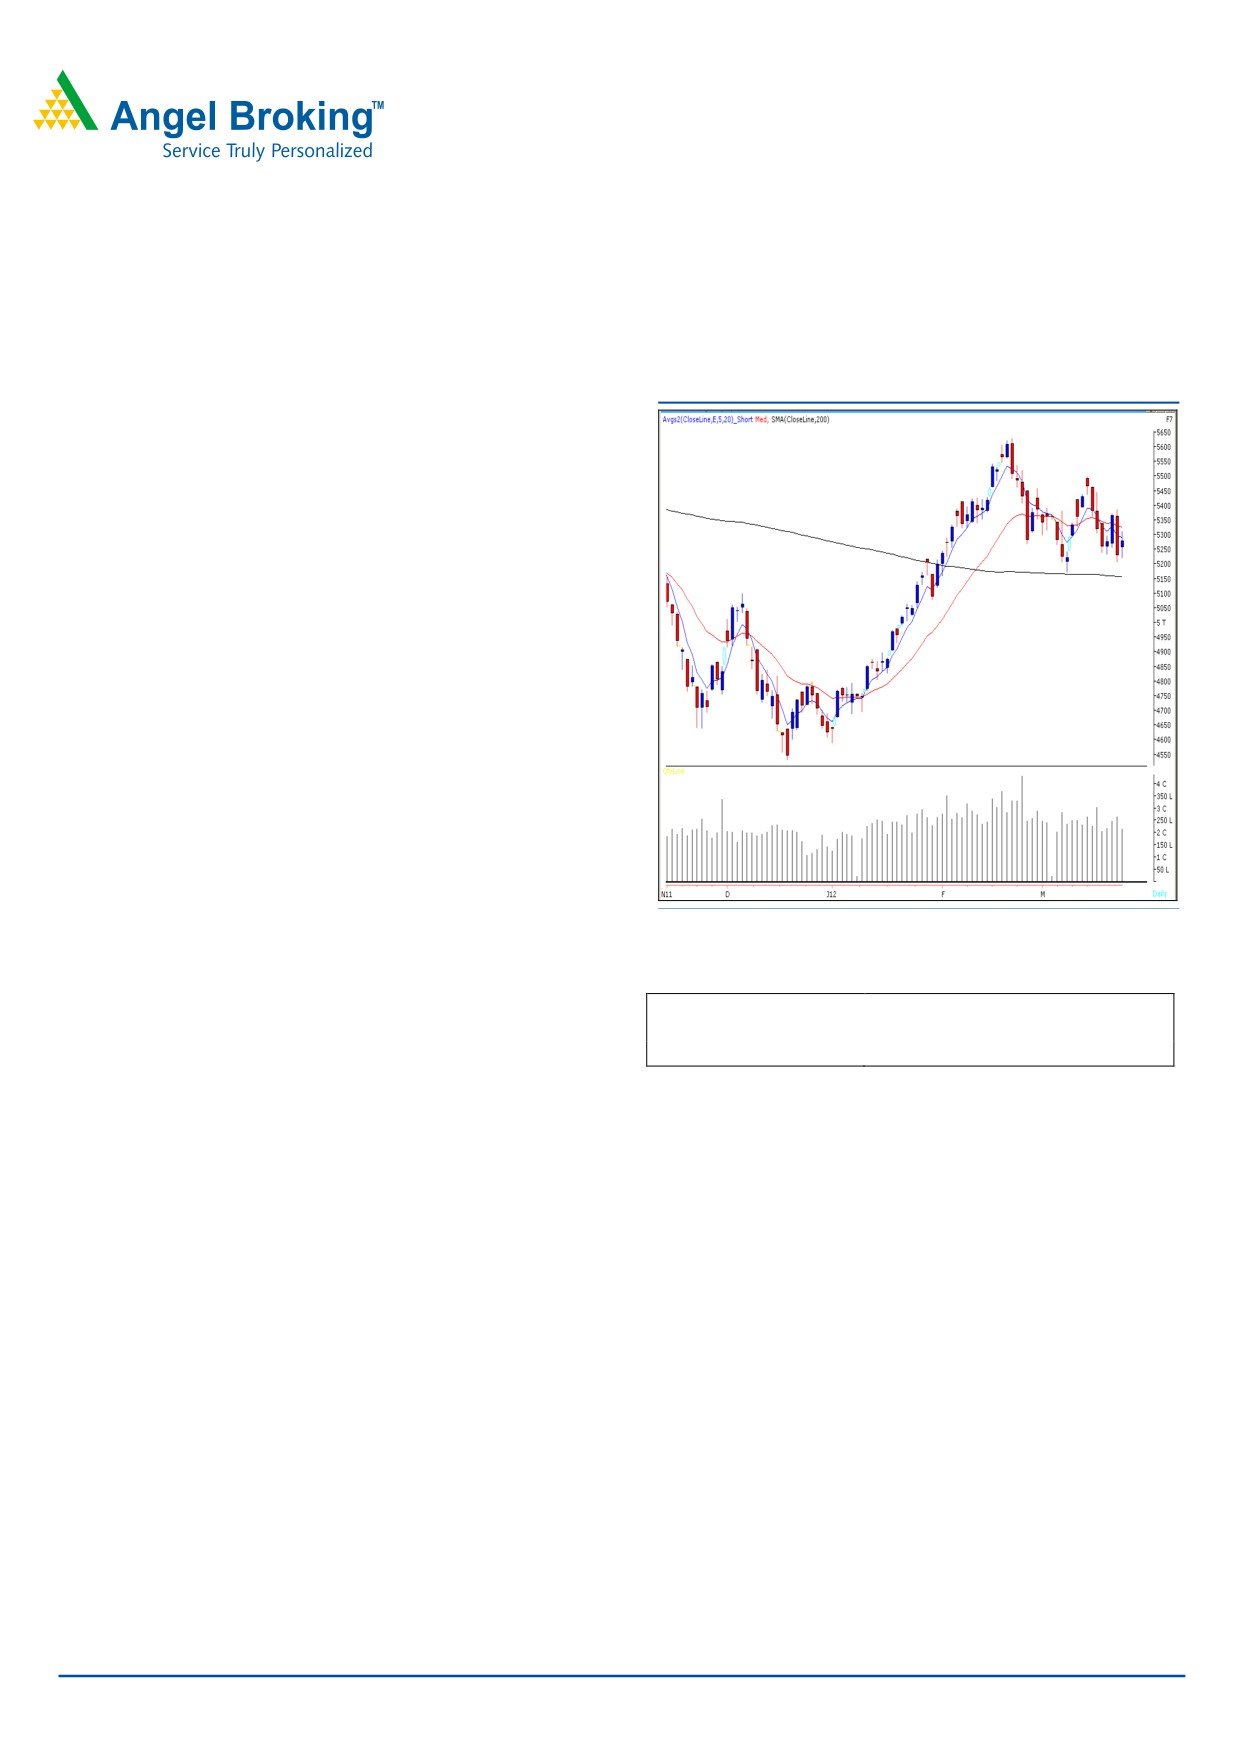
Sensex (17362) / NIFTY (5278)
Exhibit 1: Nifty Daily Chart
On Friday, our Benchmark indices closed on a positive note
in spite of biggest intraday loss on Thursday, in the whole of
2012. Most high beta counters bounced off their lows on
the back of short covering and are near to critical support
levels. On sectoral front, Teck, Realty and IT counters were
among the major gainers. Consumer durables and Metal
counters ended with marginal loss. The advance to decline
ration was marginally in favour of advancing counters
Formation:
• The 200-day SMA (Simple Moving Average) and 20-
day EMA (Exponential Moving Average) have now shifted to
17164 / 5163 and 17607 / 5350, respectively.
• The “20-Week EMA” is placed at 17150 / 5188 level.
Source: Falcon
Actionable points:
Trading strategy:
View
Neutral
Broadly speaking, Indices are trading in the range of 17687
Resistance Levels
5312 - 5386
to 17008 / 5386 to 5171. Clarity of trend will emerge only
Support Levels
5225 - 5200 - 5171
if after we witness a breakout on either side from the said
range. On the upside, the positive trend will resume once
Extreme volatility is likely to continue in the coming week on
markets trade and close beyond 17687 / 5386. In this
account of the derivative expiry. We advise traders to adopt
scenario, indices are likely to surge towards the next
stock specific approach and trade with strict stop loss.
resistance levels of
18041 - 18524 / 5500 - 5610.
Conversely, the 17008 / 5171 level is a key support for the
market. A sustainable move below this level may reinforce
selling pressure, which may drag indices lower to test the
support zone of 16828 - 16600 / 5076 - 5000.
For Private Circulation Only |
1
Technical Research | March 26, 2012
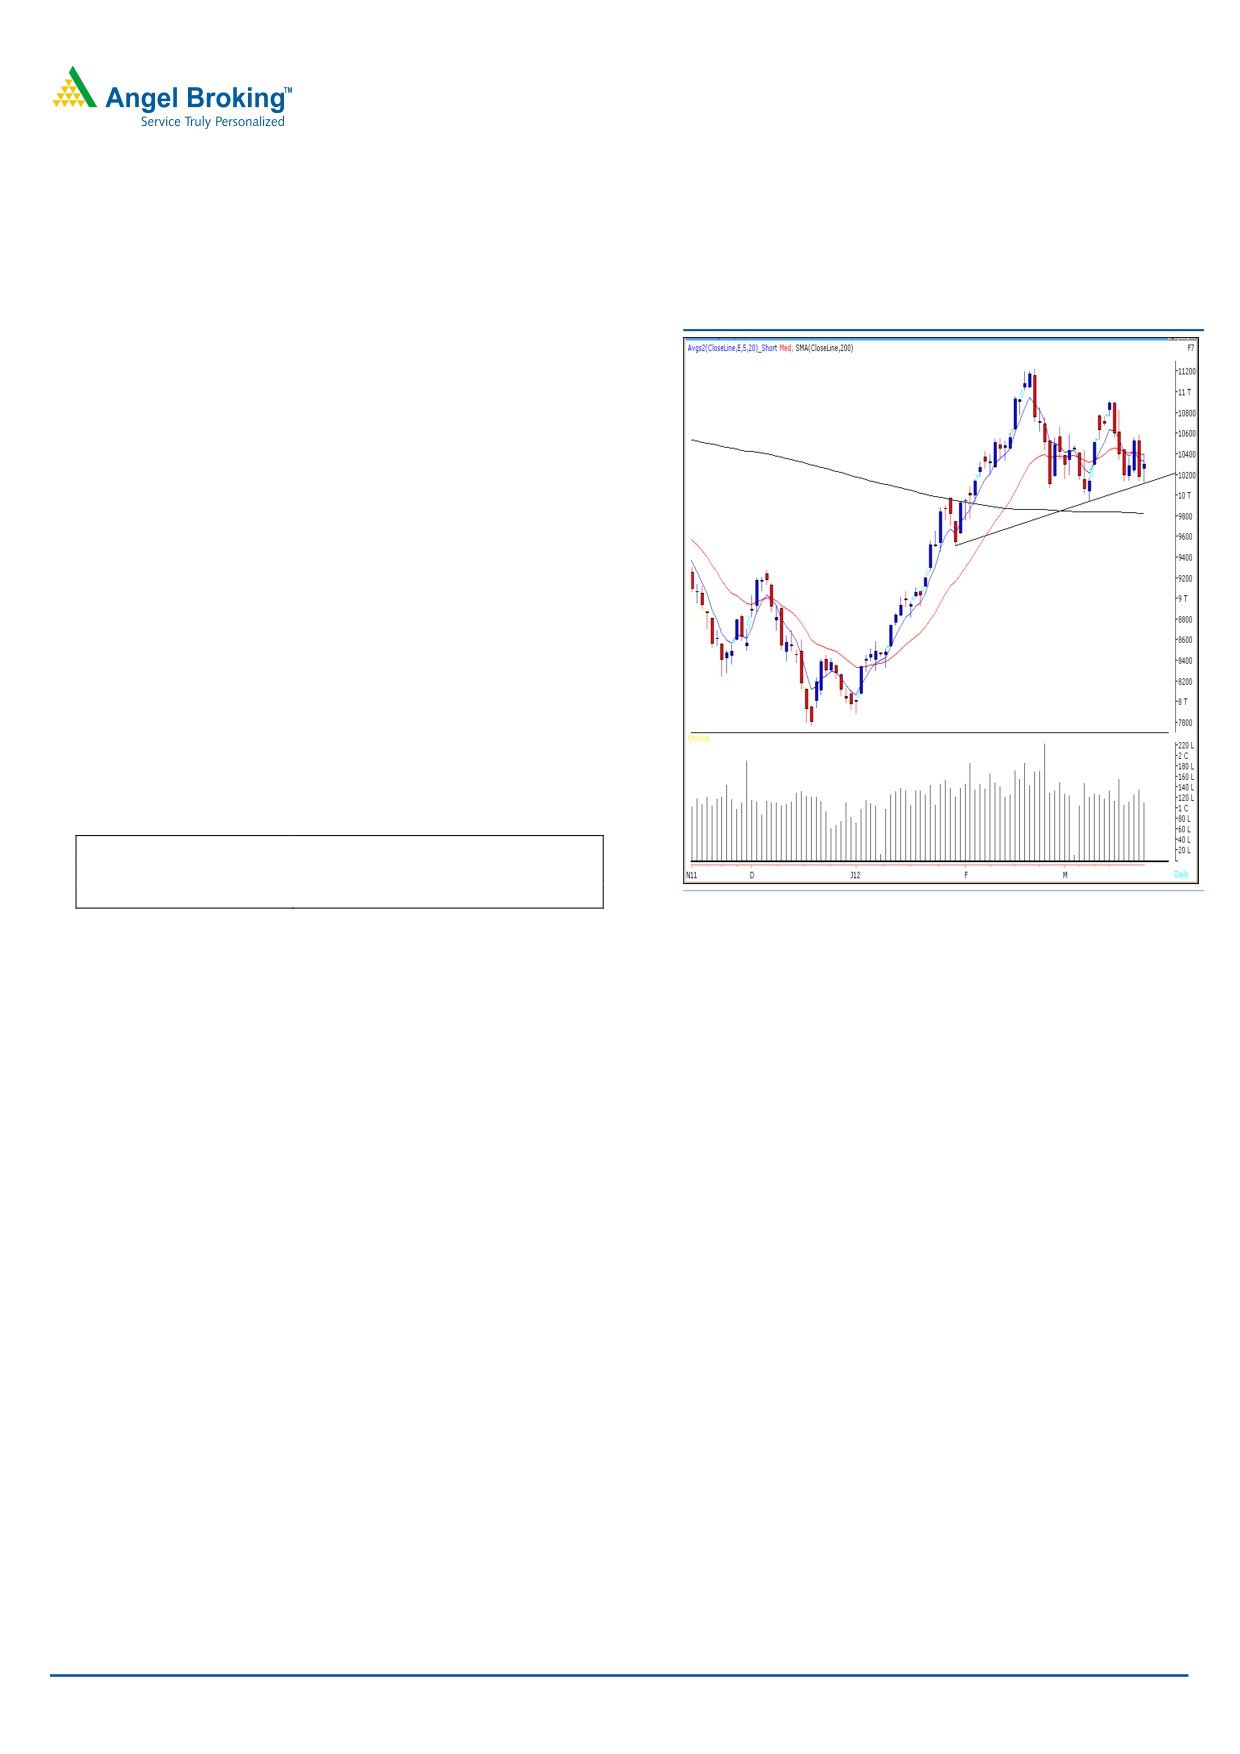
Bank Nifty Outlook - (10295)
Exhibit 2: Bank Nifty Daily Chart
On Friday, Bank Nifty opened on a flat note and traded
with extreme volatility throughout the session to close
marginally above the initial opening level. The index
tested both the mentioned resistance as well as support
levels of 10413 and 10135 respectively. Looking at the
hourly charts, it can be seen that the Bank Nifty is in a
broad trading range of 10600 - 10100. Only a breakout
or a breakdown from the mentioned range will dictate the
direction of the trend. The momentum oscillators on the
hourly and daily charts paint a mixed picture; and hence
volatility is likely to increase in the next few sessions. On
the upside 10413 - 10600 levels are likely to act as
resistance within the range. On the downside 10100 may
act as support.
Actionable points:
View
Neutral
Resistance Levels
10413 - 10600
Support Levels
10100
Source: Falcon
For Private Circulation Only |
2
Technical Research | March 26, 2012
Positive Bias:
Positive
Expected
Stock Name
CMP
5 Day EMA
20 Day EMA
Remarks
Above
Target
View will change below
GAIL
370
366.7
367.5
375
400
363
For Private Circulation Only |
3
Technical Research | March 26, 2012
Daily Pivot Levels for Nifty 50 Stocks
SCRIPS
S2
S1
PIVOT
R1
R2
SENSEX
17,054
17,208
17,333
17,487
17,612
NIFTY
5,178
5,228
5,270
5,320
5,362
BANKNIFTY
9,996
10,145
10,275
10,424
10,553
ACC
1,322
1,347
1,366
1,391
1,410
AMBUJACEM
165
169
172
176
179
AXISBANK
1,128
1,154
1,178
1,204
1,228
BAJAJ-AUTO
1,604
1,657
1,700
1,753
1,796
BHARTIARTL
313
325
332
344
351
BHEL
254
260
265
271
276
BPCL
657
669
678
690
700
CAIRN
341
348
353
359
364
CIPLA
295
298
300
304
306
COALINDIA
323
329
336
342
349
DLF
189
193
196
199
202
DRREDDY
1,634
1,650
1,662
1,678
1,690
GAIL
351
360
368
377
384
HCLTECH
470
477
483
491
497
HDFC
653
657
660
664
668
HDFCBANK
493
504
511
521
529
HEROMOTOCO
1,863
1,940
1,999
2,077
2,136
HINDALCO
126
128
132
135
138
HINDUNILVR
392
397
402
408
413
ICICIBANK
884
897
910
924
937
IDFC
132
133
136
138
140
INFY
2,810
2,841
2,862
2,894
2,914
ITC
217
220
222
225
227
JINDALSTEL
511
524
539
551
566
JPASSOCIAT
75
77
79
81
83
KOTAKBANK
506
516
524
534
543
LT
1,267
1,284
1,304
1,321
1,341
M&M
666
677
686
697
706
MARUTI
1,270
1,288
1,304
1,323
1,339
NTPC
169
170
172
173
175
ONGC
262
265
268
271
275
PNB
920
935
948
964
977
POWERGRID
105
106
107
109
110
RANBAXY
400
408
413
421
425
RCOM
86
88
89
91
93
RELIANCE
732
738
744
750
755
RELINFRA
569
582
594
607
619
RPOWER
116
119
122
125
127
SAIL
91
93
95
96
98
SBIN
2,089
2,128
2,166
2,205
2,244
SESAGOA
190
194
199
203
207
SIEMENS
761
770
781
790
801
STER
107
110
113
115
118
SUNPHARMA
549
565
575
590
601
SUZLON
26
27
28
29
29
TATAMOTORS
264
268
272
276
280
TATAPOWER
97
98
99
101
102
TATASTEEL
436
442
449
455
462
TCS
1,153
1,169
1,180
1,196
1,208
WIPRO
417
421
424
429
432
Technical Research Team
For Private Circulation Only |
4
Technical Report
RESEARCH TEAM
Shardul Kulkarni
Head - Technicals
Sameet Chavan
Technical Analyst
Sacchitanand Uttekar
Technical Analyst
Mehul Kothari
Technical Analyst
Ankur Lakhotia
Technical Analyst
Research Team: 022-3952 6600
DISCLAIMER: This document is not for public distribution and has been furnished to you solely for your information and must not
be reproduced or redistributed to any other person. Persons into whose possession this document may come are required to observe
these restrictions.
Opinion expressed is our current opinion as of the date appearing on this material only. While we endeavor to update on a
reasonable basis the information discussed in this material, there may be regulatory, compliance, or other reasons that prevent us
from doing so. Prospective investors and others are cautioned that any forward-looking statements are not predictions and may be
subject to change without notice. Our proprietary trading and investment businesses may make investment decisions that are
inconsistent with the recommendations expressed herein.
The information in this document has been printed on the basis of publicly available information, internal data and other reliable
sources believed to be true and are for general guidance only. While every effort is made to ensure the accuracy and completeness of
information contained, the company takes no guarantee and assumes no liability for any errors or omissions of the information. No
one can use the information as the basis for any claim, demand or cause of action.
Recipients of this material should rely on their own investigations and take their own professional advice. Each recipient of this
document should make such investigations as it deems necessary to arrive at an independent evaluation of an investment in the
securities of companies referred to in this document (including the merits and risks involved), and should consult their own advisors to
determine the merits and risks of such an investment. Price and value of the investments referred to in this material may go up or
down. Past performance is not a guide for future performance. Certain transactions - futures, options and other derivatives as well as
non-investment grade securities - involve substantial risks and are not suitable for all investors. Reports based on technical analysis
centers on studying charts of a stock's price movement and trading volume, as opposed to focusing on a company's fundamentals
and as such, may not match with a report on a company's fundamentals.
We do not undertake to advise you as to any change of our views expressed in this document. While we would endeavor to update
the information herein on a reasonable basis, Angel Broking, its subsidiaries and associated companies, their directors and
employees are under no obligation to update or keep the information current. Also there may be regulatory, compliance, or other
reasons that may prevent Angel Broking and affiliates from doing so. Prospective investors and others are cautioned that any
forward-looking statements are not predictions and may be subject to change without notice.
Angel Broking Limited and affiliates, including the analyst who has issued this report, may, on the date of this report, and from time
to time, have long or short positions in, and buy or sell the securities of the companies mentioned herein or engage in any other
transaction involving such securities and earn brokerage or compensation or act as advisor or have other potential conflict of interest
with respect to company/ies mentioned herein or inconsistent with any recommendation and related information and opinions.
Angel Broking Limited and affiliates may seek to provide or have engaged in providing corporate finance, investment banking or
other advisory services in a merger or specific transaction to the companies referred to in this report, as on the date of this report or
in the past.
Sebi Registration No: INB 010996539
For Private Circulation Only |