Technical Research | December 26, 2011
Daily Technical Report
Sensex (15739) / NIFTY (4714)
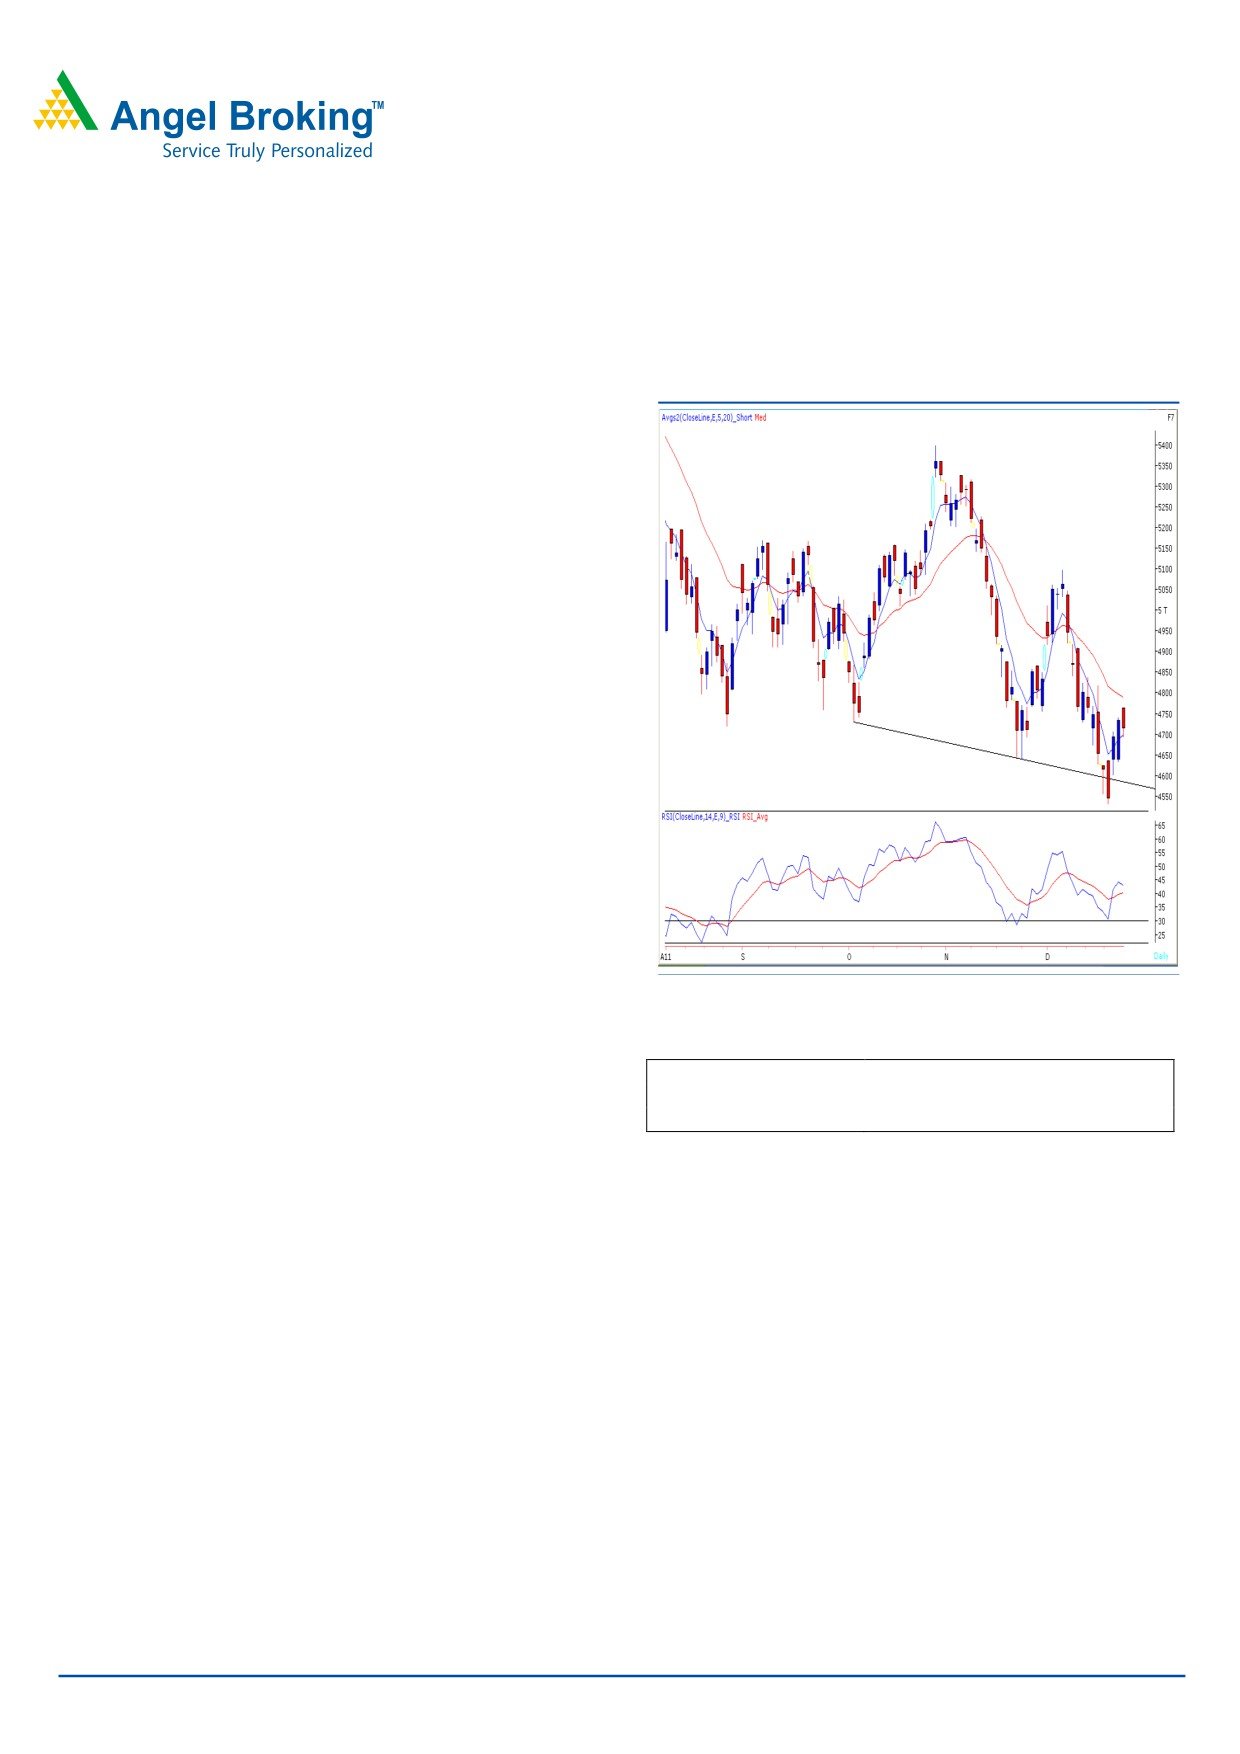
Exhibit 1: Nifty Daily Chart
On Friday, indices opened higher and continued to face
strong selling pressure at higher levels. A minor correction
during the second half, pulled indices lower from the day’s
high to close marginally above 4700 mark. On the sectoral
front, Consumer Durables and Banking sectors corrected on
Friday, whereas Capital Goods counters ended on a
gaining side. The advance to decline ratio was in favor of
advancing counters. (A=1546 D=1069). (Source
-
Formation
• On the Daily chart, we are witnessing a “Downward
Sloping Trend Line” joining two lows of 15760 - 15479 /
4728 - 4639. Also, there is a positive crossover in “RSI”
momentum oscillator.
• The 20 EMA on the daily chart is placed at 16020 /
4800 level.
Source: Falcon
Trading strategy:
Actionable points:
View
Neutral
Last week, markets anchored their position near the
Resistance levels
4764 - 4800 - 4820
“Downward Sloping Trend Line” (joining two lows of 15760
Support levels
4678 - 4638 - 4600
- 15479 / 4728 - 4639) support level of 15330 / 4540.
Thus, the weekly low of 15135 / 4531 would now act a
strong and crucial support level for our markets. The
positive crossover in the daily “RSI” oscillator is still intact.
As a result, positive momentum is likely to resume if indices
sustain above Friday’s high of 15911 / 4764. In this case,
indices may move higher to test the resistance zone of
16020 - 16070 / 4800 - 4820, which also coincides with
the daily 20 EMA. If our markets manage to sustain above
these hurdles, then they are likely to rally further towards
16286 - 16421/ 4881 - 4920 levels. On the flip side, only
a sustainable move below 15135 / 4531 would reinforce
the negative momentum and indices then may drift towards
the next support levels of 14870 - 14400 / 4430 - 4300.
For Private Circulation Only |
1
Technical Research | December 26, 2011
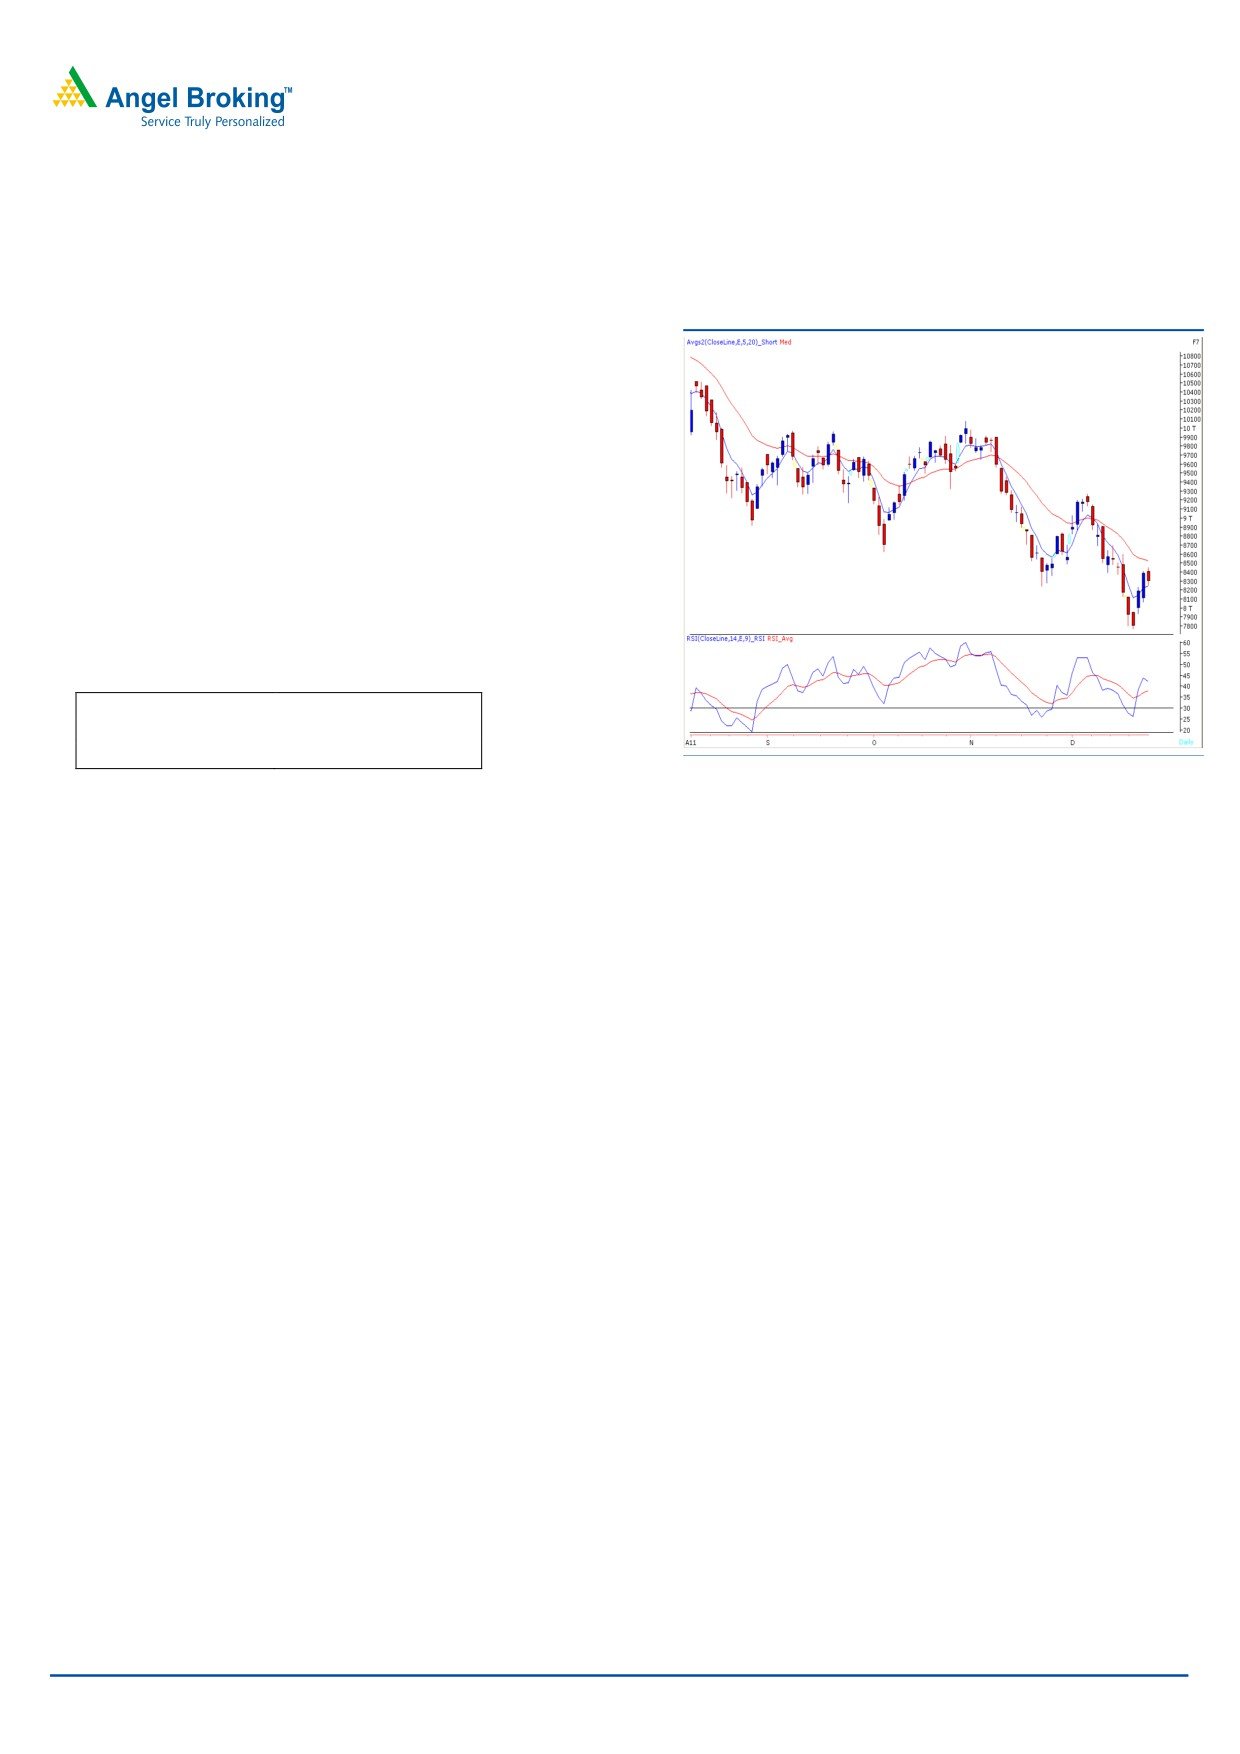
Bank Nifty Outlook - (8296)
Exhibit 2: Bank Nifty Daily Chart
On Friday Bank nifty opened on a flat note and traded in
a narrow range during first half of the session. As
mentioned in our previous reports, the positive crossover
of “Stochastic and RSI” momentum oscillator on the daily
chart is still intact. However we are witnessing a negative
crossover in “RSI - Smoothened” oscillator on the hourly
chart. Therefore, if Bank Nifty sustains below Friday’s low
of 8253 then we may witness a minor correction towards
8190 - 8110 levels. On the upside, 8366 - 8452 levels
may act as resistance in coming trading session.
Actionable points:
View
Neutral
Resistance Level
8366 - 8452
Support Level
8190 - 8110
Source: Falcon
For Private Circulation Only |
2
Technical Research | December 26, 2011
Positive Bias:
Expected
Stock Name
CMP
5 Day EMA
20 Day EMA
Remarks
Target
Jindal Saw
126.6
124
125.8
135
View will change below 117
Bhushan Steel
310.5
307.3
310
325
View will change below 304
Negative Bias:
Expected
Stock Name
CMP
5 Day EMA
20 Day EMA
Remarks
Target
Bata India
543.5
550
586.6
490
View will change above 567
GitanjaliGems
311.7
316.9
329.7
300
View will change above 325
For Private Circulation Only |
3
Technical Research | December 26, 2011
Daily Pivot Levels for Nifty 50 Stocks
SCRIPS
S2
S1
PIVOT
R1
R2
SENSEX
15,534
15,636
15,774
15,876
16,014
NIFTY
4,653
4,684
4,724
4,754
4,794
BANKNIFTY
8,135
8,216
8,334
8,414
8,532
ACC
1,108
1,124
1,143
1,158
1,178
AMBUJACEM
153
154
156
158
160
AXISBANK
850
865
881
895
911
BAJAJ-AUTO
1,570
1,584
1,602
1,616
1,634
BHARTIARTL
322
326
332
336
342
BHEL
234
238
242
247
251
BPCL
485
496
512
522
538
CAIRN
311
314
317
320
323
CIPLA
324
327
332
335
339
DLF
187
190
196
200
205
DRREDDY
1,557
1,573
1,588
1,604
1,619
GAIL
384
388
392
395
400
HCLTECH
381
385
390
394
398
HDFC
648
655
662
668
675
HDFCBANK
430
434
440
444
451
HEROMOTOCO
1,787
1,818
1,844
1,875
1,901
HINDALCO
117
120
123
125
128
HINDUNILVR
405
409
412
415
418
ICICIBANK
703
713
723
733
744
IDFC
95
97
100
102
105
INFY
2,649
2,672
2,706
2,729
2,763
ITC
201
203
204
205
207
JINDALSTEL
468
477
489
499
511
JPASSOCIAT
51
52
54
55
57
KOTAKBANK
444
450
459
465
473
LT
972
991
1,017
1,035
1,062
M&M
683
690
699
705
714
MARUTI
957
966
977
987
998
NTPC
153
155
160
163
168
ONGC
256
259
263
266
270
PNB
787
802
822
836
856
POWERGRID
99
100
101
102
103
RANBAXY
390
398
409
417
428
RCOM
65
66
68
69
71
RELCAPITAL
236
241
248
253
260
RELIANCE
726
736
753
763
780
RELINFRA
348
354
362
369
377
RPOWER
69
71
73
74
76
SAIL
78
79
81
82
84
SBIN
1,605
1,626
1,659
1,680
1,713
SESAGOA
153
157
162
167
172
SIEMENS
640
649
657
666
674
STER
89
90
92
94
96
SUNPHARMA
492
495
499
502
505
SUZLON
18
19
19
19
20
TATAMOTORS
180
183
185
187
190
TATAPOWER
85
87
89
90
92
TATASTEEL
337
342
350
356
364
TCS
1,130
1,144
1,153
1,166
1,176
WIPRO
390
398
404
411
417
Technical Research Team
For Private Circulation Only |
4
Technical Report
RESEARCH TEAM
Shardul Kulkarni
Head - Technicals
Sameet Chavan
Technical Analyst
Sacchitanand Uttekar
Technical Analyst
Mehul Kothari
Technical Analyst
Ankur Lakhotia
Technical Analyst
Research Team: 022-3952 6600
DISCLAIMER: This document is not for public distribution and has been furnished to you solely for your information and must not
be reproduced or redistributed to any other person. Persons into whose possession this document may come are required to observe
these restrictions.
Opinion expressed is our current opinion as of the date appearing on this material only. While we endeavor to update on a
reasonable basis the information discussed in this material, there may be regulatory, compliance, or other reasons that prevent us
from doing so. Prospective investors and others are cautioned that any forward-looking statements are not predictions and may be
subject to change without notice. Our proprietary trading and investment businesses may make investment decisions that are
inconsistent with the recommendations expressed herein.
The information in this document has been printed on the basis of publicly available information, internal data and other reliable
sources believed to be true and are for general guidance only. While every effort is made to ensure the accuracy and completeness of
information contained, the company takes no guarantee and assumes no liability for any errors or omissions of the information. No
one can use the information as the basis for any claim, demand or cause of action.
Recipients of this material should rely on their own investigations and take their own professional advice. Each recipient of this
document should make such investigations as it deems necessary to arrive at an independent evaluation of an investment in the
securities of companies referred to in this document (including the merits and risks involved), and should consult their own advisors to
determine the merits and risks of such an investment. Price and value of the investments referred to in this material may go up or
down. Past performance is not a guide for future performance. Certain transactions - futures, options and other derivatives as well as
non-investment grade securities - involve substantial risks and are not suitable for all investors. Reports based on technical analysis
centers on studying charts of a stock's price movement and trading volume, as opposed to focusing on a company's fundamentals
and as such, may not match with a report on a company's fundamentals.
We do not undertake to advise you as to any change of our views expressed in this document. While we would endeavor to update
the information herein on a reasonable basis, Angel Broking, its subsidiaries and associated companies, their directors and
employees are under no obligation to update or keep the information current. Also there may be regulatory, compliance, or other
reasons that may prevent Angel Broking and affiliates from doing so. Prospective investors and others are cautioned that any
forward-looking statements are not predictions and may be subject to change without notice.
Angel Broking Limited and affiliates, including the analyst who has issued this report, may, on the date of this report, and from time
to time, have long or short positions in, and buy or sell the securities of the companies mentioned herein or engage in any other
transaction involving such securities and earn brokerage or compensation or act as advisor or have other potential conflict of interest
with respect to company/ies mentioned herein or inconsistent with any recommendation and related information and opinions.
Angel Broking Limited and affiliates may seek to provide or have engaged in providing corporate finance, investment banking or
other advisory services in a merger or specific transaction to the companies referred to in this report, as on the date of this report or
in the past.
Sebi Registration No : INB 010996539
For Private Circulation Only |