Daily Technical Report
June 25, 2012
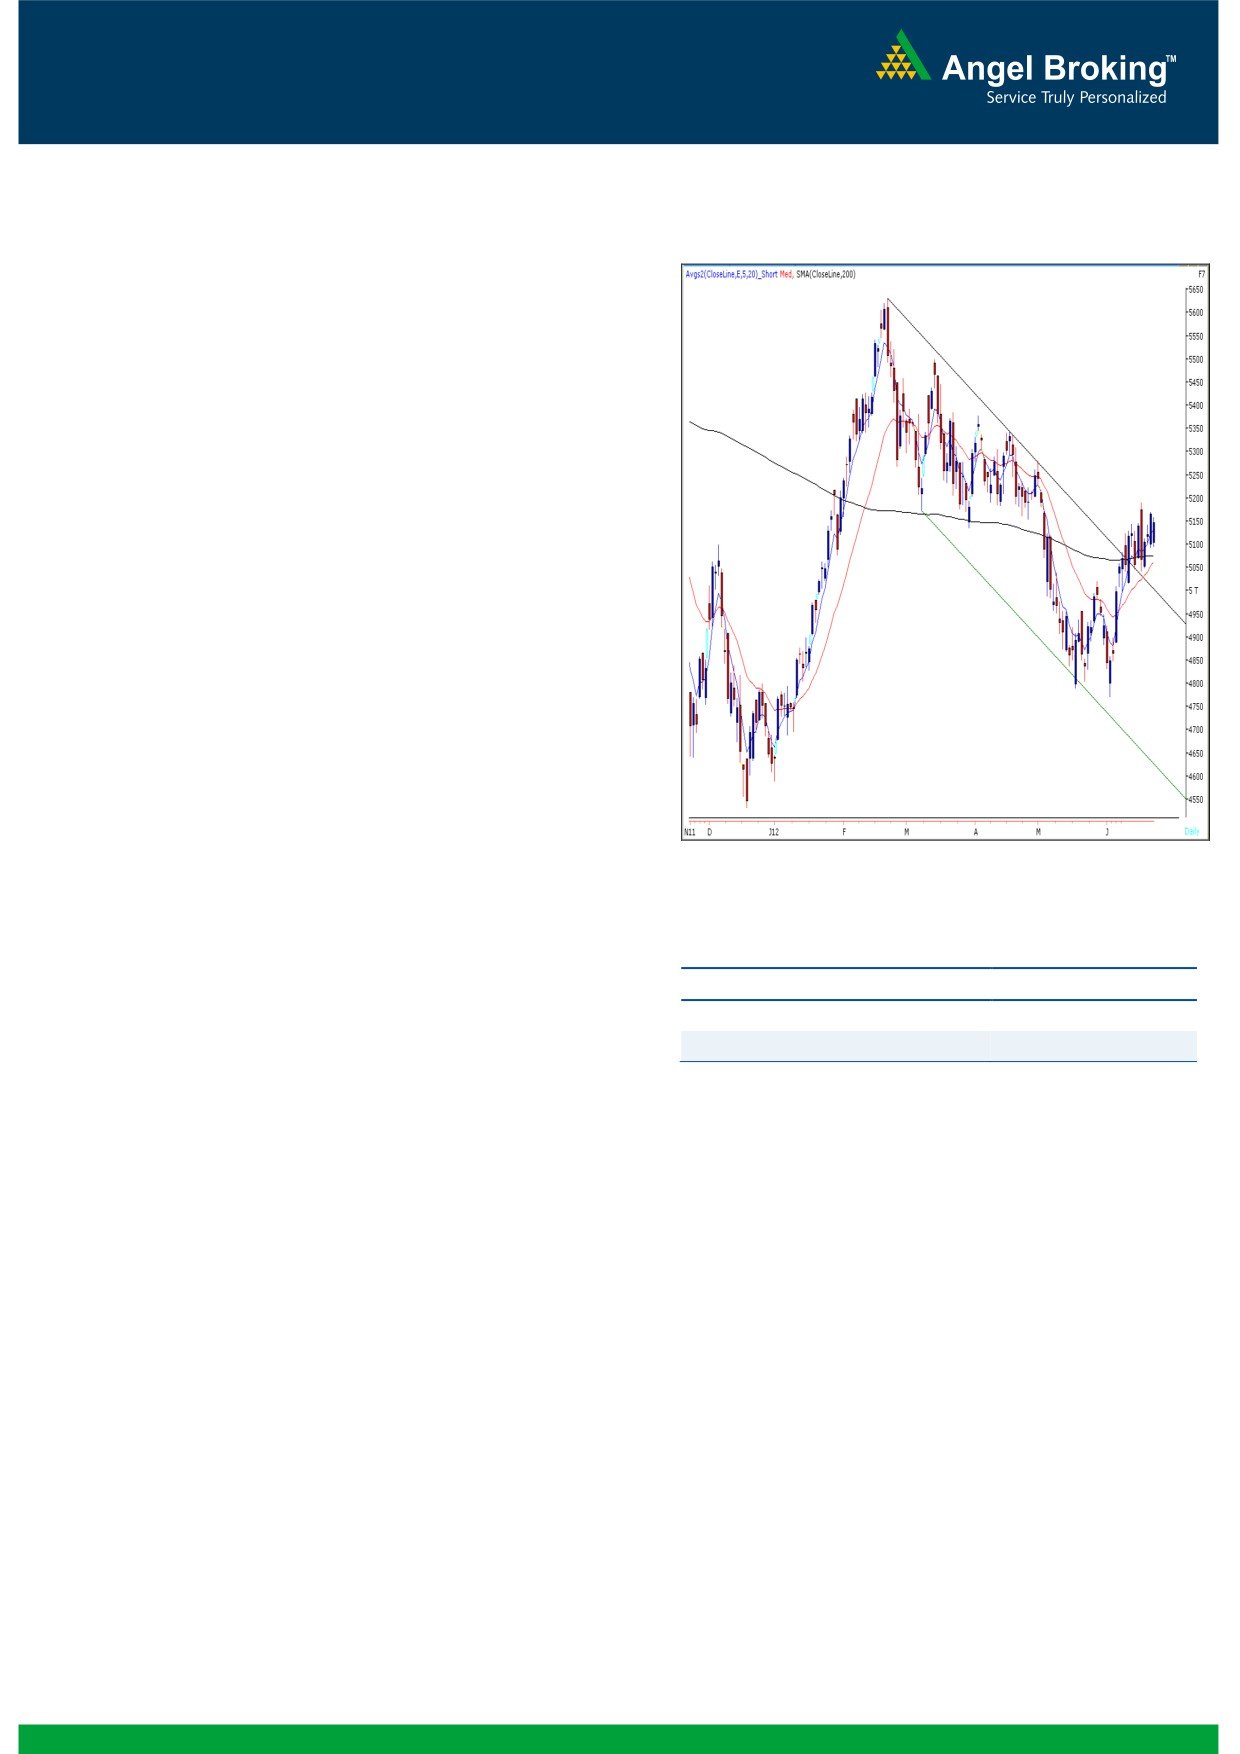
Exhibit 1: Nifty Daily Chart
Sensex (16973) / NIFTY (5146)
On Friday, our Benchmark indices witnessed a gap
down opening on the back of negative global clues
and tested the mentioned support level of
5093
during the initial part of the trading session. However,
significant buying during the second half, pushed
indices higher to close near day’s high. On sectoral
front, Realty, Auto and Power stocks remained positive
during Friday’s sessions; whereas Metal and
Consumer Goods sectors ended on a losing side. The
advance to decline ratio was marginally in favor of
declining counters (A=1363 D=1392) (Source
-
Formation
The 200-day SMA (Simple Moving Average) and
20-day EMA (Exponential Moving Average) have
now shifted to 16803 / 5075 and 16691 /
5061, respectively.
The ‘20-Week EMA’ is placed at 16854 / 5108
Source: Falcon
level.
On the daily chart, indices are trading well
Actionable points:
above the upper range of ‘Downward Sloping
Channel’ drawn by joining two highs of February
View
Bullish above 5190
22, 2012 - April 19, 2012 and low of March 7,
Expected target
5270
2012.
Support Levels
5093 - 5042
The positive crossover in weekly ‘RSI’ momentum
oscillator and weekly ‘3 & 8 EMA’ is still intact.
Also, the weekly ‘RSI-Smoothened’ is now
The benchmark indices are now trading well above
positively poised.
the ‘200-day SMA’ level as well as the upper trading
range of ‘Downward Slopping Channel’. The
positive crossover in weekly ‘RSI’ momentum
Trading strategy:
oscillator and weekly ‘3 & 8 EMA’ is still intact.
Broadly speaking, indices have traded in the range of
Further, the ‘RSI-Smoothened’ oscillator is now
17110 to 16553 / 5190 to 5015 over the last few
positively poised. The impact of this technical
sessions. Despite a disappointing outcome from the
indicator would be evident if indices sustain above
RBI monetary policy, significant rupee depreciation
17110 / 5190 level. This may trigger enhanced
and negative global clues, our indices remained firm
buying interest among market participants. As a
result, indices are expected to rally towards our
and closed well above the 5100 mark. This signifies
mentioned target of 17400 / 5270 or even higher.
immense strength in our markets. In our last weekly
We continue to be optimistic and traders are now
report, we had advised traders to use declines as a
advised to trail their stop loss from 4880 to 4995 on
buying opportunity. In-line with our expectation,
closing basis.
market participants have showed immense buying
interest near all support levels.
1
Daily Technical Report
June 25, 2012
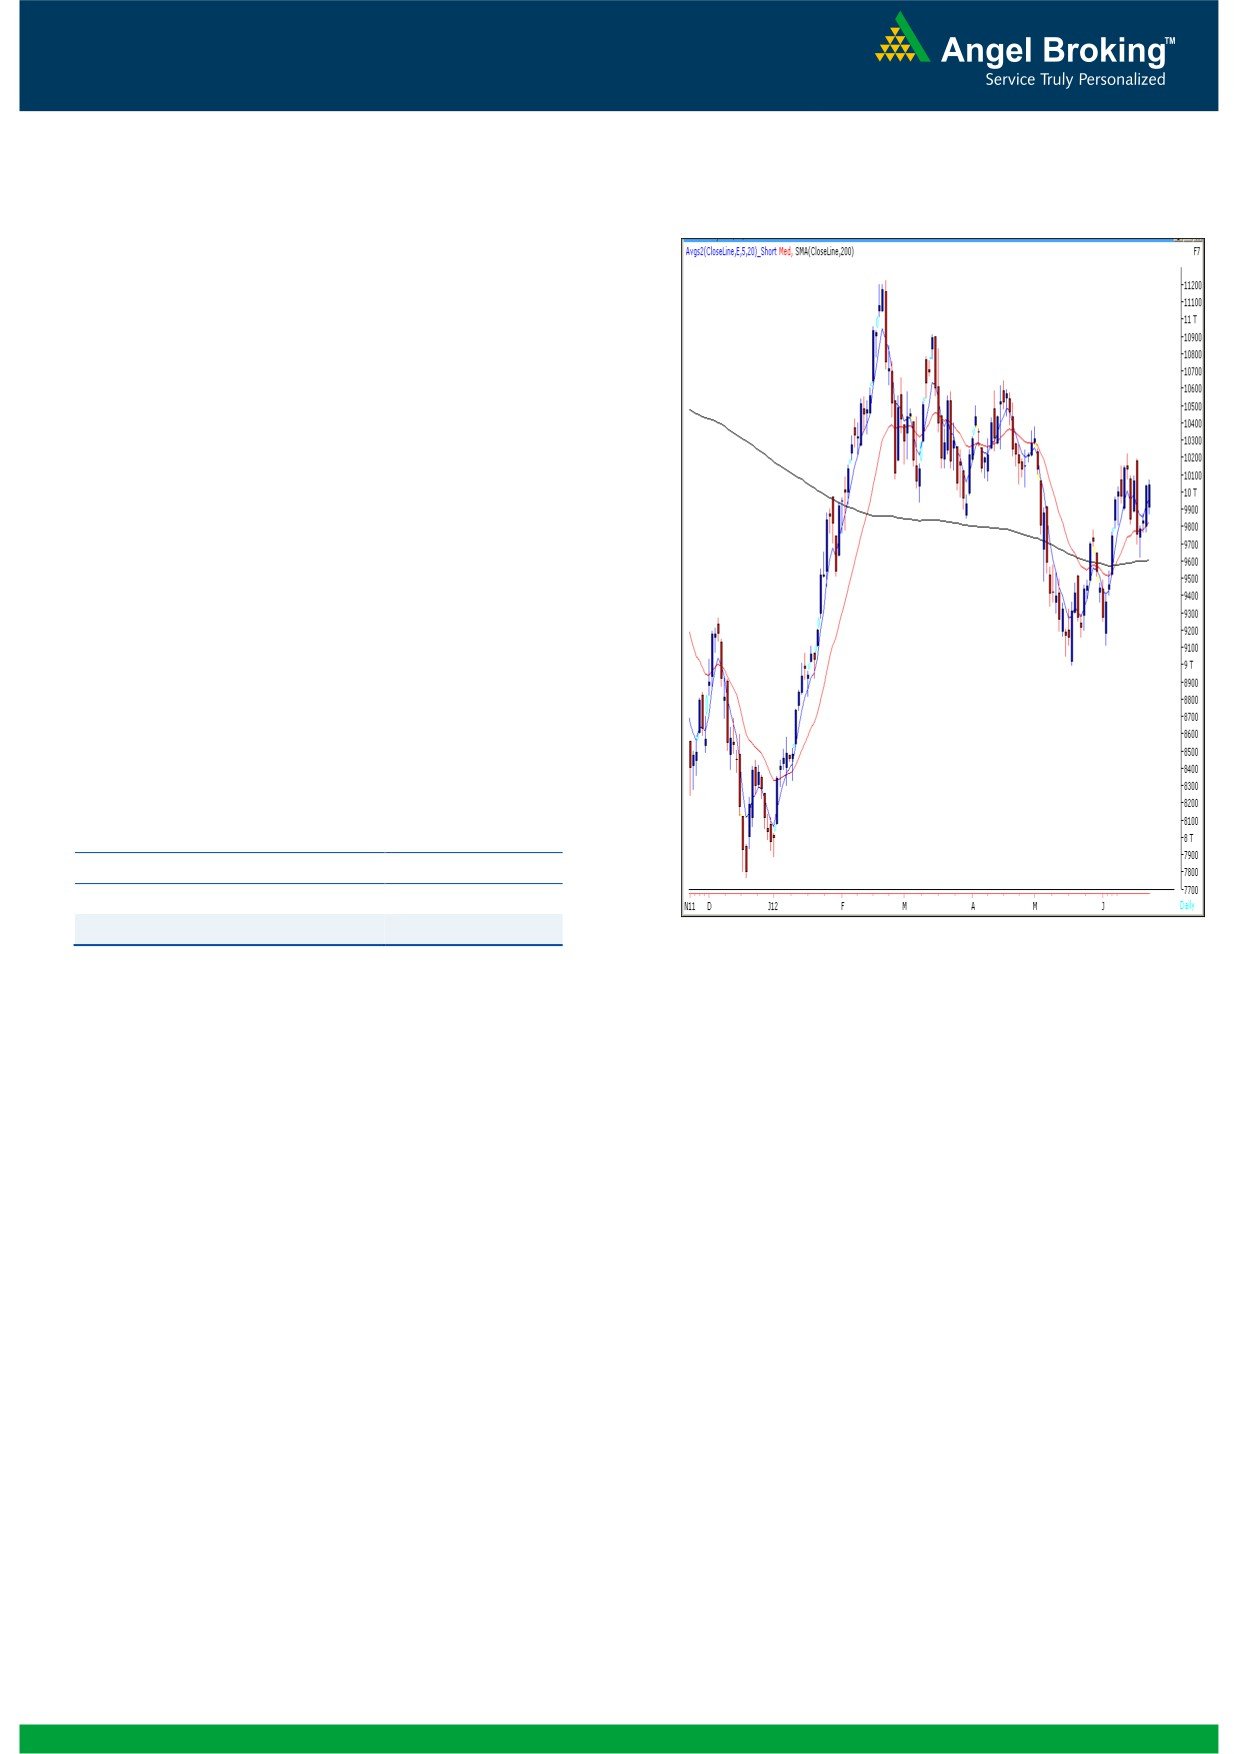
Exhibit 2: Bank Nifty Daily Chart
Bank Nifty Outlook - (10038)
On Friday, Bank Nifty opened on a flat note and
traded with extreme volatility throughout the session,
but managed to give a close near the highest point of
the day. As expected the index traded in the
mentioned range of 10225 - 9595 throughout the
week. The momentum oscillators on the daily and
weekly chart continue to be positive. Moreover we are
witnessing a positive crossover in “5 & 20 EMA” on
the weekly chart. However, the zone of 10180 -
10225 levels is likely to act as intermediate resistance
zone in coming trading session. A sustainable move
above this resistance zone is likely to trigger fresh
momentum on the upside. In this scenario Bank Nifty
is likely to rally towards 10292 - 10374 levels. On
the downside 9934 - 9873 levels are likely to act as
support in coming trading session. Positional traders
holding long positions can further trail their stop loss
to 9840 level (Closing basis) on Bank Nifty spot.
Actionable points:
View
Neutral
Resistance Levels
10180 - 10225
Support Levels
9934 - 9873
Source: Falcon
2
Daily Technical Report
June 25, 2012
Daily Pivot Levels for Nifty 50 Stocks
SCRIPS
S2
S1
PIVOT
R1
R2
SENSEX
16,724
16,848
16,932
17,056
17,140
NIFTY
5,067
5,107
5,133
5,173
5,199
BANKNIFTY
9,796
9,917
9,995
10,117
10,195
ACC
1,164
1,190
1,216
1,241
1,267
AMBUJACEM
160
164
166
170
173
ASIANPAINT
3,840
3,865
3,889
3,915
3,939
AXISBANK
987
1,001
1,011
1,025
1,036
BAJAJ-AUTO
1,508
1,527
1,543
1,562
1,578
BANKBARODA
680
694
702
717
725
BHARTIARTL
303
307
310
314
316
BHEL
214
217
221
225
229
BPCL
750
757
764
771
778
CAIRN
318
322
324
328
331
CIPLA
305
309
313
318
321
COALINDIA
332
335
339
342
346
DLF
186
190
193
197
199
DRREDDY
1,561
1,573
1,581
1,593
1,601
GAIL
332
336
339
343
346
GRASIM
2,358
2,442
2,488
2,573
2,618
HCLTECH
464
468
476
480
488
HDFC
625
633
637
645
649
HDFCBANK
532
538
542
548
552
HEROMOTOCO
2,027
2,057
2,084
2,114
2,141
HINDALCO
113
115
118
120
123
HINDUNILVR
455
458
461
464
467
ICICIBANK
825
838
846
859
867
IDFC
127
129
131
133
135
INFY
2,404
2,439
2,462
2,497
2,520
ITC
244
247
250
253
256
JINDALSTEL
421
427
434
441
447
JPASSOCIAT
68
70
71
73
75
KOTAKBANK
565
575
581
591
597
LT
1,329
1,346
1,358
1,375
1,387
M&M
681
689
697
705
712
MARUTI
1,058
1,080
1,097
1,119
1,135
NTPC
148
150
152
154
155
ONGC
269
274
277
283
286
PNB
751
765
775
789
798
POWERGRID
108
109
110
111
112
RANBAXY
479
484
489
494
500
RELIANCE
698
705
710
716
721
RELINFRA
514
526
534
546
555
SAIL
89
89
90
91
92
SBIN
2,101
2,129
2,157
2,185
2,213
SESAGOA
177
182
186
191
194
SIEMENS
700
708
715
722
730
STER
95
97
99
102
104
SUNPHARMA
601
605
610
613
618
TATAMOTORS
238
243
247
251
256
TATAPOWER
91
93
94
96
97
TATASTEEL
410
414
421
425
431
TCS
1,204
1,219
1,229
1,244
1,255
WIPRO
388
394
399
405
411
3
Daily Technical Report
June 25, 2012
Research Team Tel: 022 - 39357800
DISCLAIMER
This document is solely for the personal information of the recipient, and must not be singularly used as the basis of any investment
decision. Nothing in this document should be construed as investment or financial advice. Each recipient of this document should make
such investigations as they deem necessary to arrive at an independent evaluation of an investment in the securities of the companies
referred to in this document (including the merits and risks involved), and should consult their own advisors to determine the merits and
risks of such an investment.
Angel Broking Limited, its affiliates, directors, its proprietary trading and investment businesses may, from time to time, make
investment decisions that are inconsistent with or contradictory to the recommendations expressed herein. The views contained in this
document are those of the analyst, and the company may or may not subscribe to all the views expressed within.
Reports based on technical and derivative analysis center on studying charts of a stock's price movement, outstanding positions and
trading volume, as opposed to focusing on a company's fundamentals and, as such, may not match with a report on a company's
fundamentals.
The information in this document has been printed on the basis of publicly available information, internal data and other reliable
sources believed to be true, but we do not represent that it is accurate or complete and it should not be relied on as such, as this
document is for general guidance only. Angel Broking Limited or any of its affiliates/ group companies shall not be in any way
responsible for any loss or damage that may arise to any person from any inadvertent error in the information contained in this report.
Angel Broking Limited has not independently verified all the information contained within this document. Accordingly, we cannot testify,
nor make any representation or warranty, express or implied, to the accuracy, contents or data contained within this document. While
Angel Broking Limited endeavours to update on a reasonable basis the information discussed in this material, there may be regulatory,
compliance, or other reasons that prevent us from doing so.
This document is being supplied to you solely for your information, and its contents, information or data may not be reproduced,
redistributed or passed on, directly or indirectly.
Angel Broking Limited and its affiliates may seek to provide or have engaged in providing corporate finance, investment banking or
other advisory services in a merger or specific transaction to the companies referred to in this report, as on the date of this report or in
the past.
Neither Angel Broking Limited, nor its directors, employees or affiliates shall be liable for any loss or damage that may arise from or in
connection with the use of this information.
Note: Please refer to the important `Stock Holding Disclosure' report on the Angel website (Research Section). Also, please refer to the
latest update on respective stocks for the disclosure status in respect of those stocks. Angel Broking Limited and its affiliates may have
investment positions in the stocks recommended in this report.
Research Team
Shardul Kulkarni
-
Head - Technicals
Sameet Chavan
-
Technical Analyst
Sacchitanand Uttekar
-
Technical Analyst
Mehul Kothari
-
Technical Analyst
Ankur Lakhotia
-
Technical Analyst
Angel Broking Pvt. Ltd.
Registered Office: G-1, Ackruti Trade Centre, Rd. No. 7, MIDC, Andheri (E), Mumbai - 400 093.
Corporate Office: 6th Floor, Ackruti Star, MIDC, Andheri (E), Mumbai - 400 093. Tel: (022) 3952 6600
Sebi Registration No: INB 010996539
4