Technical Research | April 24, 2012
Daily Technical Report
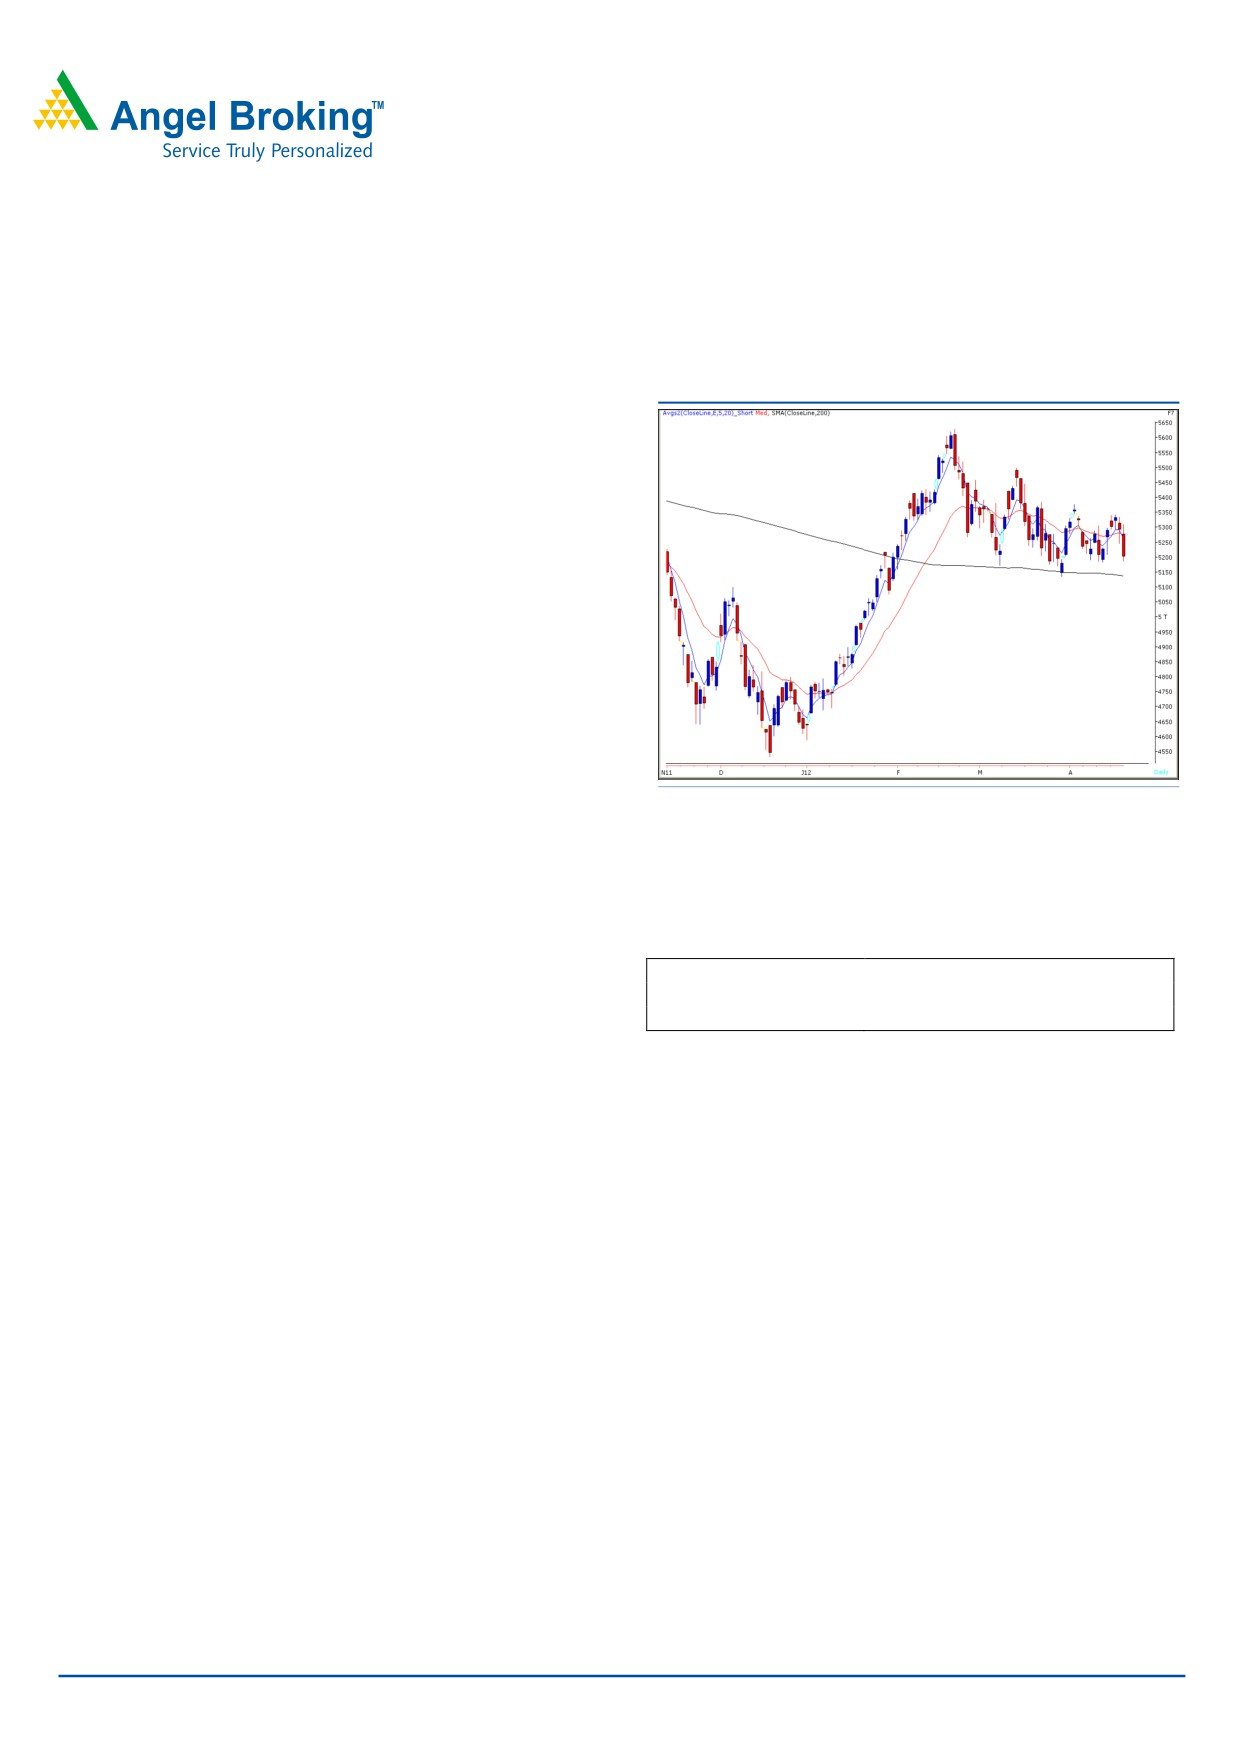
Sensex (17097) / NIFTY (5201)
Exhibit 1: Nifty Daily Chart
The week began on a flat note in-line with mixed global
cues. However, we witnessed strong selling pressure during
the second half, which dragged indices significant lower to
close at the support level near the 5200 mark. On sectoral
front, Realty, Teck, IT and Metal sectors corrected sharply
during yesterday’s session. There was no sector in the
positive territory. The advance to decline ratio was strongly
in favor of declining counters (A=990 D=1800) (Source -
Formation:
• The 200-day SMA (Simple Moving Average) and 20-day
Source: Falcon
EMA (Exponential Moving Average) have now shifted to
17050 / 5135 and 17400 / 5300, respectively.
• The ‘20-Week EMA’ is placed at 17200 / 5200 level.
Actionable points:
Trading strategy:
View
Neutral
Resistance level
5311
We witnessed a quiet opening on the back of mixed
Support Levels
5187 - 5135
sentiments across Asian markets. Indices moved in a narrow
range during the first half, but immense selling pressure
near day’s high dragged indices significantly lower to close
well in the negative territory. Going forward, yesterday’s low
of 17056 / 5187, which also nearly coincides with the “20
week EMA”, remains a crucial intermediate support for our
markets. In case of a violation of this low, the market is
likely to drift further down to test 16920 / 5135 level which
is near the ‘200-day SMA’ mark. On the upside, yesterday’s
high of
17445 / 5311 is likely to act as immediate
resistance for the coming few sessions.
For Private Circulation Only |
1
Technical Research | April 24, 2012
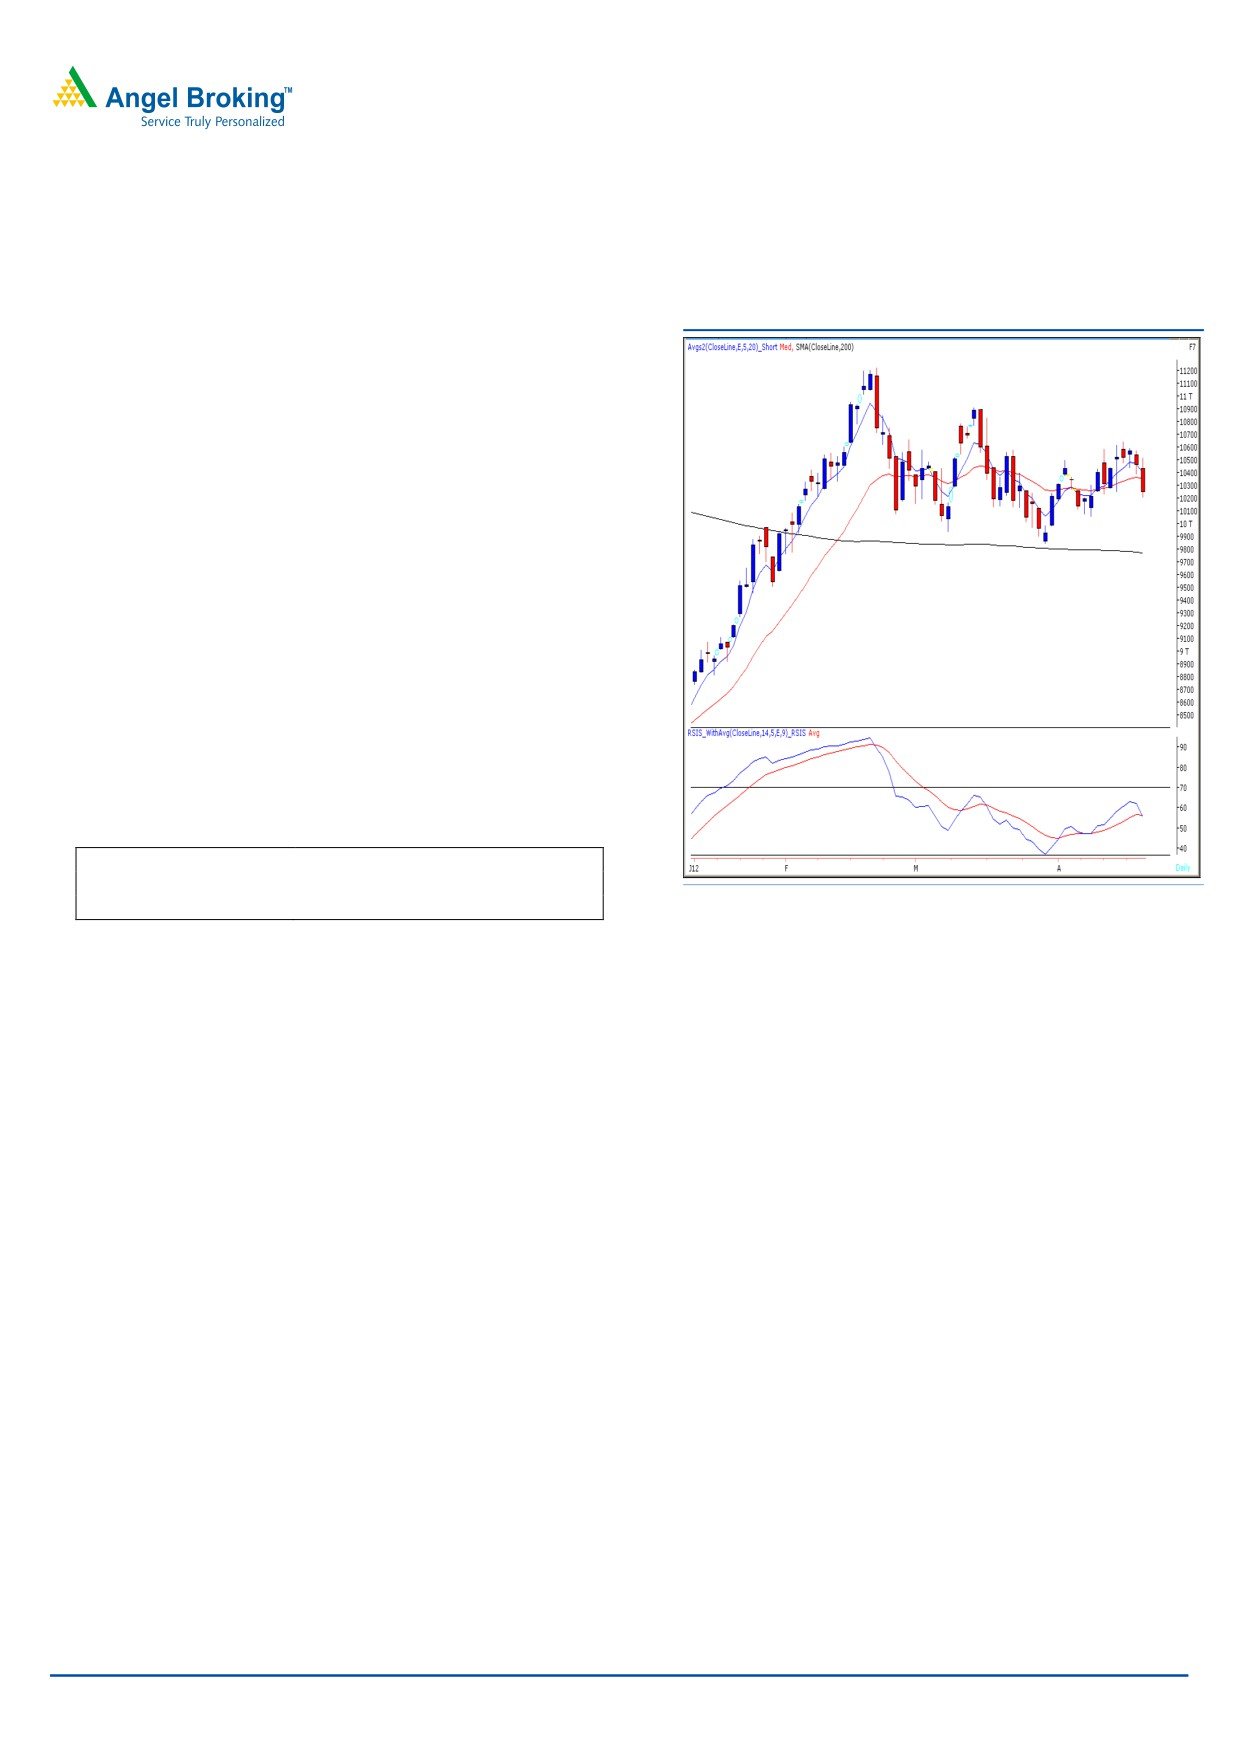
Bank Nifty Outlook - (10243)
Exhibit 2: Bank Nifty Daily Chart
Yesterday, Bank Nifty opened on a flat note and selling
pressure dragged the index to close marginally below the
mentioned support level of 10250. We are now observing
a negative crossover in “RSI - Smoothened” momentum
oscillator on the daily chart. The trading range of 10600
- 10150 mentioned in our previous reports is still intact.
Moreover, on the hourly chart we are observing an
upward sloping trend line breakdown at 10330 which is
a sign of concern. Thus, a sustainable move below
yesterday’s low of 10206 level is likely drag the index
lower to test 10150 - 10125 levels. On the upside 10350
- 10401 level is likely to act as resistance in coming
trading session.
Actionable points:
View
Neutral
Support Levels
10150 - 10125
Source: Falcon
Resistance Levels
10350 - 10401
For Private Circulation Only |
2
Technical Research | April 24, 2012
Positive Bias:
Buying
Expected
Stock Name
CMP
5 Day EMA
20 Day EMA
Remarks
Range
Target
3390 -
View will change below
Asian Paints
3471
3373.2
3278.9
3725
3471
3290
Negative Bias:
Negative
Expected
Stock Name
CMP
5 Day EMA
20 Day EMA
Remarks
Below
Target
HDIL
View will change Above
82.55
86
88.5
81.7
73
86.25
For Private Circulation Only |
3
Technical Research | April 24, 2012
Daily Pivot Levels for Nifty 50 Stocks
SCRIPS
S2
S1
PIVOT
R1
R2
SENSEX
16,812
16,954
17,199
17,342
17,587
NIFTY
5,109
5,155
5,233
5,278
5,356
BANKNIFTY
10,009
10,126
10,324
10,441
10,638
ACC
1,199
1,221
1,237
1,260
1,276
AMBUJACEM
154
156
159
161
165
AXISBANK
1,089
1,112
1,150
1,173
1,211
BAJAJ-AUTO
1,634
1,655
1,687
1,708
1,741
BHARTIARTL
300
306
316
323
333
BHEL
227
231
240
244
252
BPCL
655
665
682
692
709
CAIRN
331
336
344
349
357
CIPLA
308
312
318
322
329
COALINDIA
343
349
358
364
374
DLF
183
186
191
194
199
DRREDDY
1,745
1,762
1,788
1,805
1,831
GAIL
343
348
356
361
369
HCLTECH
485
490
499
504
513
HDFC
677
680
685
688
693
HDFCBANK
536
540
548
553
561
HEROMOTOCO
2,093
2,120
2,165
2,192
2,236
HINDALCO
114
116
121
124
128
HINDUNILVR
411
414
419
422
428
ICICIBANK
817
831
850
863
882
IDFC
119
122
126
130
134
INFY
2,250
2,281
2,335
2,366
2,420
ITC
242
243
246
247
249
JINDALSTEL
464
474
489
499
514
JPASSOCIAT
72
74
76
78
80
KOTAKBANK
562
571
584
593
606
LT
1,249
1,251
1,279
1,281
1,308
M&M
693
704
719
730
745
MARUTI
1,350
1,364
1,386
1,400
1,422
NTPC
162
164
165
167
169
ONGC
262
265
268
271
274
PNB
867
878
896
907
925
POWERGRID
108
109
112
113
116
RANBAXY
511
514
518
521
525
RCOM
78
80
83
85
88
RELIANCE
714
725
735
747
757
RELINFRA
497
512
537
553
578
RPOWER
103
106
111
114
119
SAIL
93
95
98
100
103
SBIN
2,121
2,157
2,218
2,254
2,316
SESAGOA
174
178
184
188
195
SIEMENS
768
778
796
807
824
STER
105
105
107
107
110
SUNPHARMA
579
587
593
602
608
SUZLON
22
22
23
23
24
TATAMOTORS
302
306
313
317
324
TATAPOWER
99
100
103
105
107
TATASTEEL
448
455
467
475
487
TCS
1,017
1,040
1,071
1,095
1,126
WIPRO
419
421
424
427
429
Technical Research Team
For Private Circulation Only |
4
Technical Report
RESEARCH TEAM
Shardul Kulkarni
Head - Technicals
Sameet Chavan
Technical Analyst
Sacchitanand Uttekar
Technical Analyst
Mehul Kothari
Technical Analyst
Ankur Lakhotia
Technical Analyst
Research Team: 022-3952 6600
DISCLAIMER: This document is not for public distribution and has been furnished to you solely for your information and must not
be reproduced or redistributed to any other person. Persons into whose possession this document may come are required to observe
these restrictions.
Opinion expressed is our current opinion as of the date appearing on this material only. While we endeavor to update on a
reasonable basis the information discussed in this material, there may be regulatory, compliance, or other reasons that prevent us
from doing so. Prospective investors and others are cautioned that any forward-looking statements are not predictions and may be
subject to change without notice. Our proprietary trading and investment businesses may make investment decisions that are
inconsistent with the recommendations expressed herein.
The information in this document has been printed on the basis of publicly available information, internal data and other reliable
sources believed to be true and are for general guidance only. While every effort is made to ensure the accuracy and completeness of
information contained, the company takes no guarantee and assumes no liability for any errors or omissions of the information. No
one can use the information as the basis for any claim, demand or cause of action.
Recipients of this material should rely on their own investigations and take their own professional advice. Each recipient of this
document should make such investigations as it deems necessary to arrive at an independent evaluation of an investment in the
securities of companies referred to in this document (including the merits and risks involved), and should consult their own advisors to
determine the merits and risks of such an investment. Price and value of the investments referred to in this material may go up or
down. Past performance is not a guide for future performance. Certain transactions - futures, options and other derivatives as well as
non-investment grade securities - involve substantial risks and are not suitable for all investors. Reports based on technical analysis
centers on studying charts of a stock's price movement and trading volume, as opposed to focusing on a company's fundamentals
and as such, may not match with a report on a company's fundamentals.
We do not undertake to advise you as to any change of our views expressed in this document. While we would endeavor to update
the information herein on a reasonable basis, Angel Broking, its subsidiaries and associated companies, their directors and
employees are under no obligation to update or keep the information current. Also there may be regulatory, compliance, or other
reasons that may prevent Angel Broking and affiliates from doing so. Prospective investors and others are cautioned that any
forward-looking statements are not predictions and may be subject to change without notice.
Angel Broking Limited and affiliates, including the analyst who has issued this report, may, on the date of this report, and from time
to time, have long or short positions in, and buy or sell the securities of the companies mentioned herein or engage in any other
transaction involving such securities and earn brokerage or compensation or act as advisor or have other potential conflict of interest
with respect to company/ies mentioned herein or inconsistent with any recommendation and related information and opinions.
Angel Broking Limited and affiliates may seek to provide or have engaged in providing corporate finance, investment banking or
other advisory services in a merger or specific transaction to the companies referred to in this report, as on the date of this report or
in the past.
Sebi Registration No: INB 010996539
For Private Circulation Only |